Teacher Portal:
Exploring Density
Investigation 3
Investigation Three:
Densities of Different Liquids
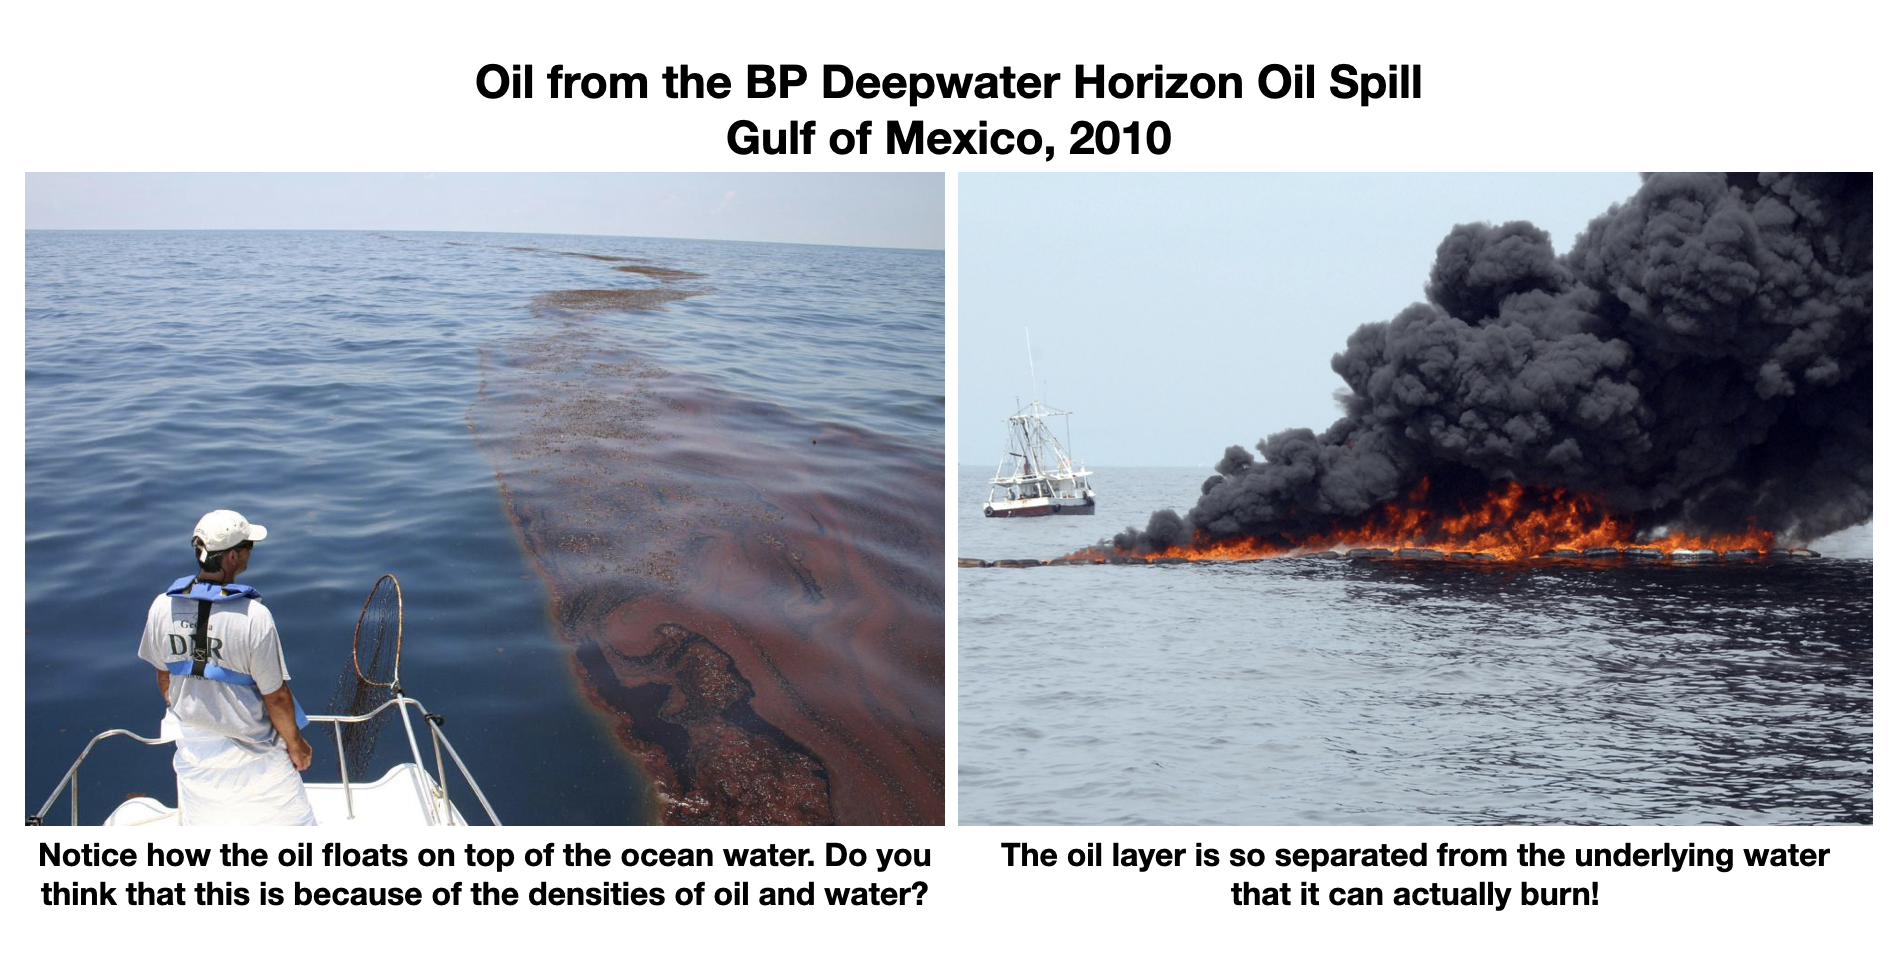
It is important for us to stop and reflect on just how relevant science and science education is to real problems in the world. The two pictures below are of the BP oil spill that took place in the Gulf of Mexico from April 20 through September 19, 2010. The density of the crude oil is about 0.8 g/ml (grams per milliliter) compared to about 1.o g/ml for water, as students calculated in Investigation Two. This difference in density caused the spilled oil to float atop the ocean water.
In Investigation One, students explored the concept that different liquids were more buoyant than others apparently due to differences in their densities. In Investigation Two, students were introduced to the concept that the density of a specific type of matter, water, is a constant. Students 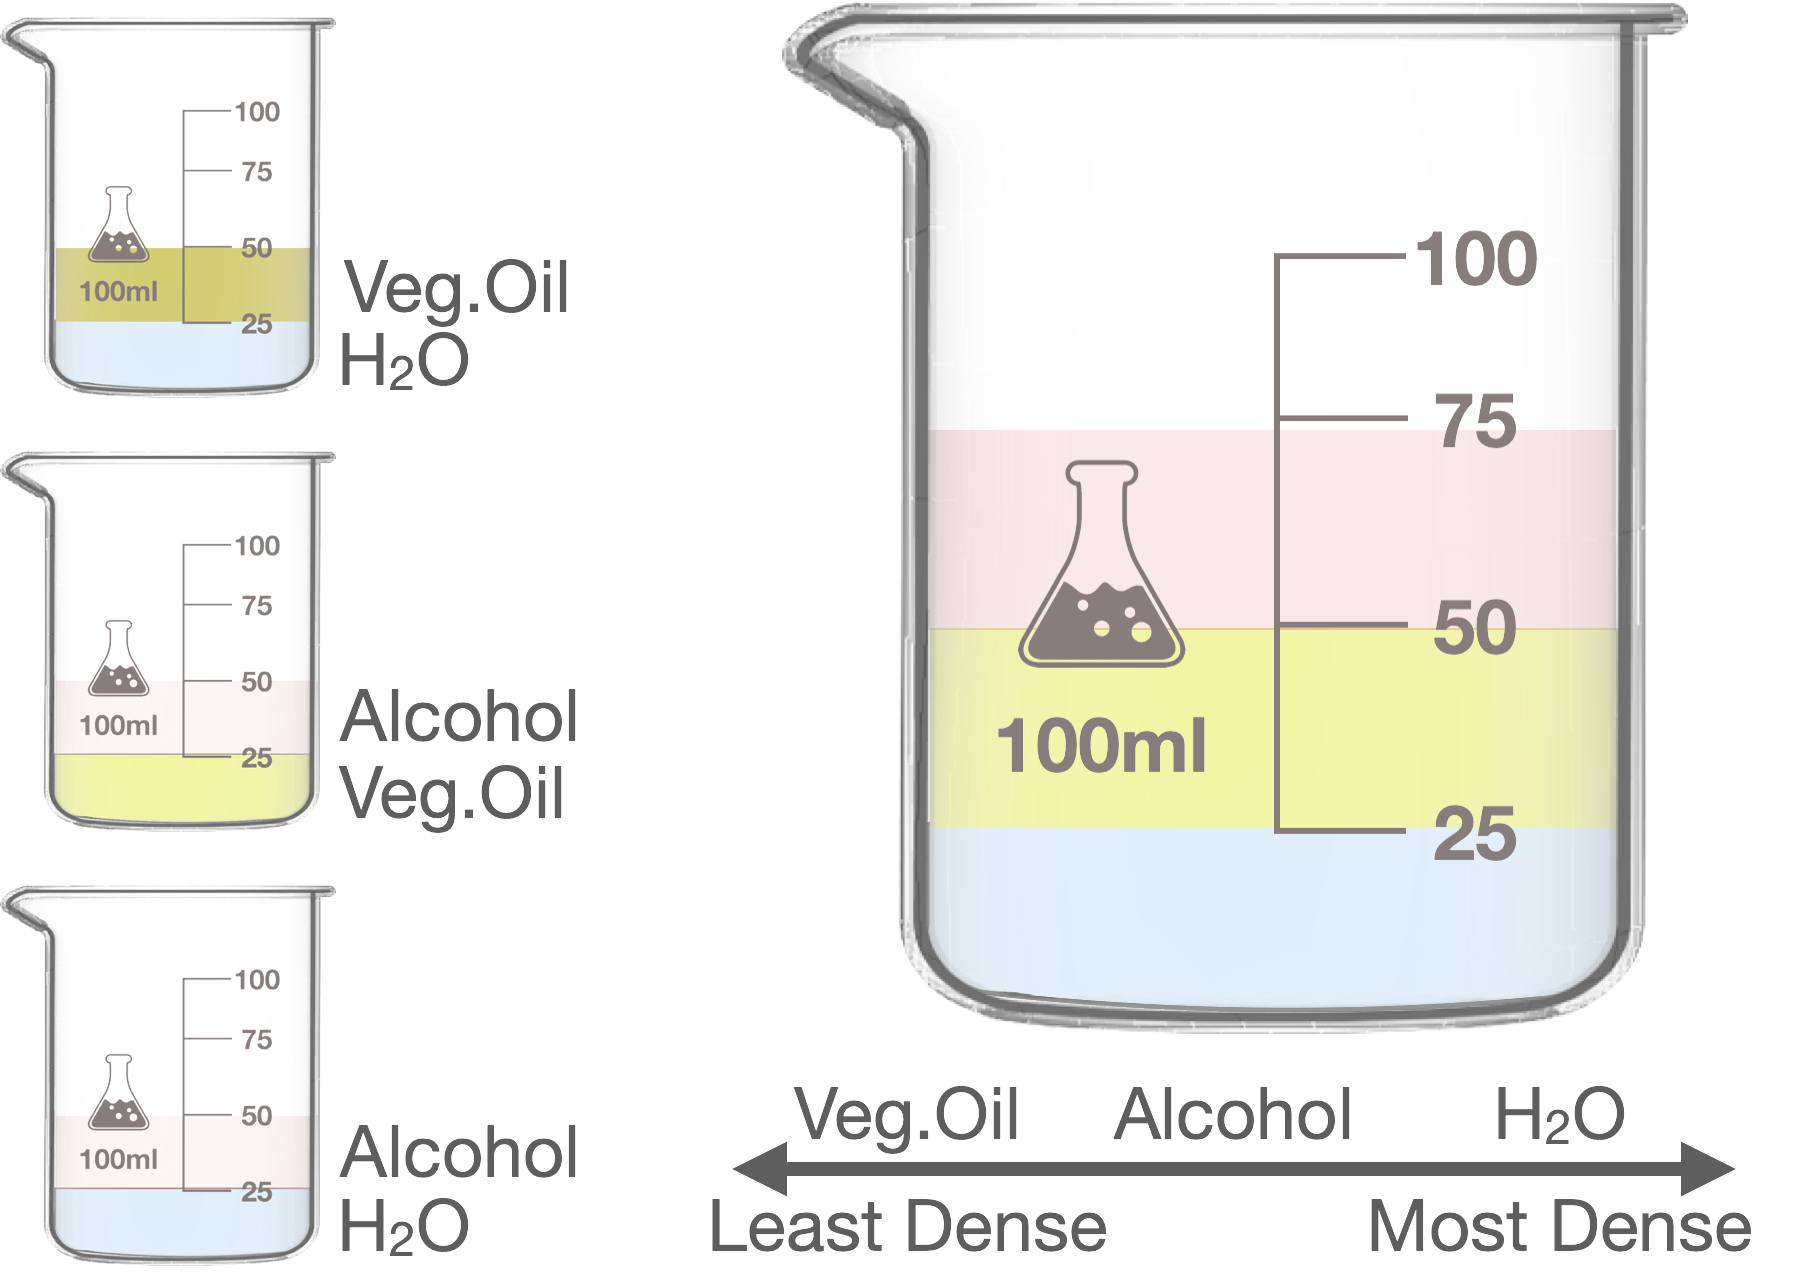 also were introduced to the concept that density is not dependent solely on the mass or the volume of matter but on the ratio of the mass to the volume.
Investigation Three builds on the concepts introduced in the previous two Investigations. In Investigation Three, students will calculate the densities of vegetable oil and rubbing alcohol, the liquids that were explored in Investigation One. They will also retrieve the density of water that was calculated in Investigation Two and compare the densities of the three liquids to one another. Having calculated the densities of these three liquids, students will be able to correlate the physical behavior of the liquids that they observed in Investigation One with the calculated densities of the liquids.
 Investigation Three provides students with additional opportunities to investigate the concept that each type of matter possesses a constant density. Students will determine that each of the three liquids possesses a density that is constant but is different from the densities of the other liquids. By calculating the densities of different volumes of liquids, Investigation Three provides students with the opportunity to demonstrate again that density is dependent on the ratio of mass to volume. Students will graphically demonstrate that a best-fit line of density plotted versus volume is a straight and horizontal line since density is not dependent on volume.
In Investigation Three, students groups will independently calculate the density of different volumes of rubbing alcohol and vegetable oil, generating several determinations of the density of each liquid. While all the density determinations will be close in value, there will be obvious differences among them. The difference among a group of experimental values is termed the precision of these values. A higher precision denotes that the set of values are very close together. How close the value of a determination is to the actual value is termed the accuracy. The values for the densities will be averaged to illustrate how errors can be overcome by combining multiple values each of which might not be accurate.
Exploring Density: Investigation 3 - Mathematics Concepts
Prelab
- comparing (non)measurable characteristics
- greater than/less than/equal to
- derived properties
- quantitative properties
- density in g/mL
- grouping
- calculating average
- addition
- division
- data table
- line graph
- skip counting by 0.5 and 10
- patterns/trends
- least to greatest
Lab
- volume in mL
- comparing values
- calculating mass using a triple beam balance
- division
- decimals to the nearest hundredth
- data table
- mass in grams
- density in g/mL
Postlab
- data table
- volume in mL
- calculating averages
- addition
- division
- whole numbers
- decimals to the nearest hundredth
- line graph
- patterns/trends
- skip counting by 0.5 and 10
- data analysis
- least to greatest
- (in)direct relationships
- comparing values
- problem-solving
Exploring Density: Investigation 3 - Procedural Tools

Exploring Density: Investigation 3 - Cognitive Tools
Exploring Density:
Investigation 3 Quiz

