Teacher Portal:
Exploring Density
Investigation 3 – PostLab
 PRINT IT
Use your browser to download a printable PDF as help during the slide presentation and to make additional notes. In your browser, go to File > Print and then choose to save as PDF.
NAVIGATE IT
Once the slide presentation is launched
- use your left and right arrows to advance or go back in the slide presentation, and
- hover your mouse over the left edge of the presentation to get a view of the thumbnails for all the slides so that you can quickly move anywhere in the presentation.
- Click HERE to launch the slide presentation for the CELL.
SHARE IT
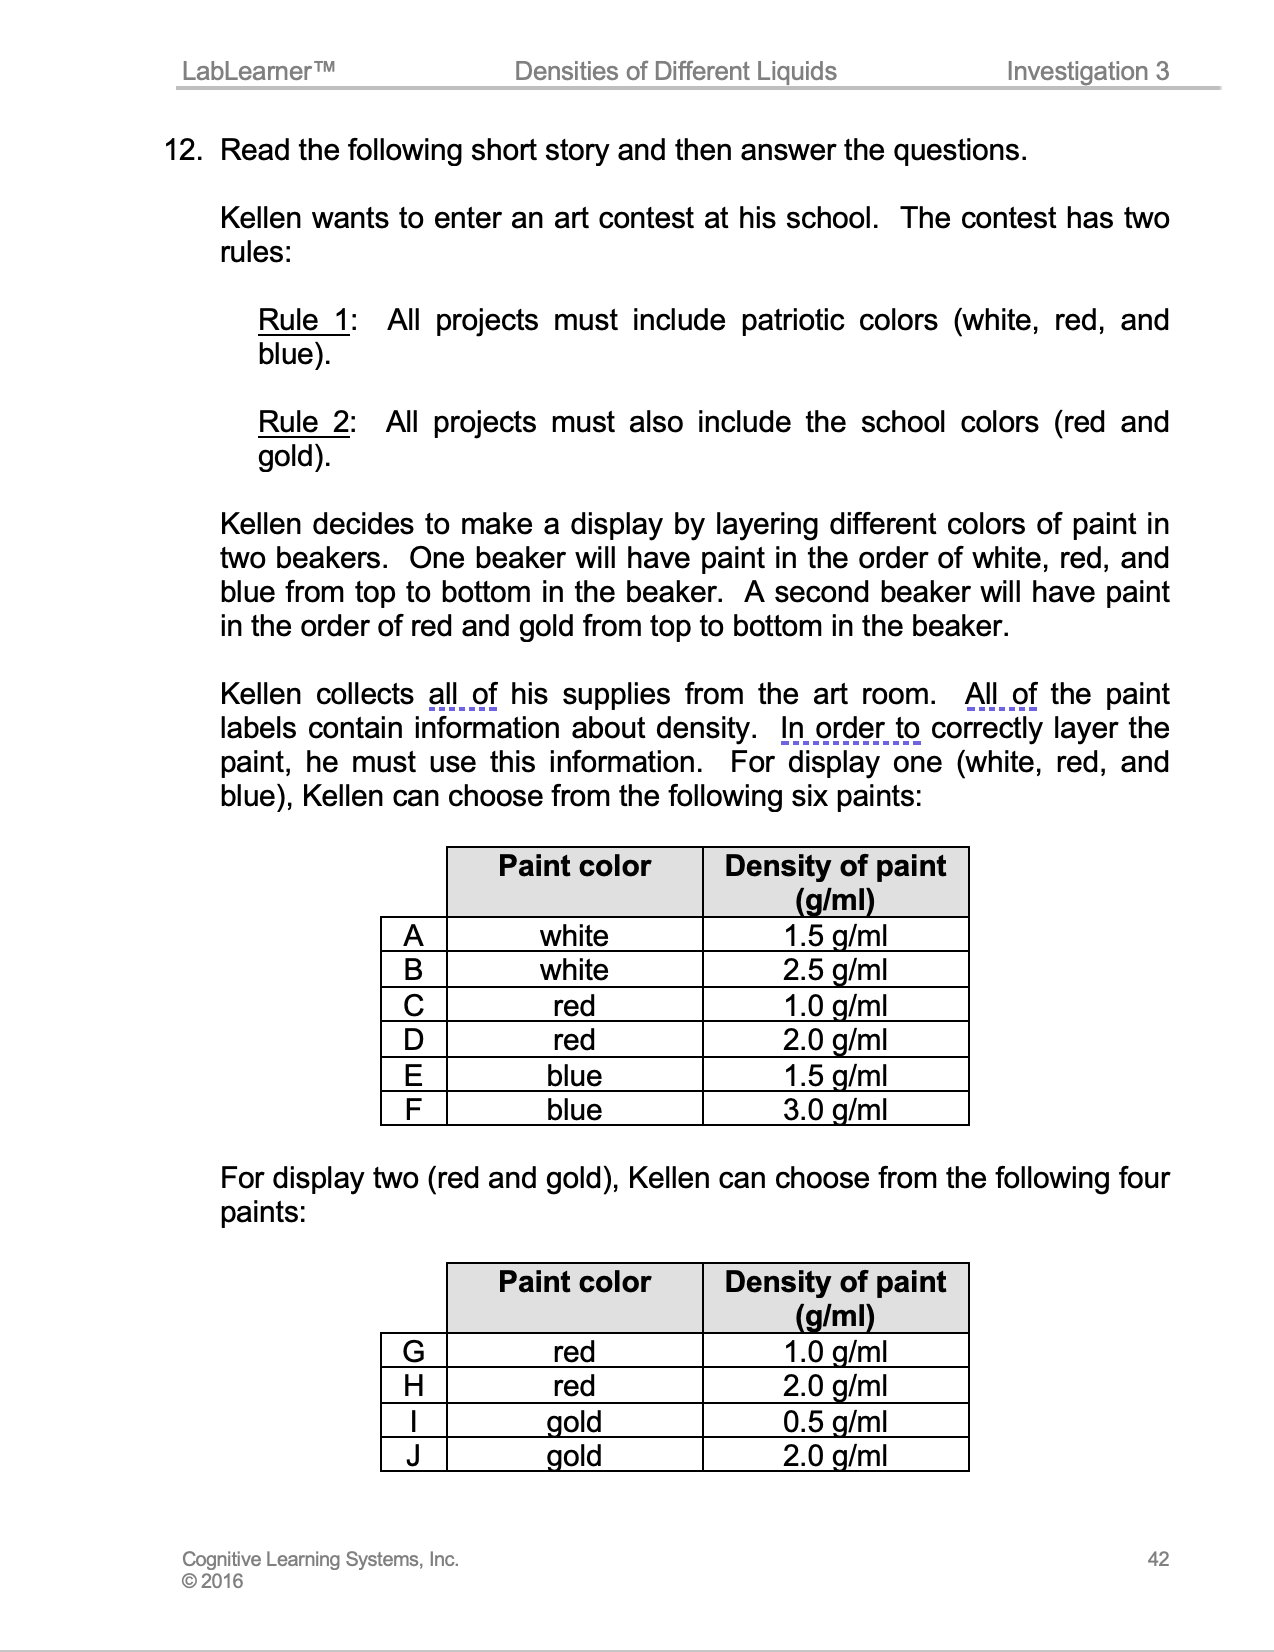
SLIDE VDEN3-post-1
This is the third Investigation of the LabLearner CELL Density. In this Investigation, students determined the density of rubbing alcohol and vegetable oil.
______________________________________________
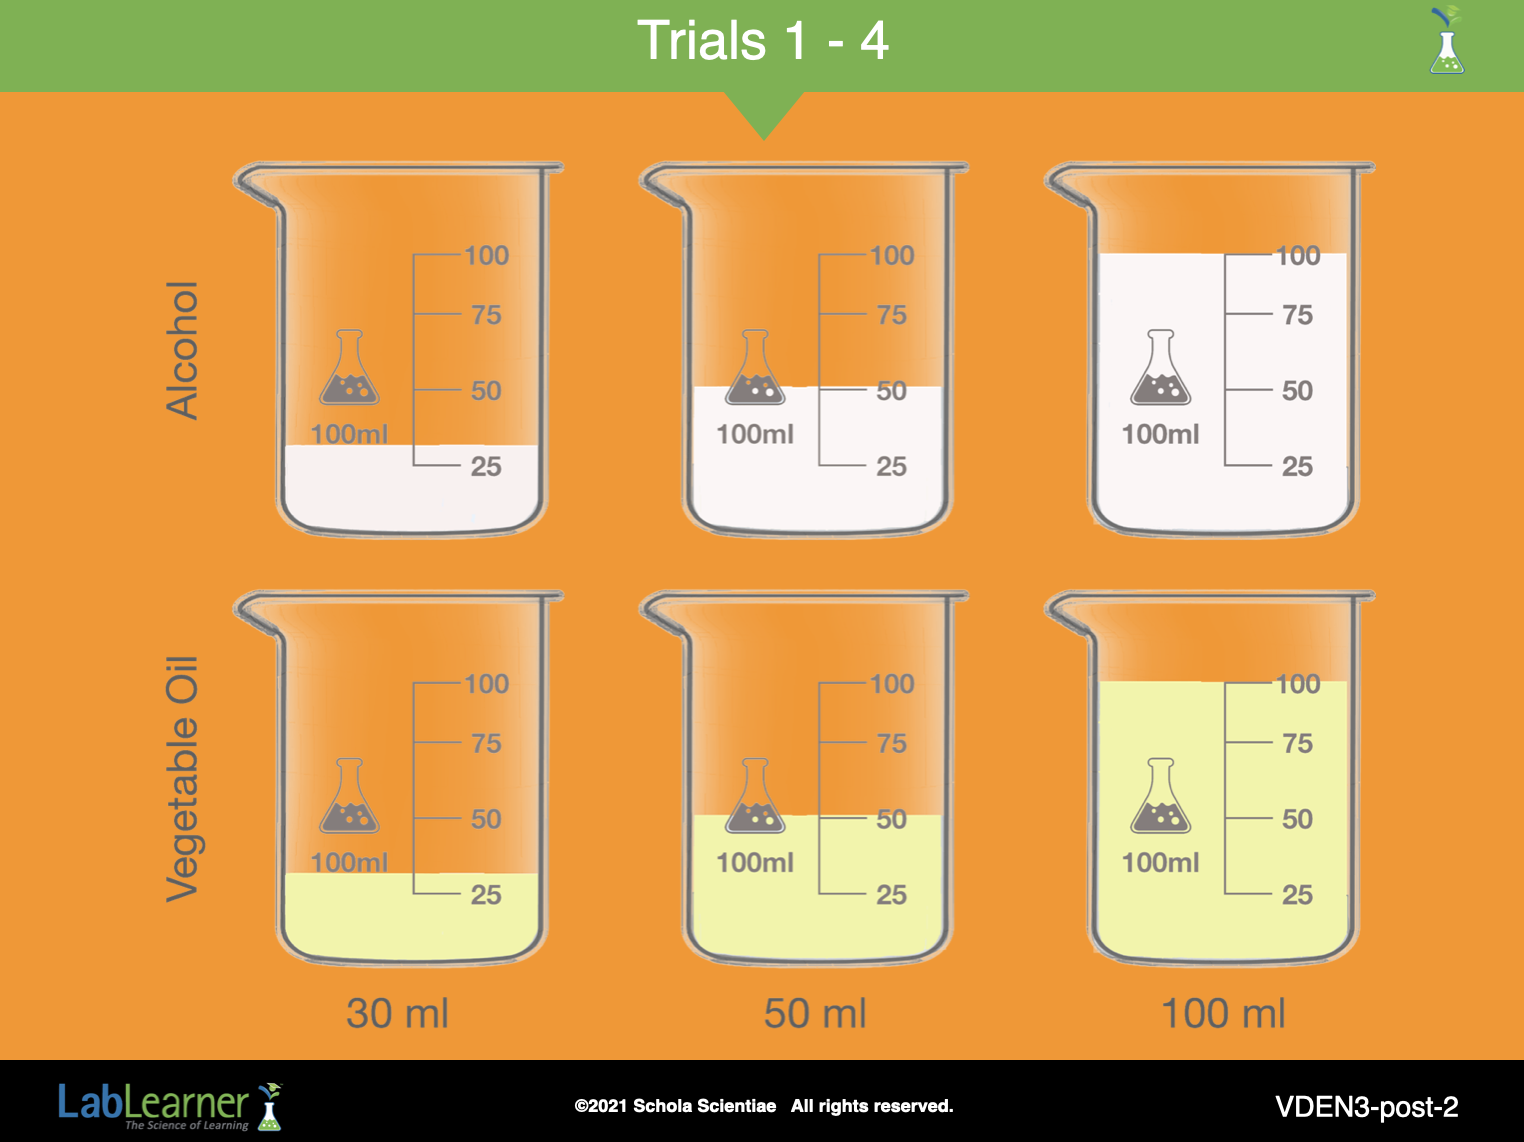
SLIDE VDEN3-post-2
A. Begin this part of the investigation by asking students to summarize the experiments they conducted during the Lab portion of this investigation.
1. Ask students: What were the questions that you investigated during the experiments in the Lab? The questions investigated were: Will different volumes of rubbing alcohol and vegetable oil have different densities? Is the density of rubbing alcohol and vegetable oil different from the density of water? Does the density of rubbing alcohol and vegetable oil depend on the volume and mass of the sample? Is the density of rubbing alcohol and vegetable oil a constant value?
2. Ask students: What types of experiments did you conduct to answer the questions? Students used different samples of rubbing alcohol and vegetable oil. They measured the mass from 30 ml, 50 ml, and 100 ml samples of rubbing alcohol and vegetable oil. The density of each was then calculated using the formula:
density = mass ÷ volume
______________________________________________
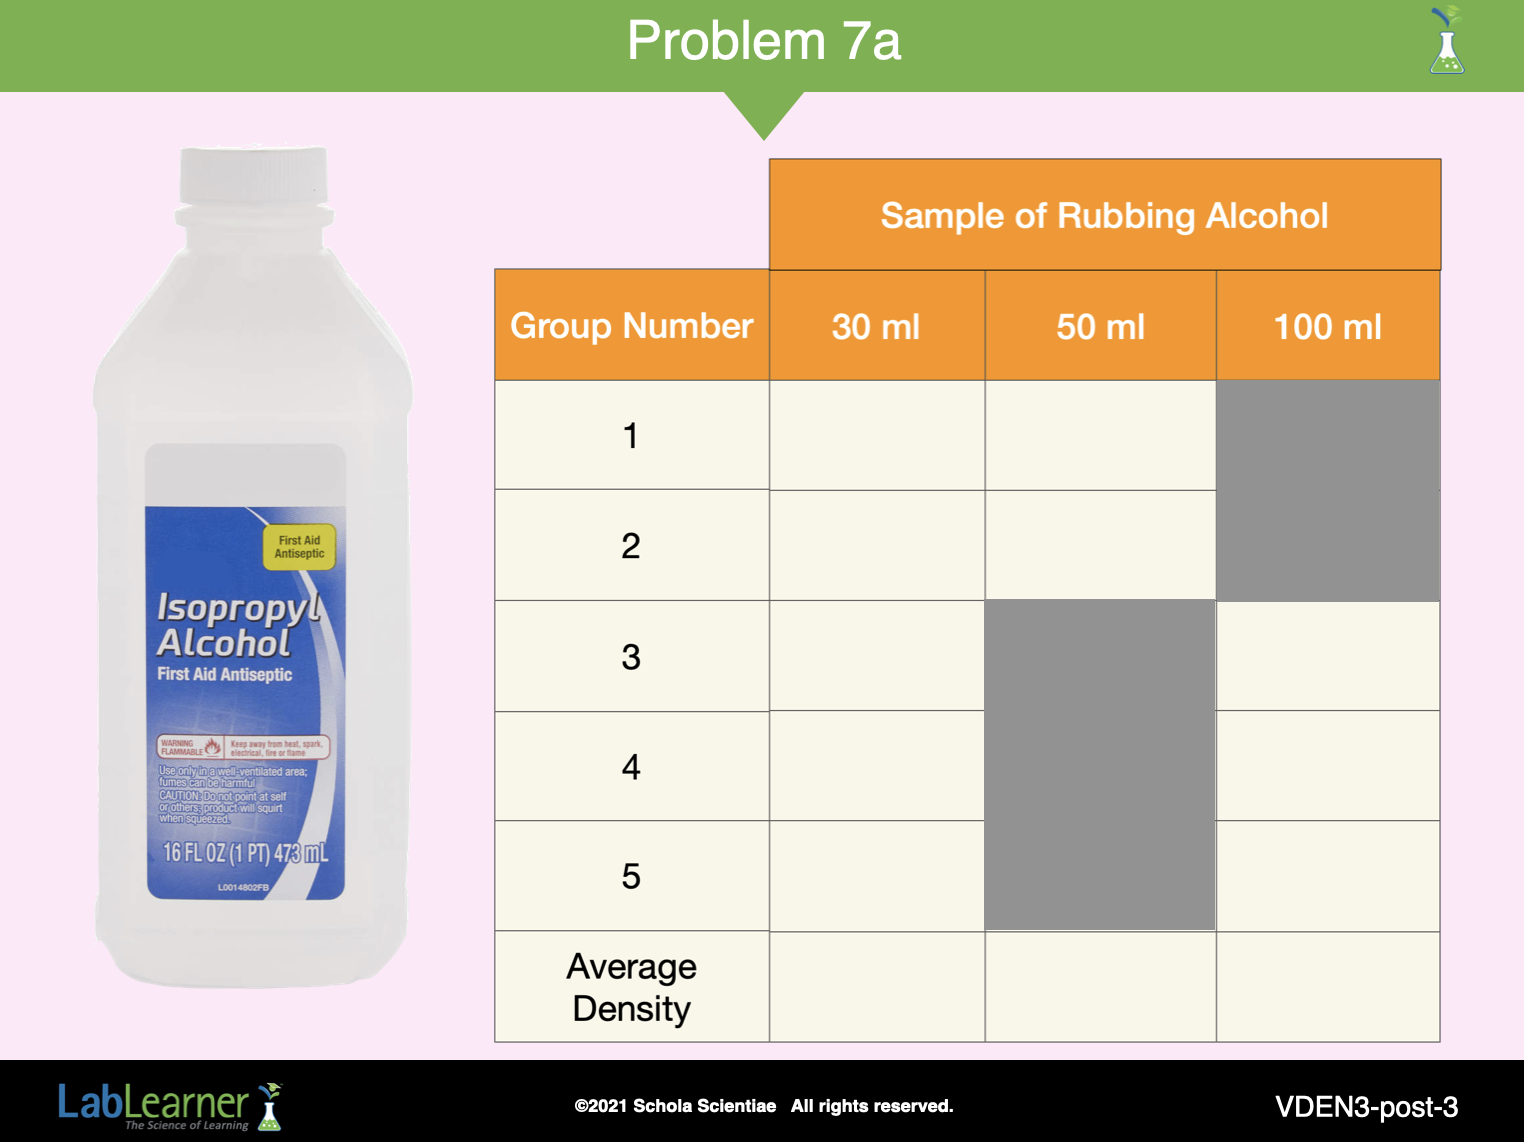
SLIDE VDEN3-post-3
B. Tell students that in order to analyze the data they collected in Trials 1 – 4, each group must share their collected data with the other four groups.
1. Divide the students into cooperative groups, each group should contain one representative from each lab group, so that the group contains at least one student who explored a 50 ml or 100 ml sample of rubbing alcohol and one student who explored a 50 ml or 100 ml sample of vegetable oil.
2. Direct students to work together to complete the data tables in Problems 7 and 8 of their Student Data Record.
3. Allow sufficient time to complete the tables.
C. Begin a discussion of the measurements and calculations made in Trials 1 – 4.
1. Ask students to refer to Problem 7 to help them answer the following questions about Trials 1 and 2 (rubbing alcohol):
a. Ask students: What was the density of 30 ml of rubbing alcohol? Students should indicate that the density of 30 ml of rubbing alcohol was approximately 0.88 g/ml.
b. Ask students: What was the density of 50 ml of rubbing alcohol? Students should indicate that the density of 50 ml of rubbing alcohol was approximately 0.88 g/ml.
c. Ask students: What was the density of 100 ml of rubbing alcohol? Students should indicate that the density of 100 ml of rubbing alcohol was approximately 0.88 g/ml.
d. Ask students: Did the density of rubbing alcohol change as the volume of the sample changed? Students should indicate that the density of rubbing alcohol remained constant.
e. Ask students: How could you show your results with a graph? Students should indicate that the average density for each volume can be calculated and then plotted vs. the volume.
______________________________________________
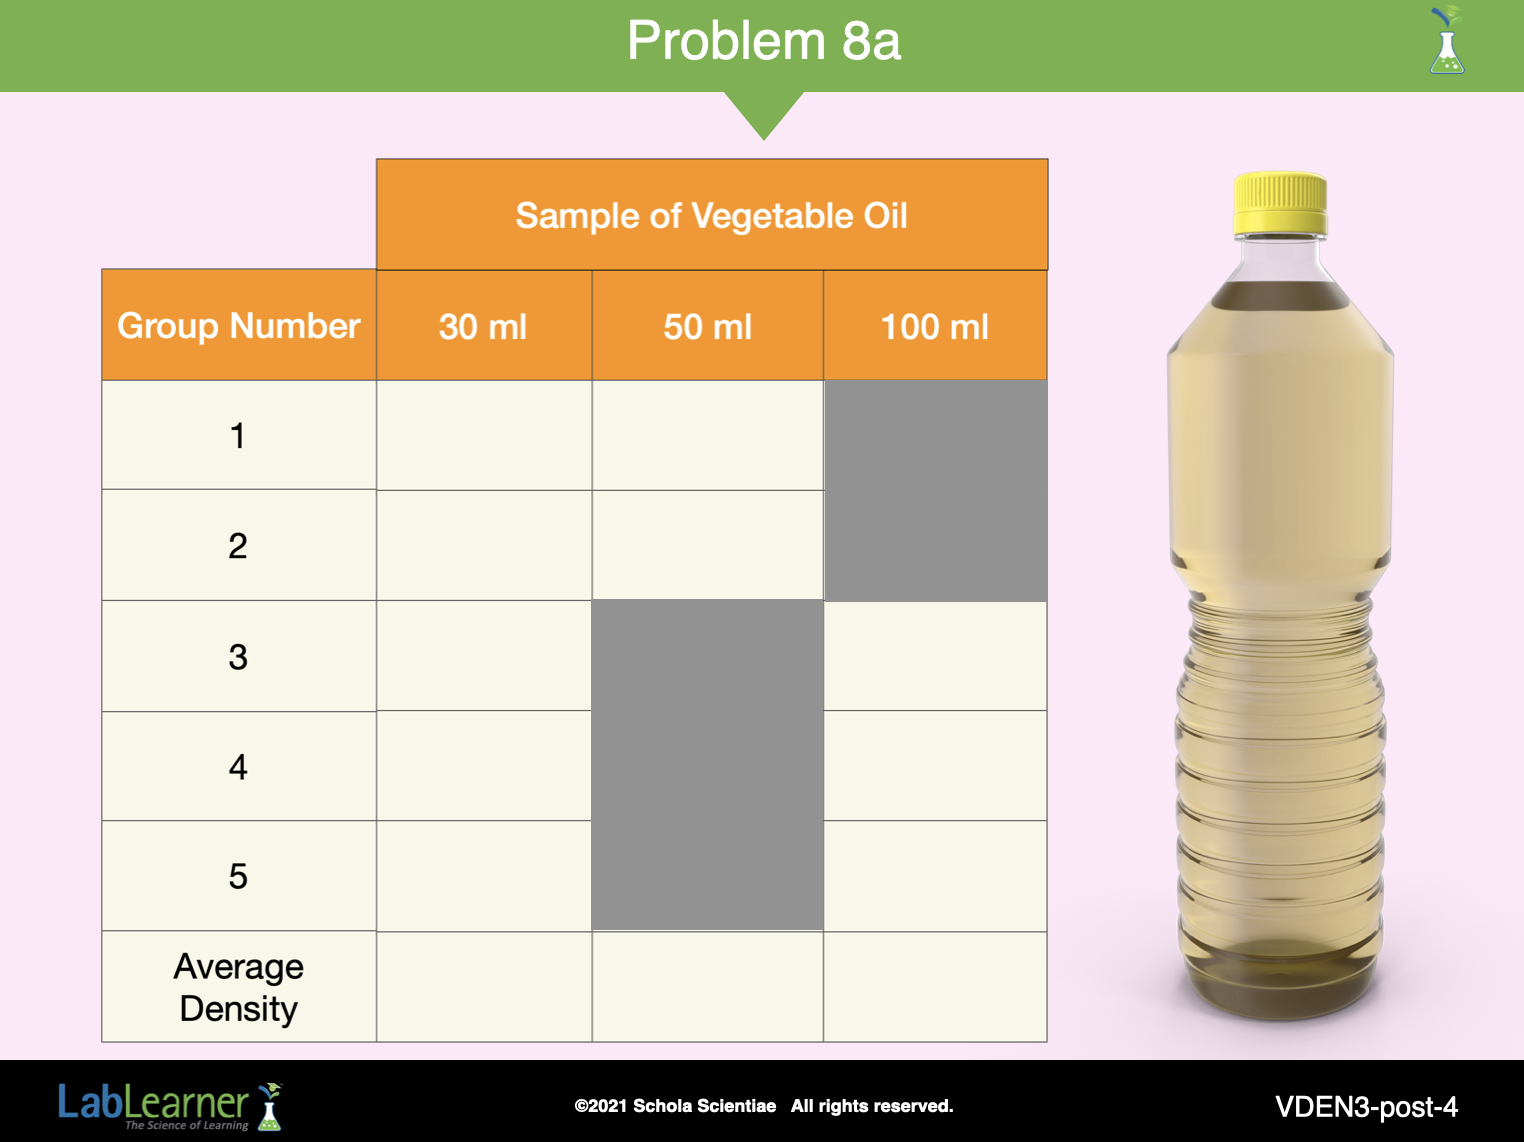
SLIDE VDEN3-post-4
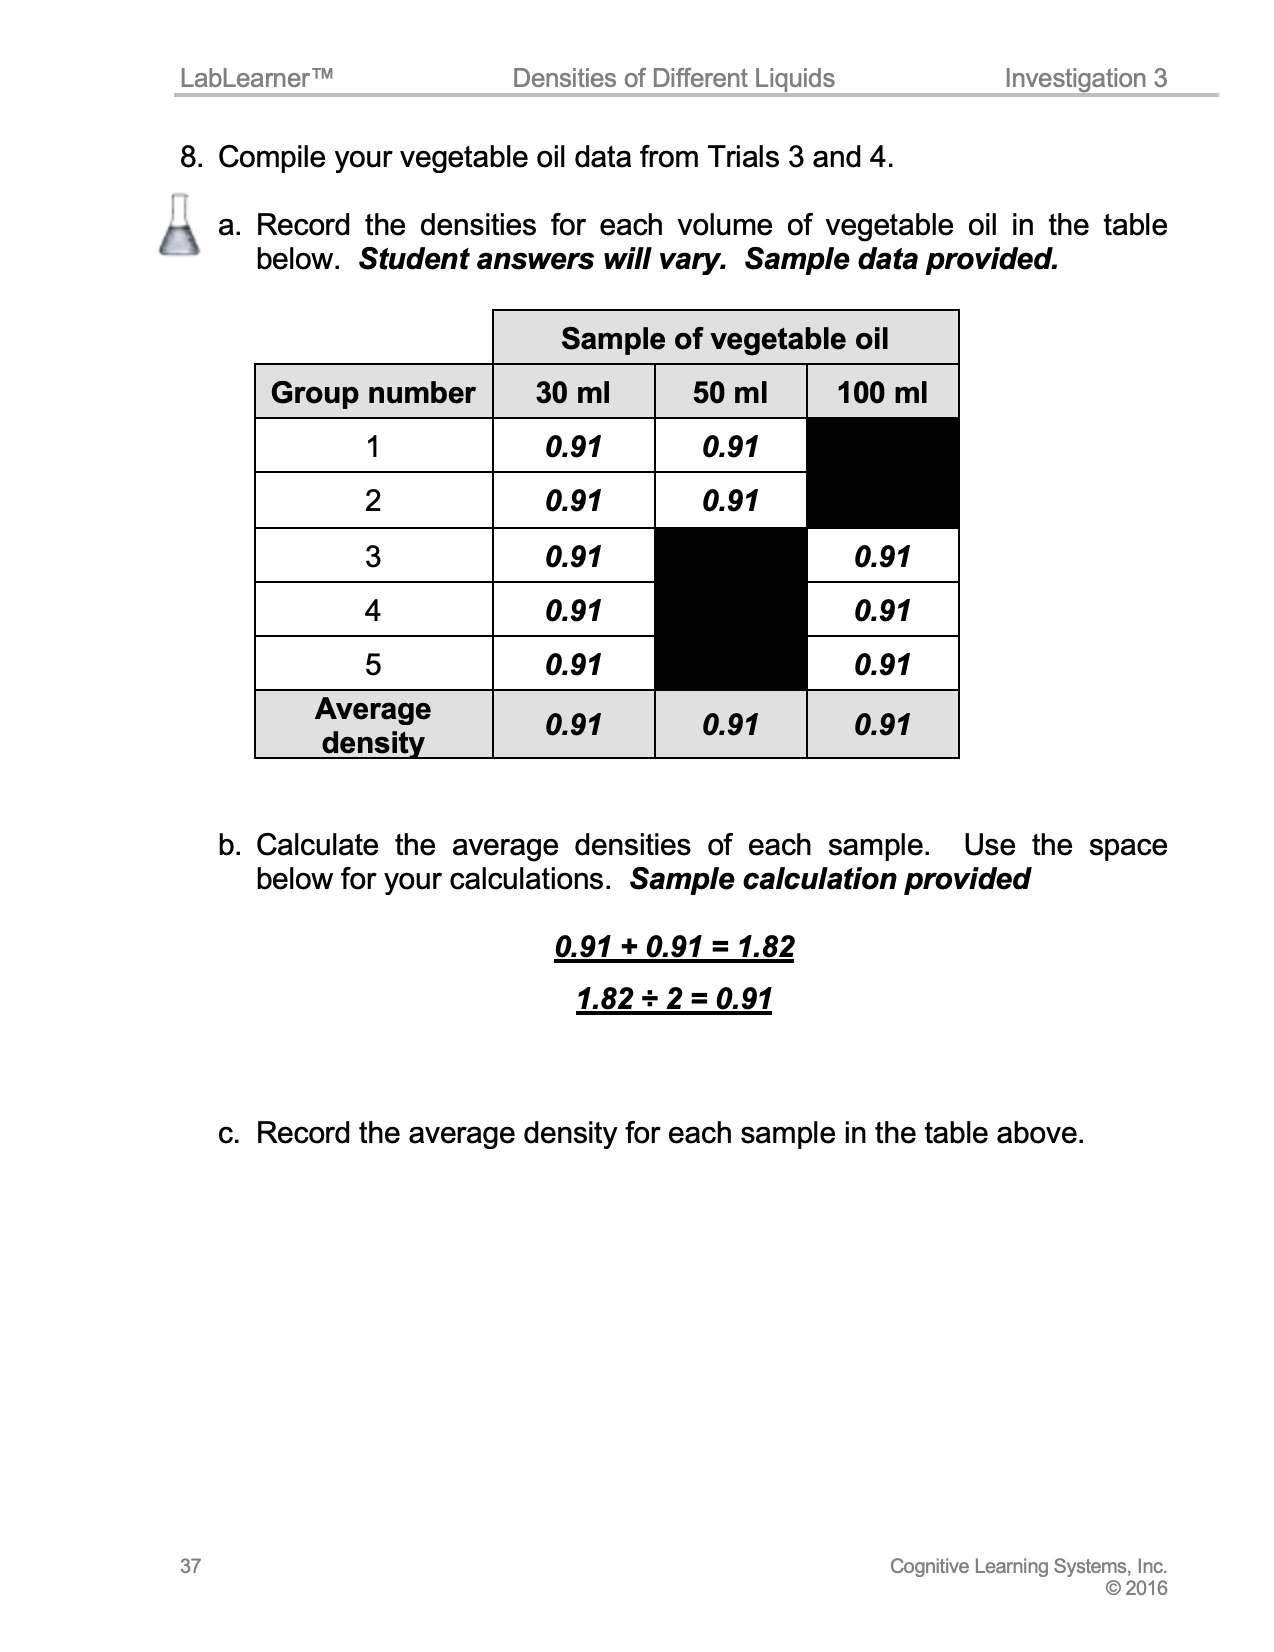
1. Ask students to refer to Problem 8 to help them answer the following questions about Trials 3 and 4 (vegetable oil):
a. Ask students: What was the density of 30 ml of vegetable oil? Students should indicate that the density of 30 ml of vegetable oil was approximately 0.91 g/ml.
b. Ask students: What was the density of 50 ml of vegetable oil? Students should indicate that the density of 50 ml of vegetable oil was approximately 0.91 g/ml.
c. Ask students: What was the density of 100 ml of vegetable oil? Students should indicate that the density of 100 ml of vegetable oil was approximately 0.91 g/ml.
d. Ask students: Did the density of vegetable oil change as the volume of the sample changed? Students should indicate that the density of vegetable oil remained constant.
e. Ask students: How could you show your results with a graph? Students should indicate that the average density for each volume can be calculated and then plotted vs. the volume.
______________________________________________
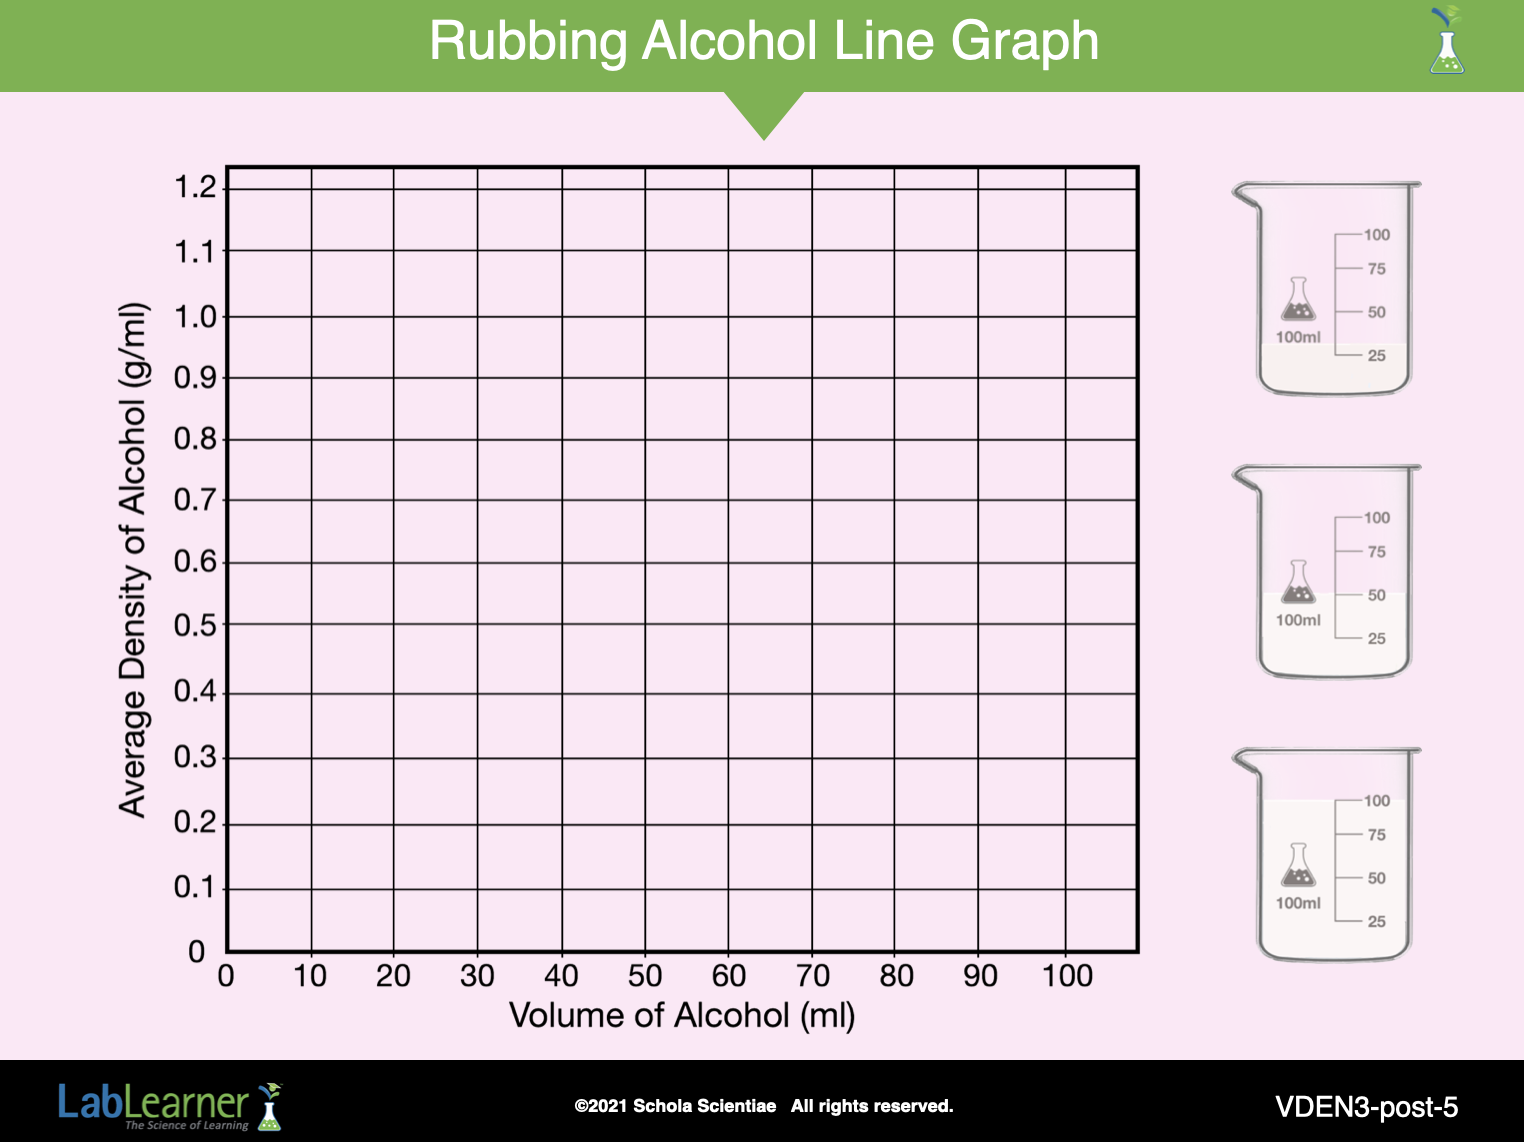
SLIDE VDEN3-post-5
D. Tell students that they will now examine the question of whether the densities of rubbing alcohol and vegetable oil are independent of the sample volume. Students will use line graphs to represent the relationship between the densities of each liquid and the sample volumes of each liquid.
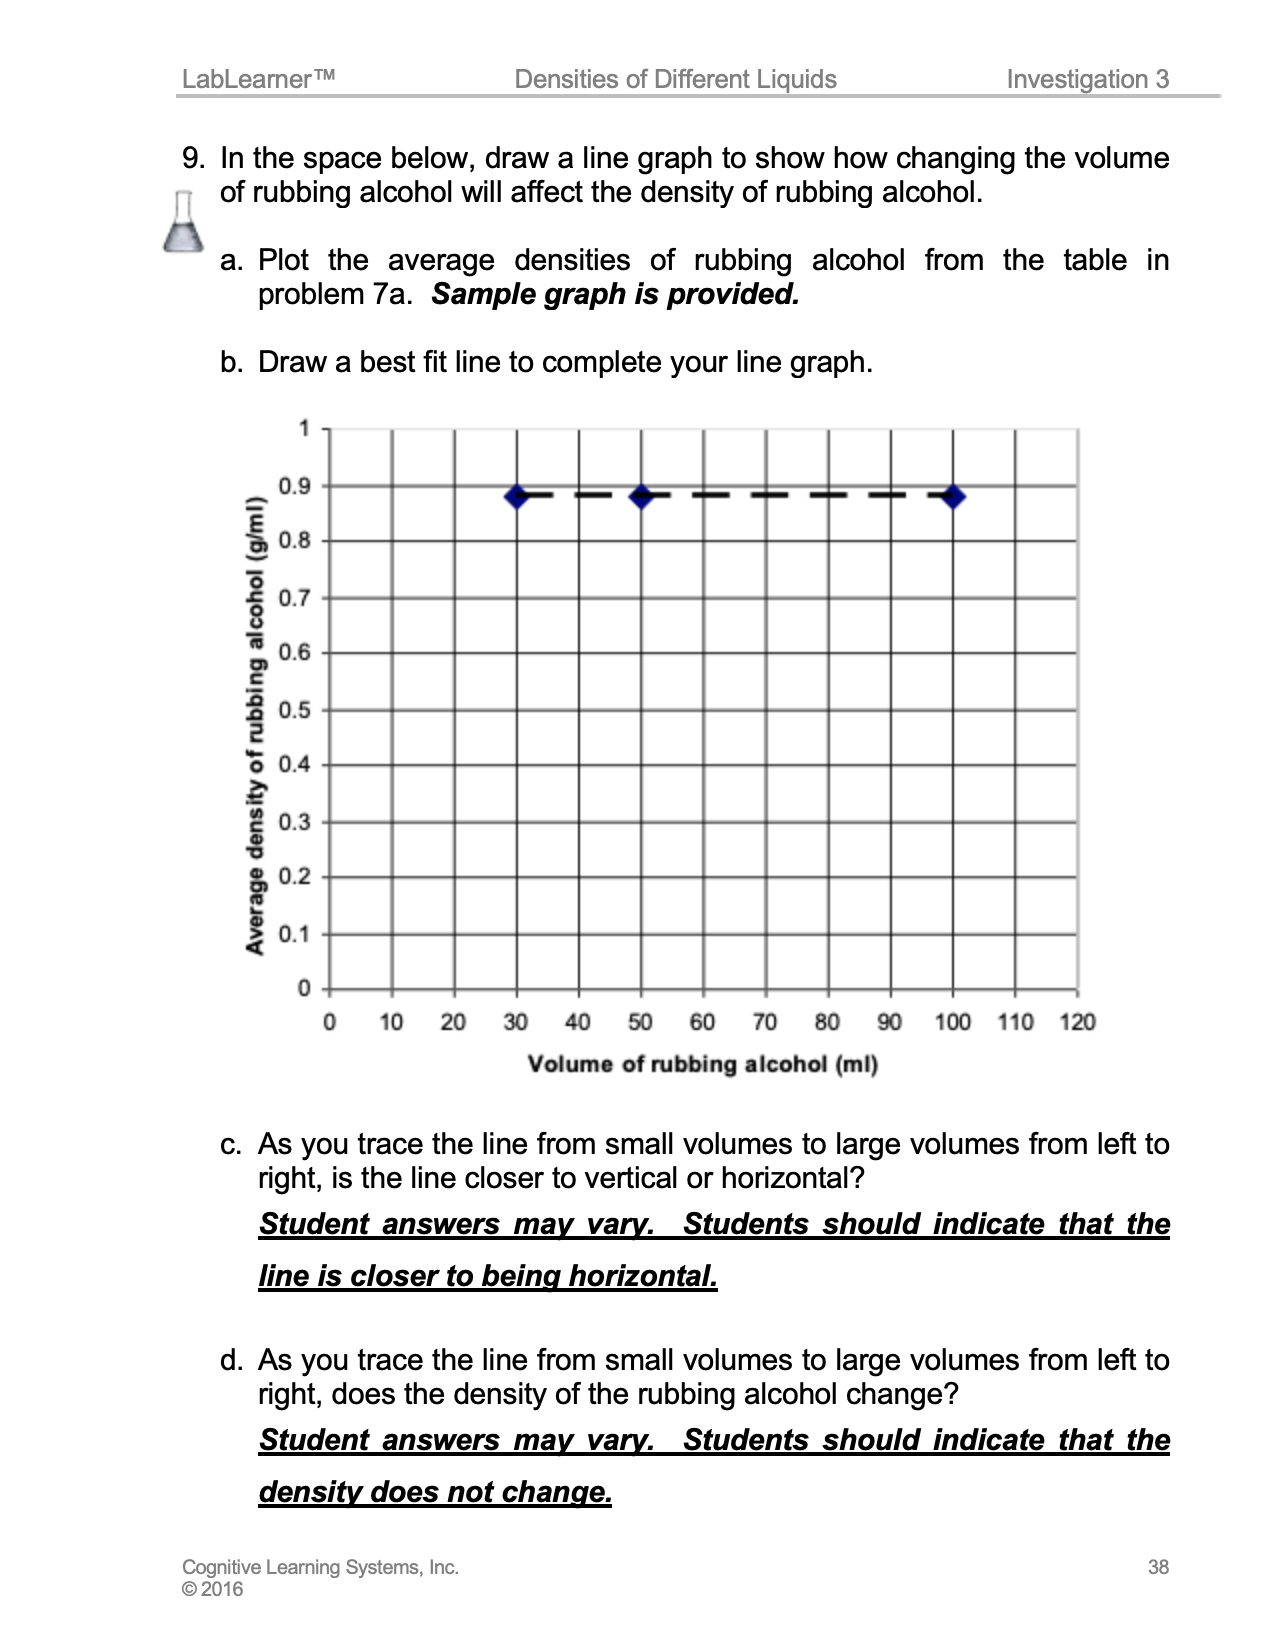
1. Instruct students to plot the rubbing alcohol data that they recorded in the data table in Problem 7a. The data should be plotted in the blank space in Problem 9a of their Scientist Data Record. If students are having difficulty, use the following steps to help them create a line graph.
a. Instruct students to plot the average density of each of the three different sample volumes of rubbing alcohol on the y-axis.
b. Instruct students to plot the three different sample volumes of rubbing alcohol on the x-axis.
c. Instruct students to complete the line graph by drawing a best fit line.
d. Tell students that a best fit line is a straight line that is drawn as close to each of the three data points as possible. The best fit line should be drawn so that the distance between each point and the line is minimized. Refer students to the Drawing a Best Fit Line Procedural Tool if necessary.
Note to Teacher: The following Line Graph is NOT available to students on the Student Portal:
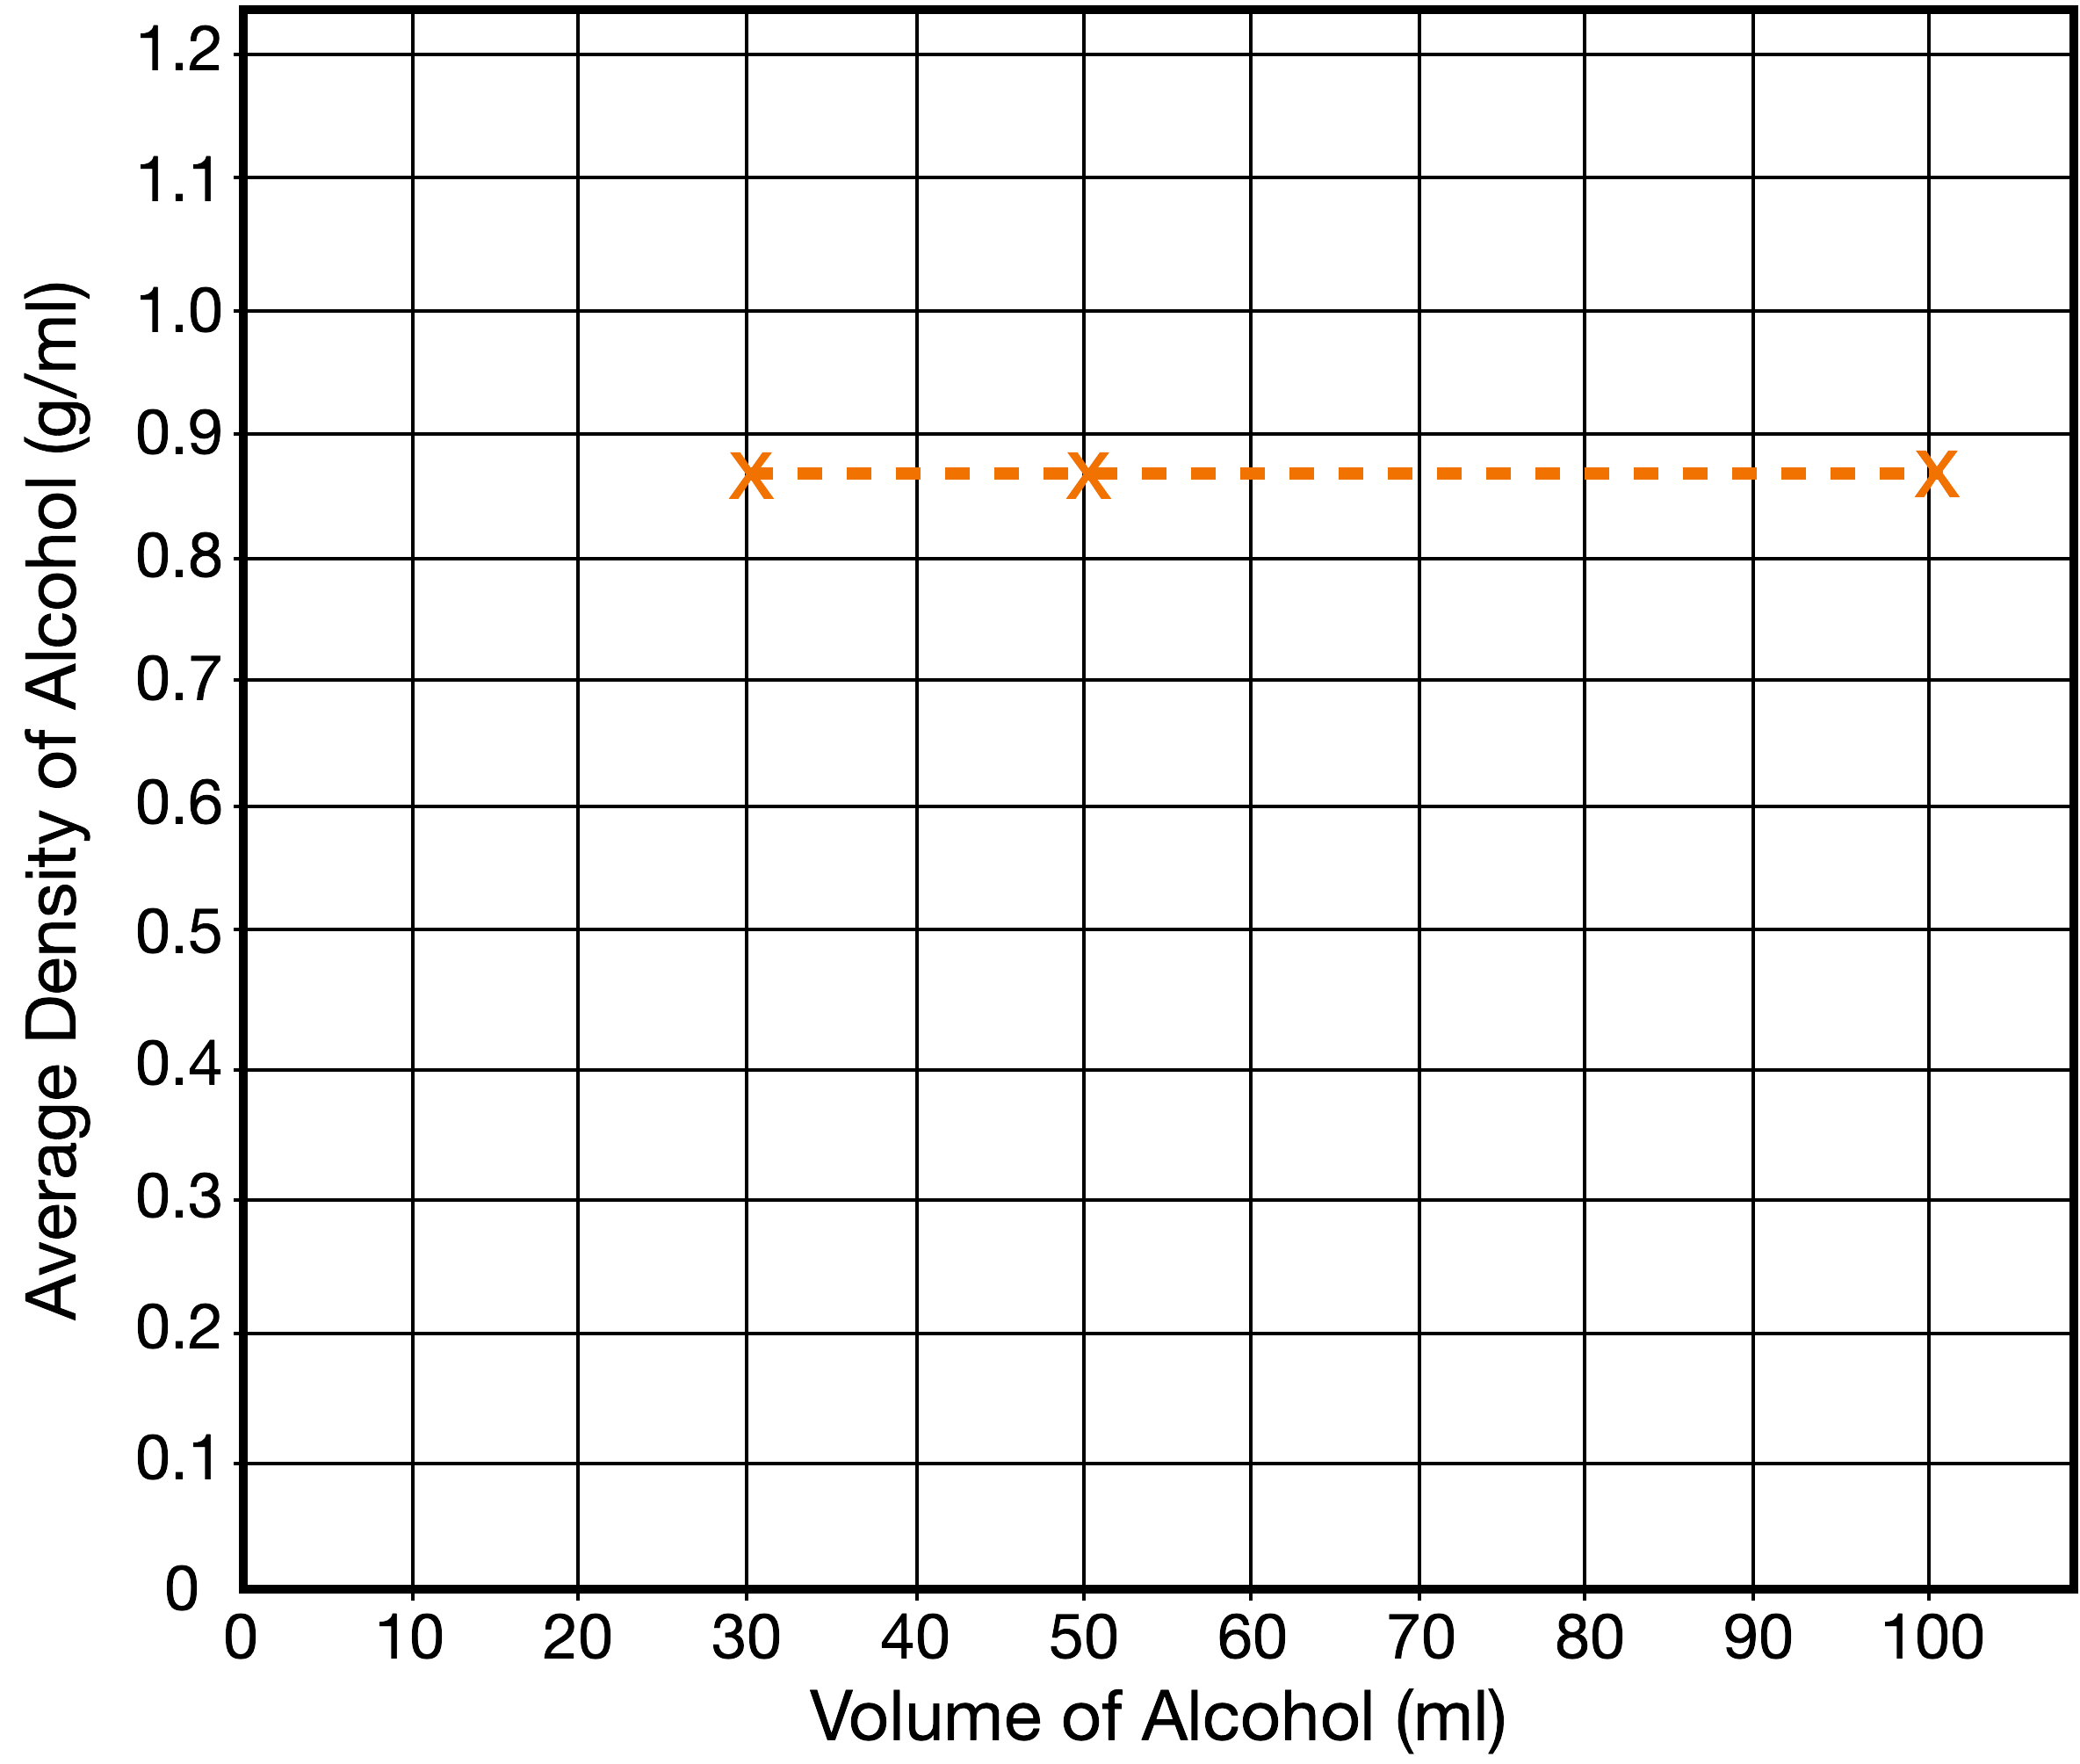
2. When the rubbing alcohol line graph is completed, ask students to analyze the line graph by recording their answers to the questions in Problems 9c – f of their Student Data Record. When the students have answered the questions, discuss their conclusions as a class.
a. Ask students: As you trace the line from small volumes to large volumes from left to right, is the line closer to vertical or horizontal? Student answers may vary. Students should indicate that the line is closer to being horizontal.
b. Ask students: As you trace the line from small volumes to large volumes from left to right, does the density of the rubbing alcohol change? Student answers may vary. Students should indicate that the density does not change.
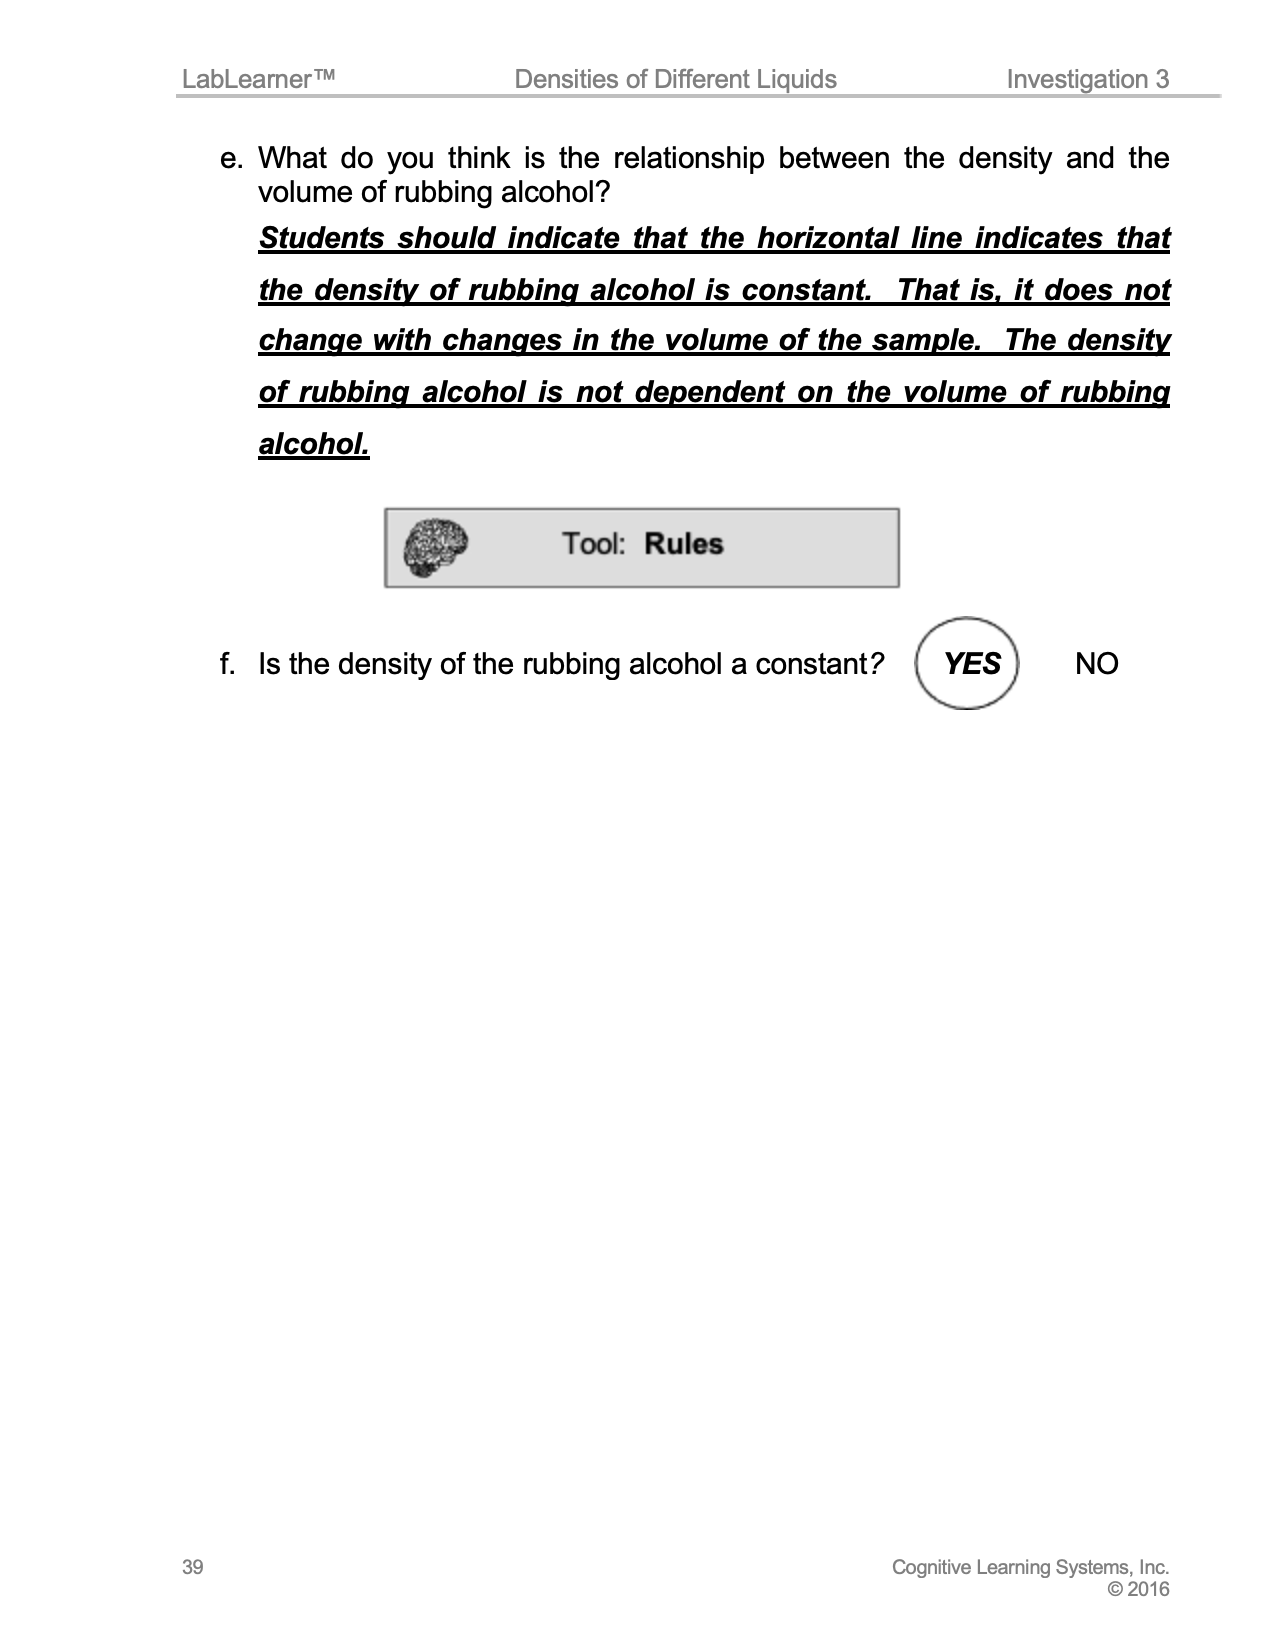
c. Ask students: What do you think is the relationship between the density and the volume of rubbing alcohol? Students should indicate that the horizontal line indicates that the density of rubbing alcohol is a constant. That is, it does not change with changes in the volume of the sample. The density of rubbing alcohol is not dependent on the volume of rubbing alcohol.
______________________________________________
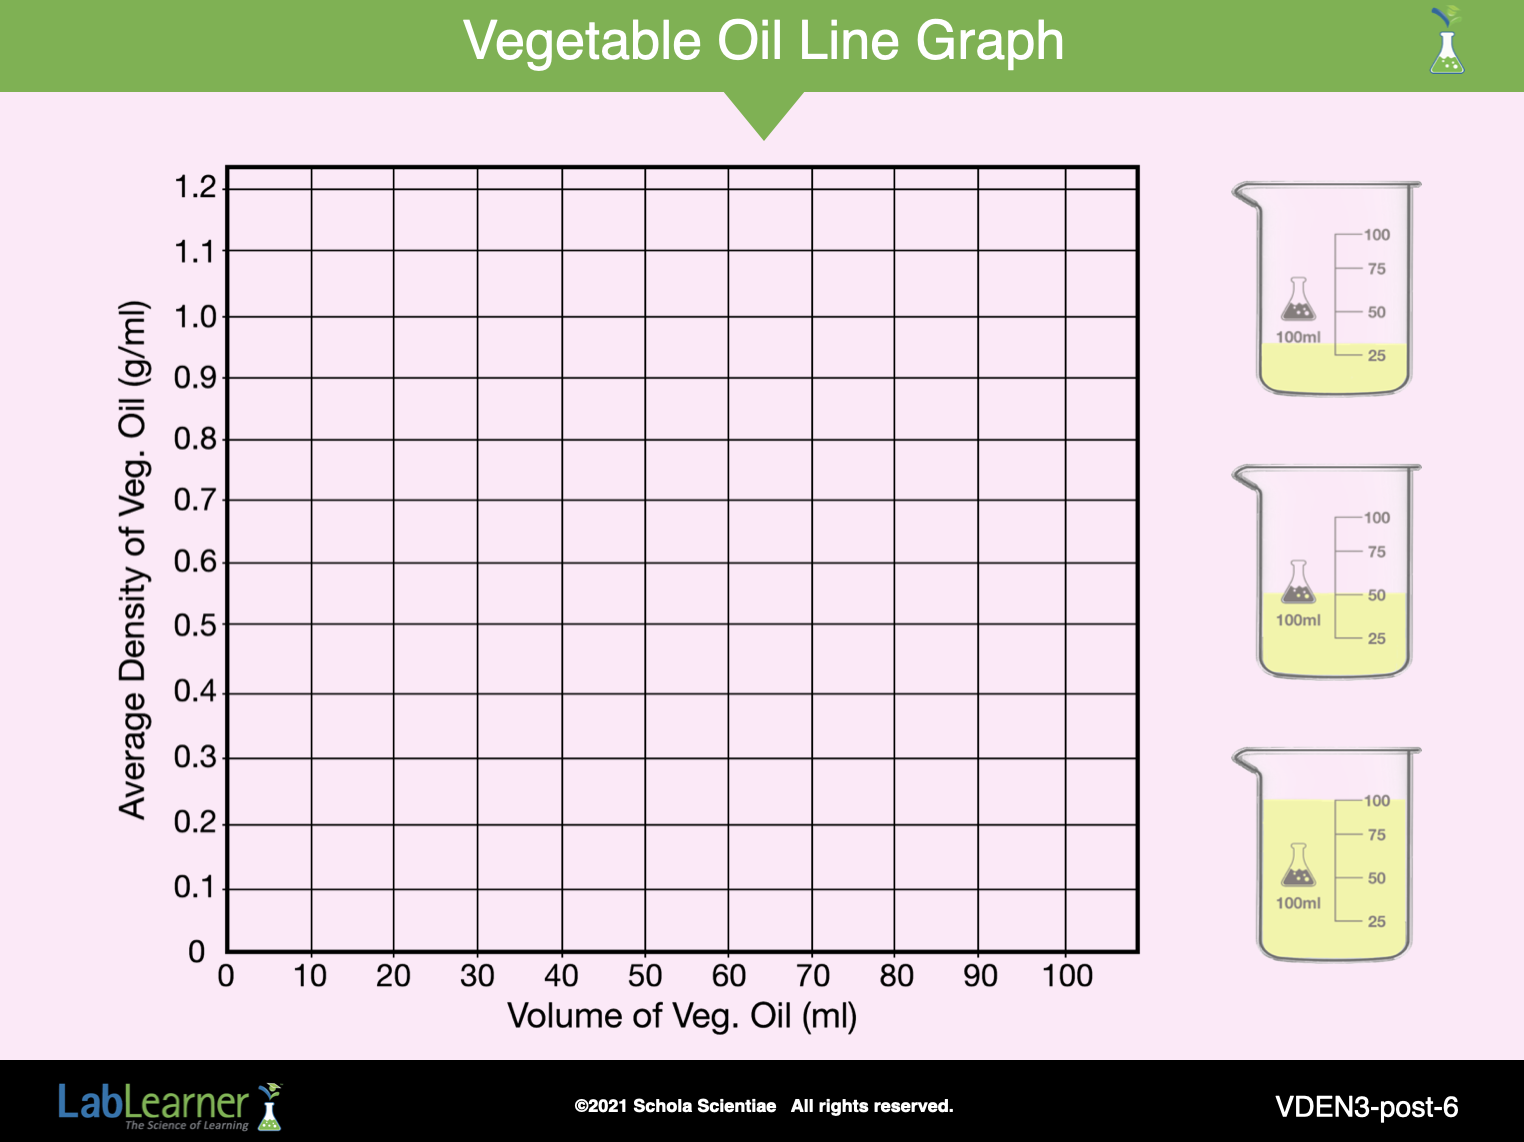
SLIDE VDEN3-post-6
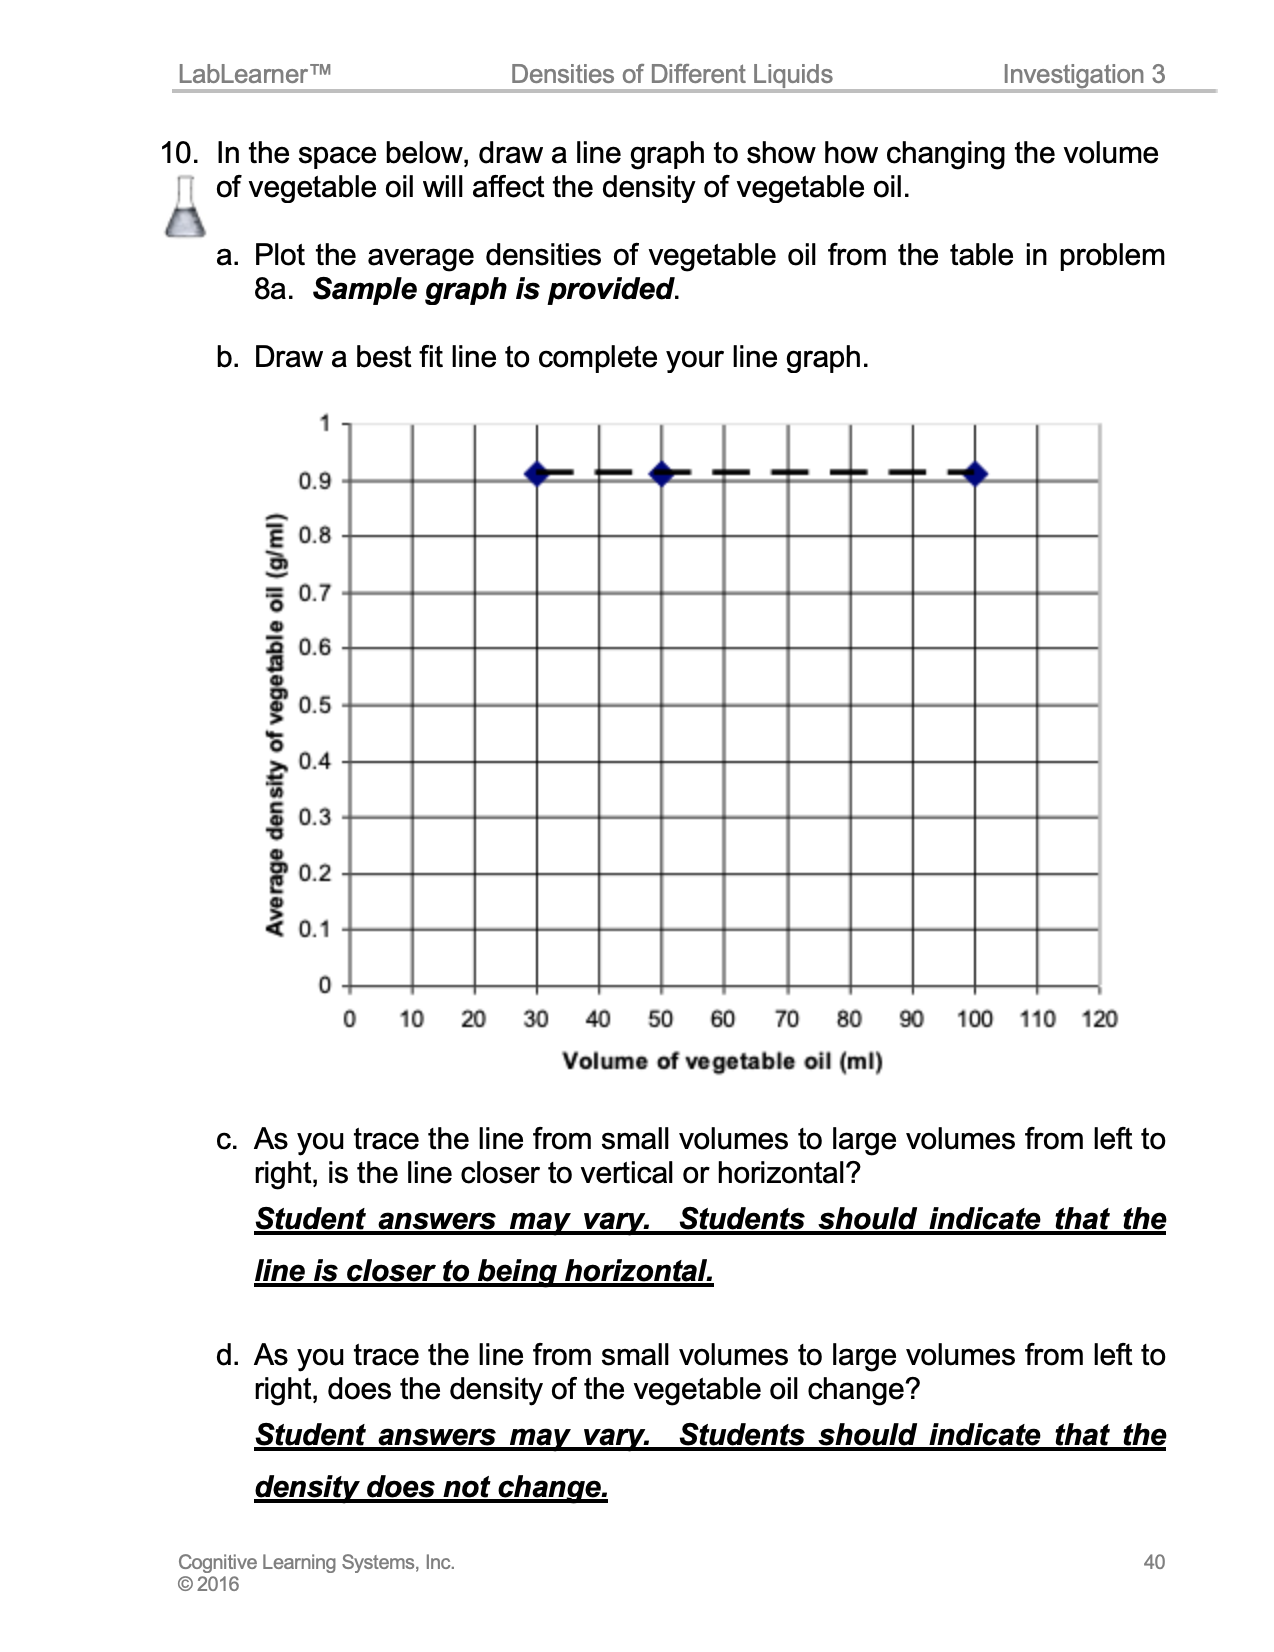
3. Instruct students to plot the vegetable oil data that they recorded in the data table in Problem 8a. The data should be plotted in the blank space in Problem 10a of their Scientist Data Record. If students are having difficultly, use the steps on the previous slide to help them create a line graph.
Note to Teacher: The following Line Graph is NOT available to students on the Student Portal:
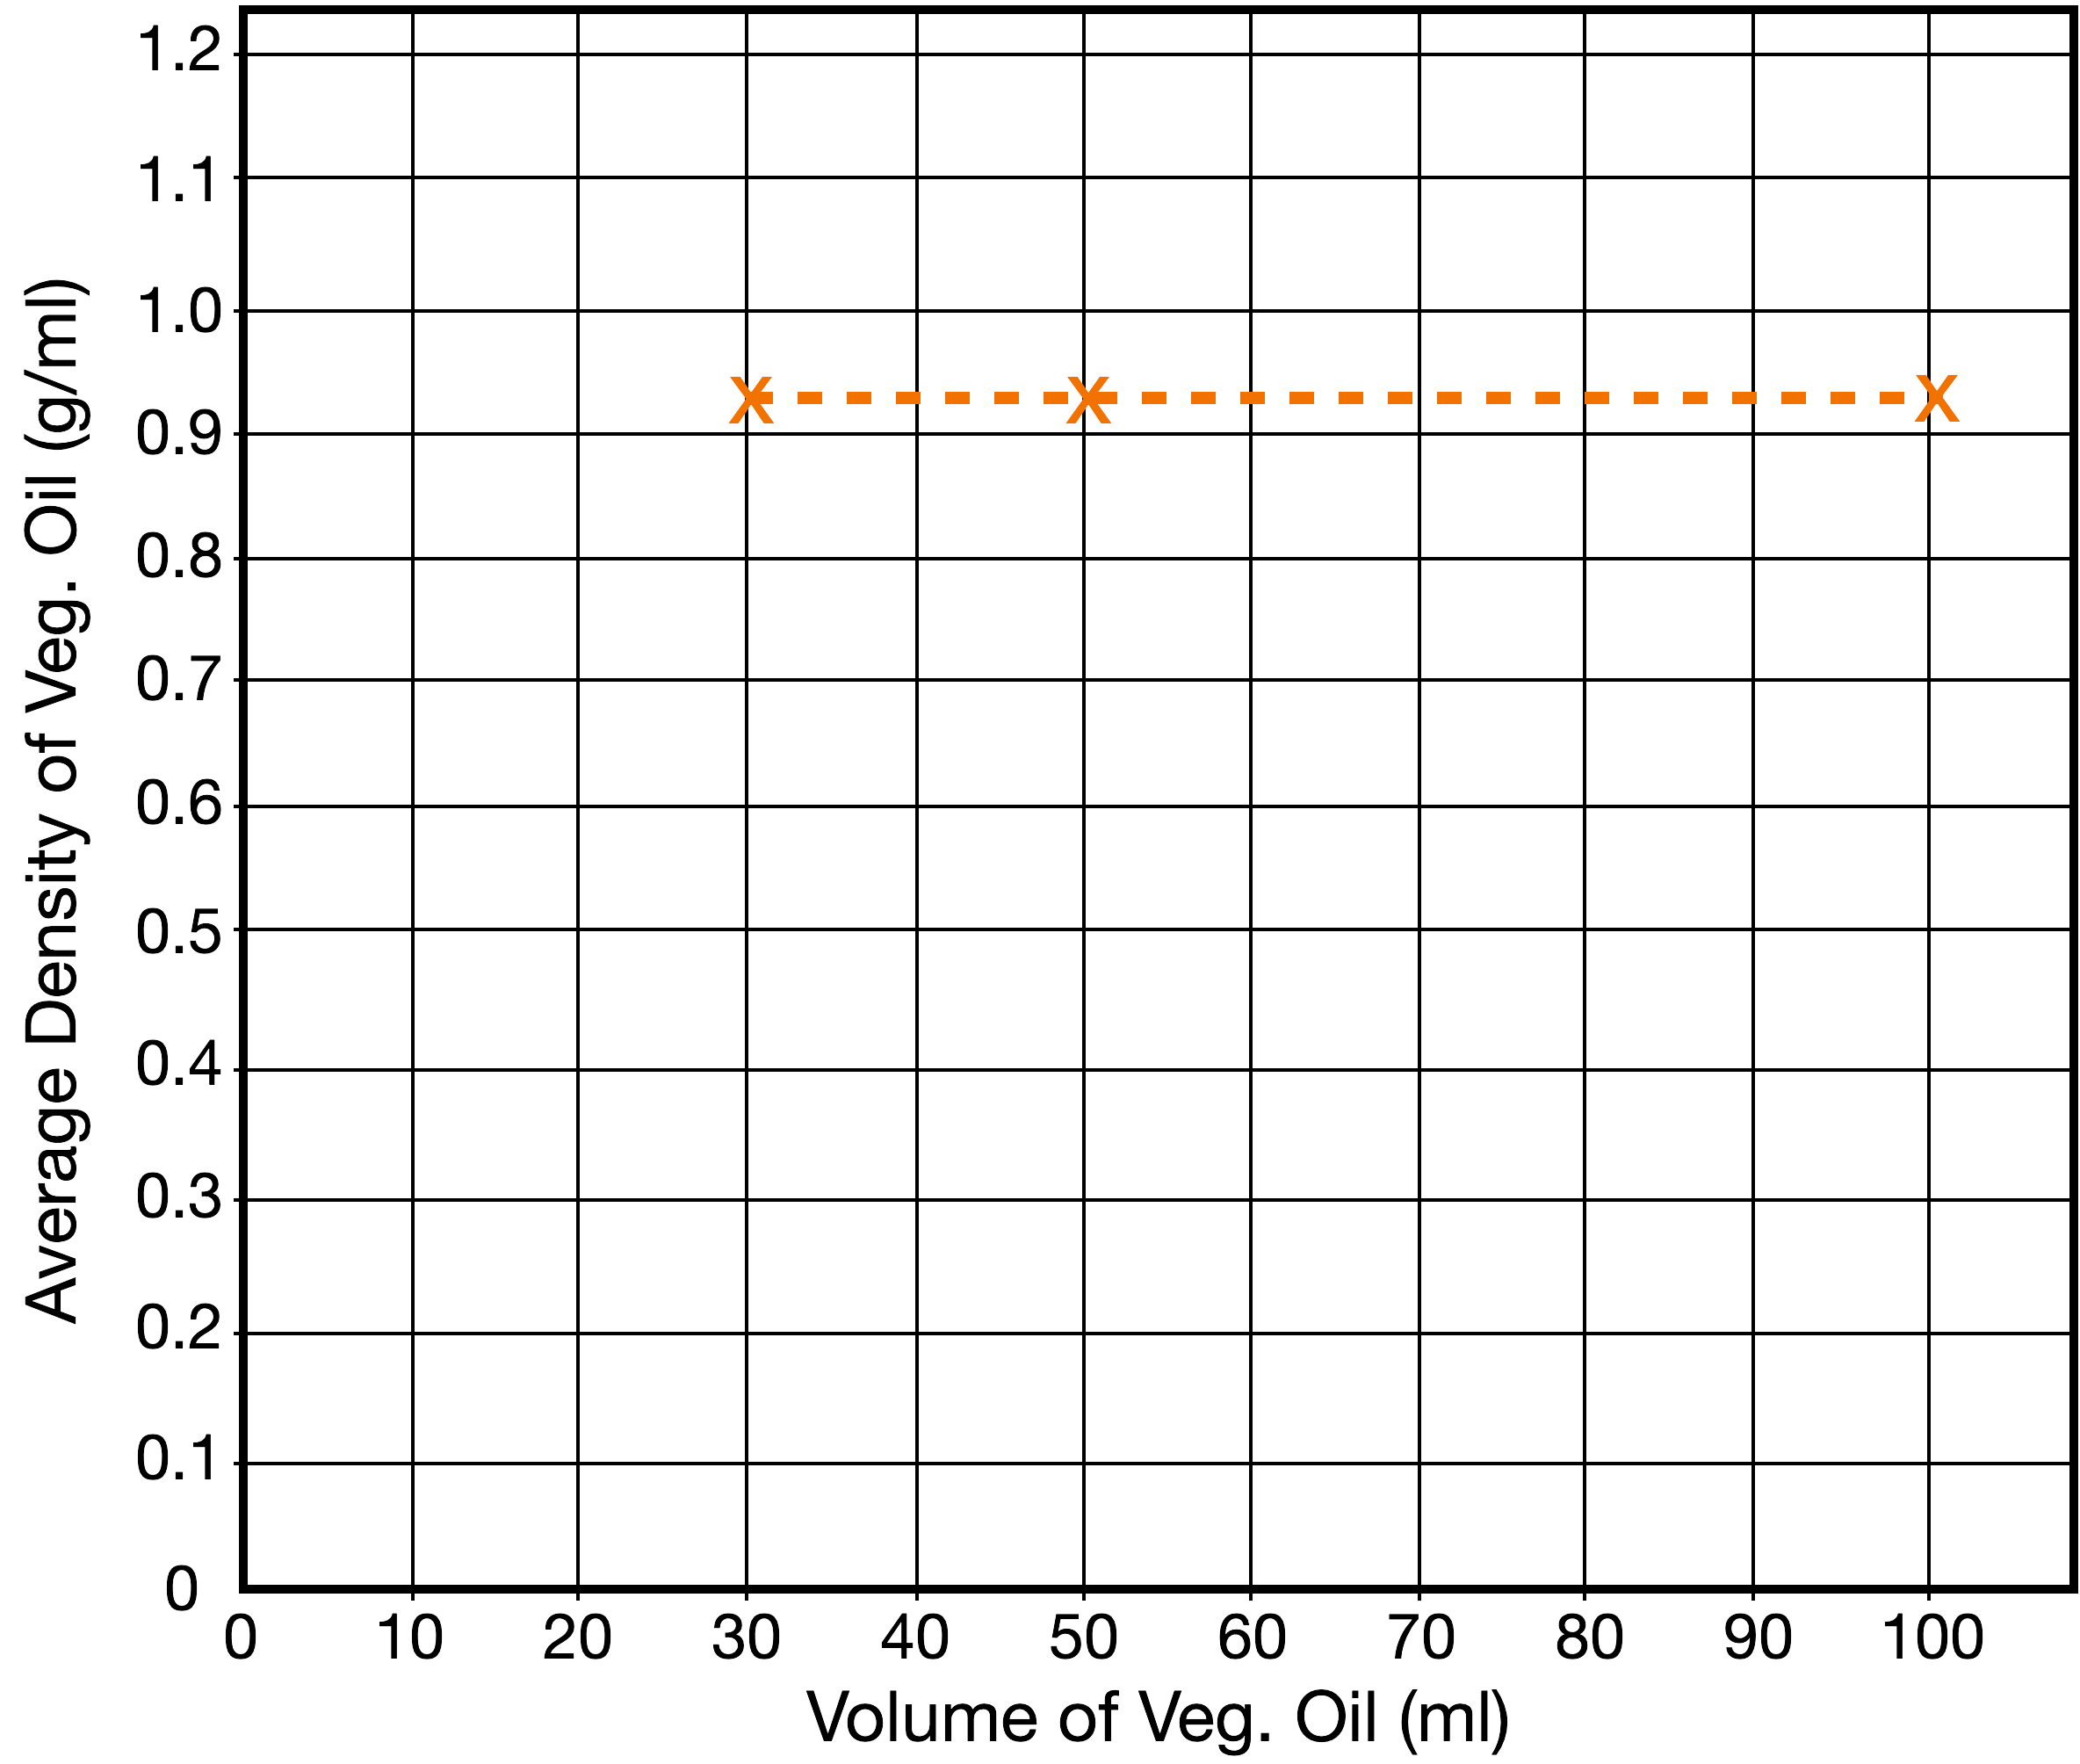
2. When the vegetable oil line graph is completed, ask students to analyze the line graph by recording their answers to the questions in Problems 10c – f of their Student Data Record. When the students have answered the questions, discuss their conclusions as a class.
a. Ask students: As you trace the line from small volumes to large volumes from left to right, is the line closer to vertical or horizontal? Student answers may vary. Students should indicate that the line is closer to being horizontal.
b. Ask students: As you trace the line from small volumes to large volumes from left to right, does the density of the vegetable oil change? Student answers may vary. Students should indicate that the density does not change.
c. Ask students: What do you think is the relationship between the density and the volume of vegetable oil? Students should indicate that the horizontal line indicates that the density of vegetable oil is a constant. That is, it does not change with changes in the volume of the sample. The density of vegetable oil is not dependent on the volume of vegetable oil.
______________________________________________
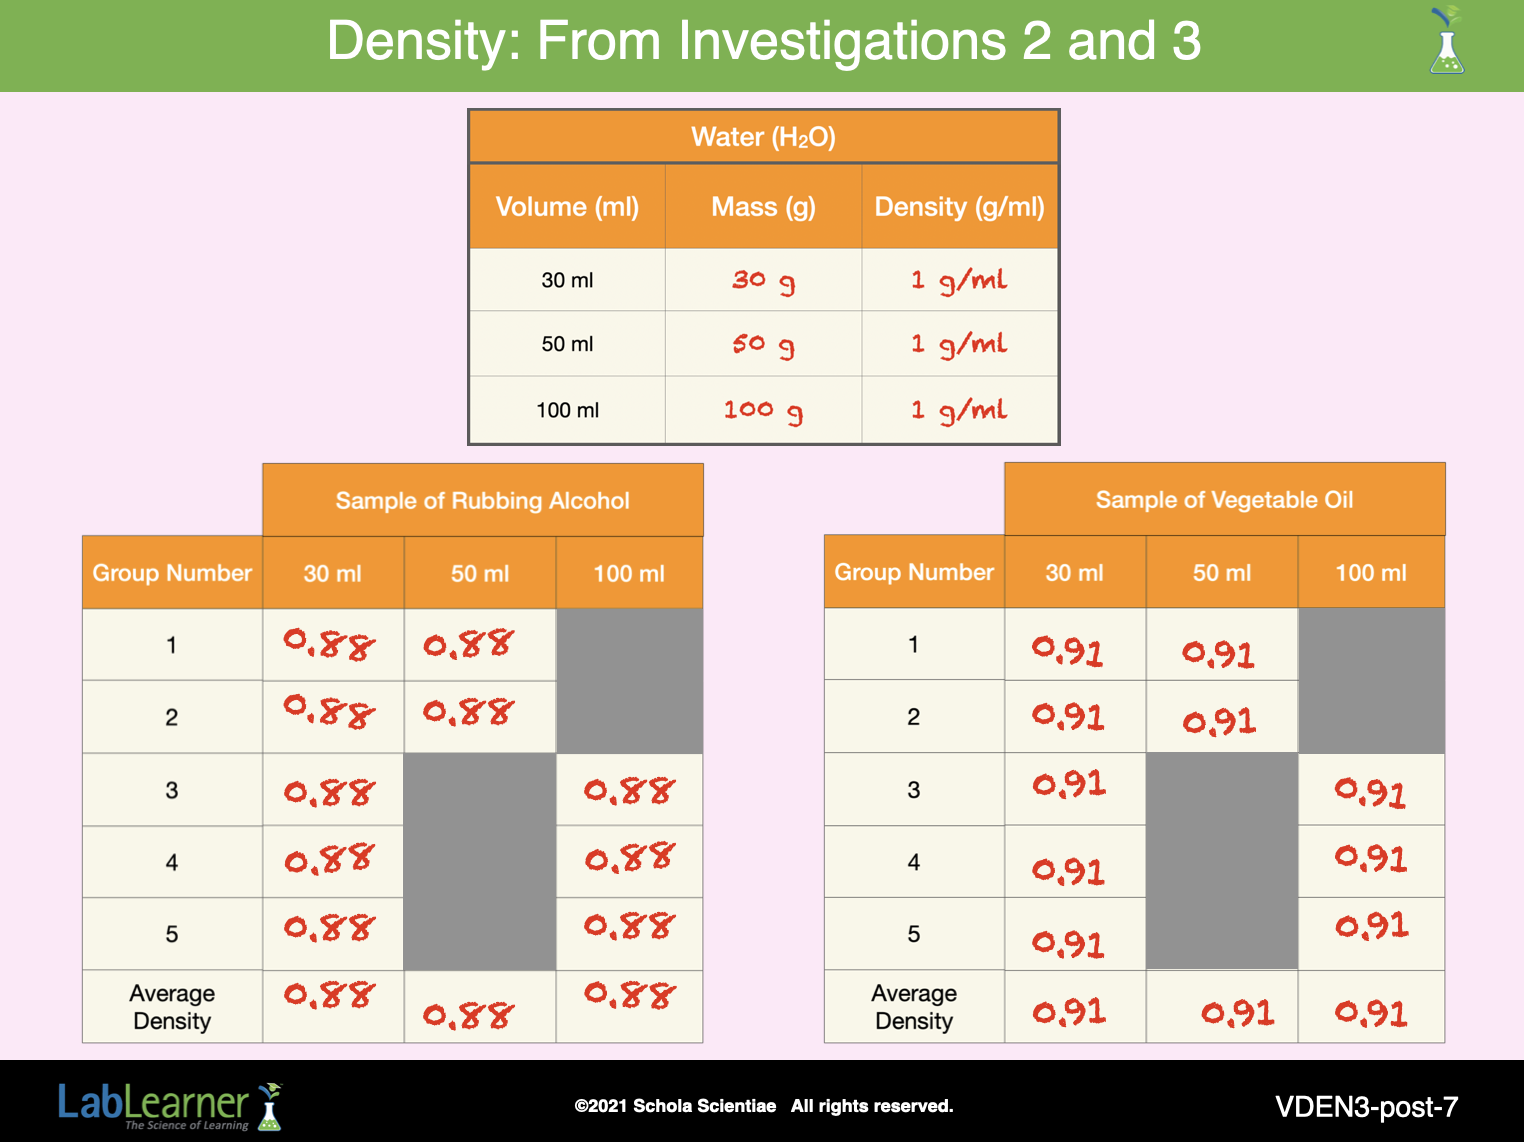
SLIDE VDEN3-post-7
E. As a class, discuss the concept that the density of each type of matter is a constant and does not change.
1. Ask students to refer to the average density of water data table in Problem 1a of their Student Data Record.
a. Ask students: Look at the data table in Problem 1a. Does the density of water change when the sample size changes? Students should indicate that the density of water does not change when the sample size changes.
b. Ask students: Is the density of water a constant? Students should indicate that the density of water is a constant. The density of water is 1.0 g/ml regardless of the sample size.
2. Ask students to refer to the average density of rubbing alcohol data table in Problem 7a of their Student Data Record.
a. Ask students: Look at the Data Table in Problem 7a. Does the density of rubbing alcohol change when the sample size changes? Students should indicate that the density of rubbing alcohol does not change when the sample size changes.
b. Ask students: Is the density of rubbing alcohol a constant? Students should indicate that the density of rubbing alcohol is a constant. The density of rubbing alcohol is 0.88 g/ml regardless of sample size.
3. Ask students to refer to the average density of vegetable oil data table in Problem 8a of their Student Data Record.
a. Ask students: Look at the data table in Problem 8a. Does the density of vegetable oil change when the sample size changes? Students should indicate that the density of vegetable oil does not change when the sample size changes.
b. Ask students: Is the density of vegetable oil a constant? Students should indicate that the density of vegetable oil is a constant. The density of vegetable oil is 0.91 g/ml regardless of sample size.
4. Ask students to recall that the density of the same type of matter is a property of that particular type of matter that does not change. The density is an unchanging constant even if the volume or the mass of the sample is changed.
______________________________________________
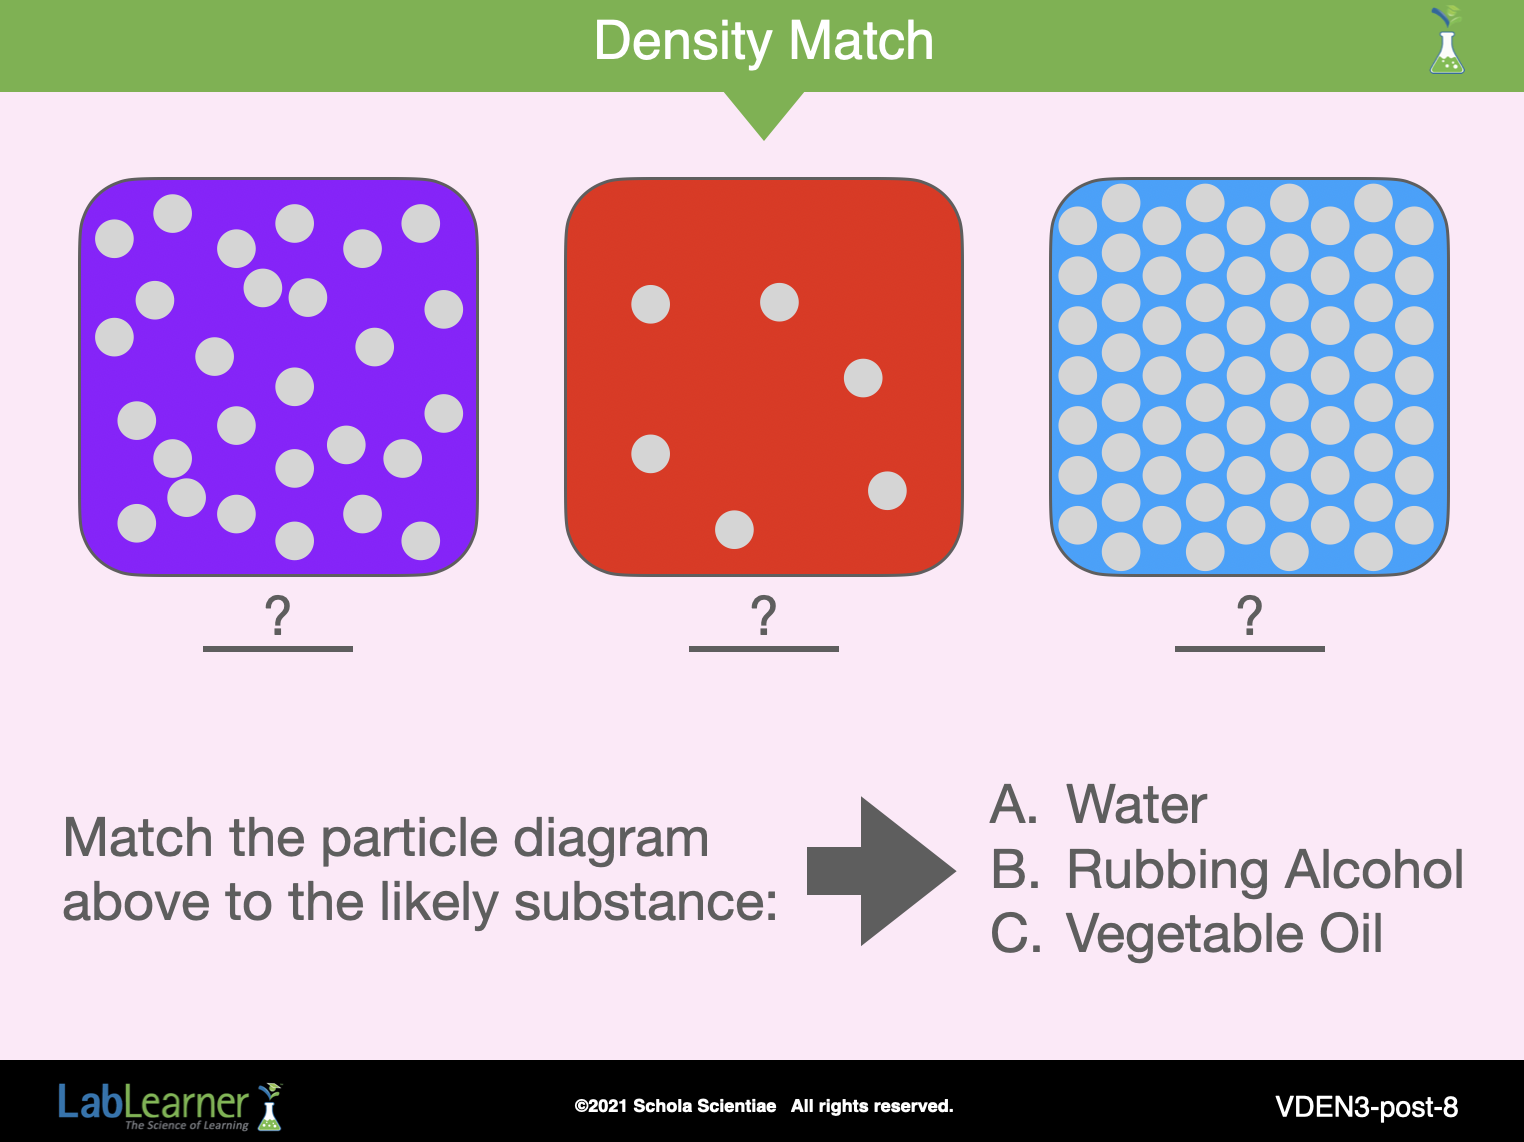
SLIDE VDEN3-post-8
F. Start a discussion about how the first three Investigations support the conclusion that while the density is a constant, the densities of different types of matter are different.
1. Ask students: Are the densities of water, rubbing alcohol, and vegetable oil the same? The densities of the three liquids are different. Water has a density of 1.00 g/ml, rubbing alcohol has a density of 0.88 g/ml, and vegetable oil has a density of 0.91 g/ml.
2. Encourage students to recall that density is a property that is different for each type of matter.
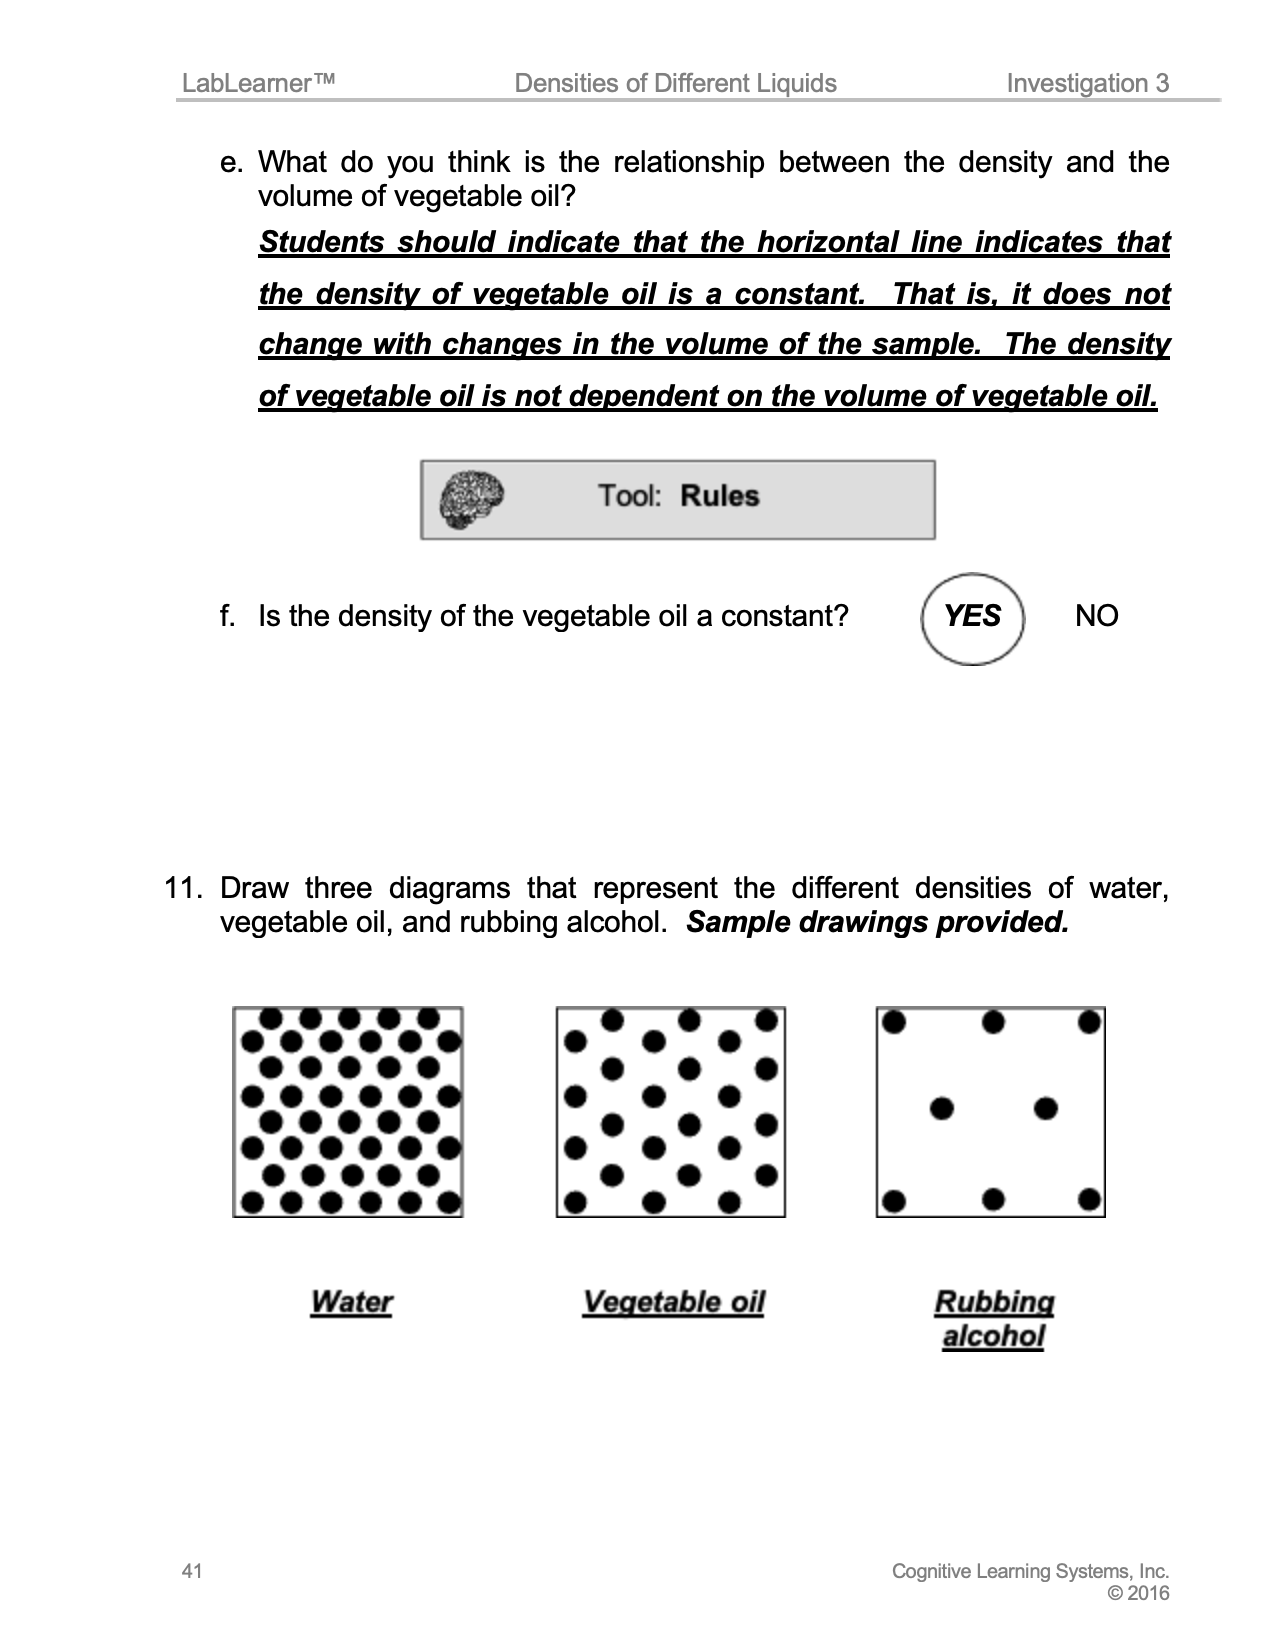
3. Divide the students into pairs. Instruct students to discuss how they can visually represent the differences in the densities of the three liquids using particle diagrams. Students should draw their particle diagrams of the densities of the three liquids in Problem 11 of their Student Data Record.
4. Ask several student pairs to share their ideas with the class. Ask student volunteers to draw their diagrams on the board.
______________________________________________
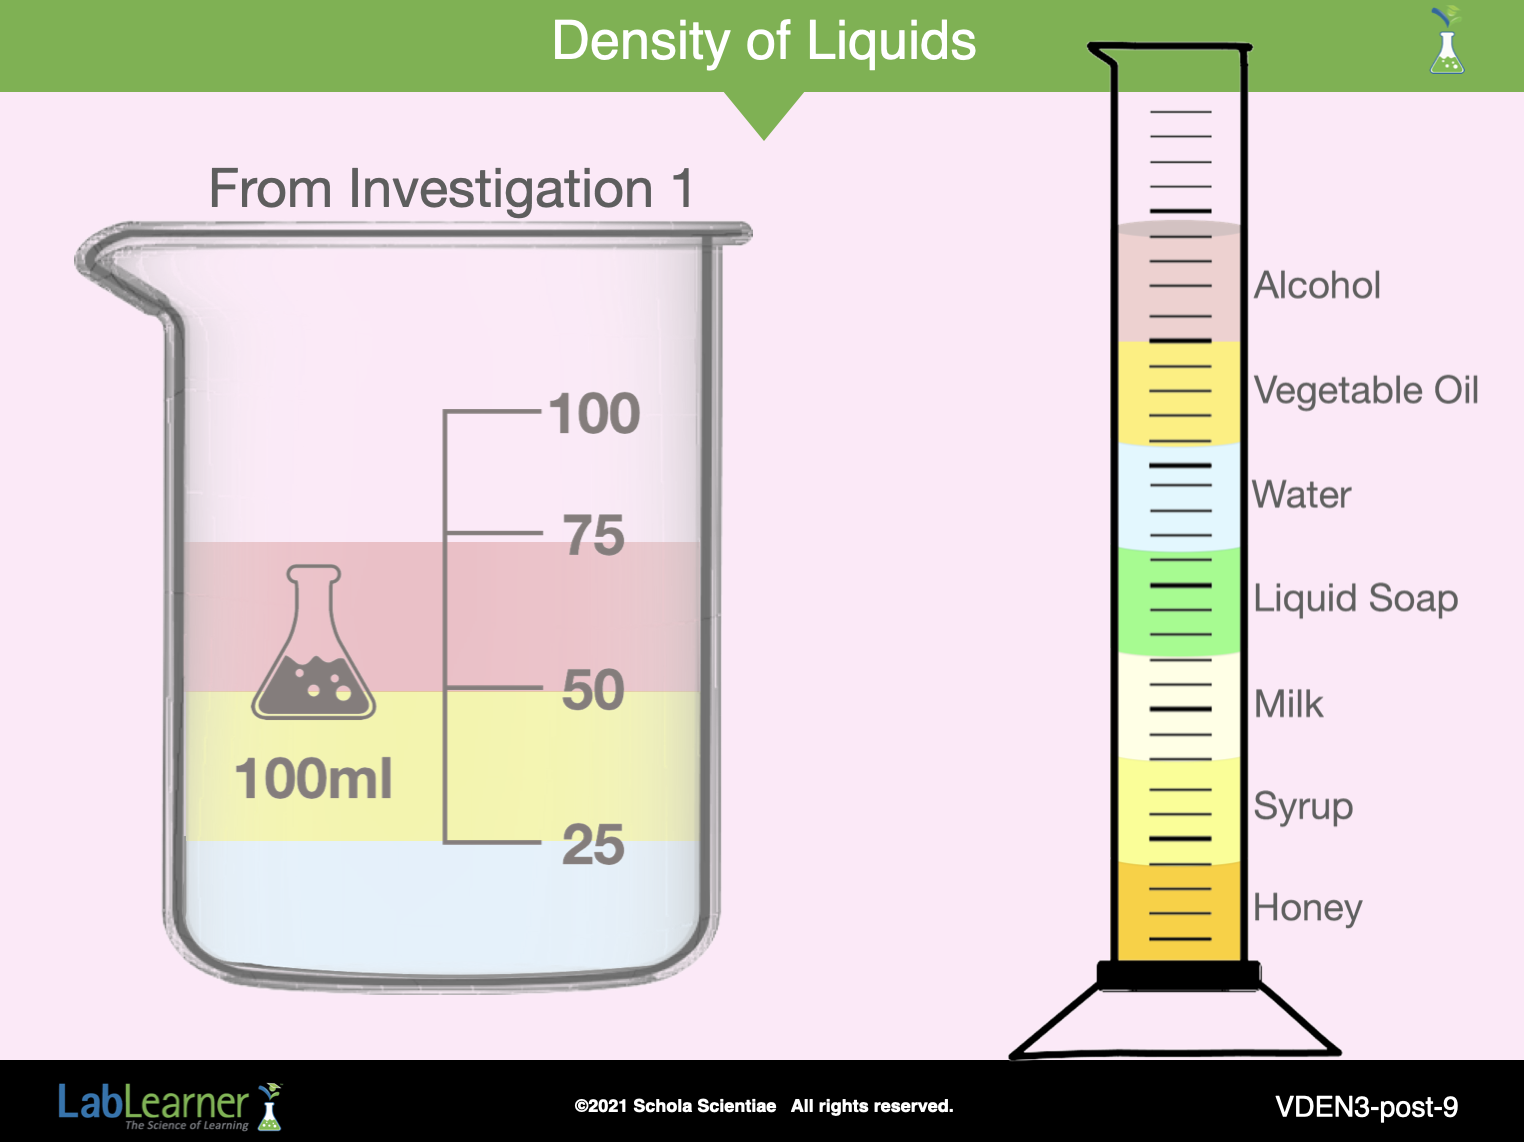
SLIDE VDEN3-post-9
5. Point out the beaker that contained the 3 layers of liquids from Investigation One on the slide.
6. Ask students: Do you recall the order of the three liquids (vegetable oil, water, and rubbing alcohol) in the beaker? Students may or may not indicate that water was at the bottom, vegetable oil was in the middle, and rubbing alcohol was at the top.
7. Ask students: How can you use the calculated densities you obtained in this Investigation to explain the order of the three liquids in the beaker? Student answers may vary. Water, with a density of 1.0 g/ml, will be found at the bottom; vegetable oil, with a density of 0.91 g/ml, will be found and the next layer; and rubbing alcohol, with a density of 0.88 g/ml, will be found as the top layer.
8. Finally, the graduated cylinder model shown on the right of this slide shows that various other liquids also have different densities and can produce impressive layering according to their density.
______________________________________________
SLIDE VDEN3-post-10
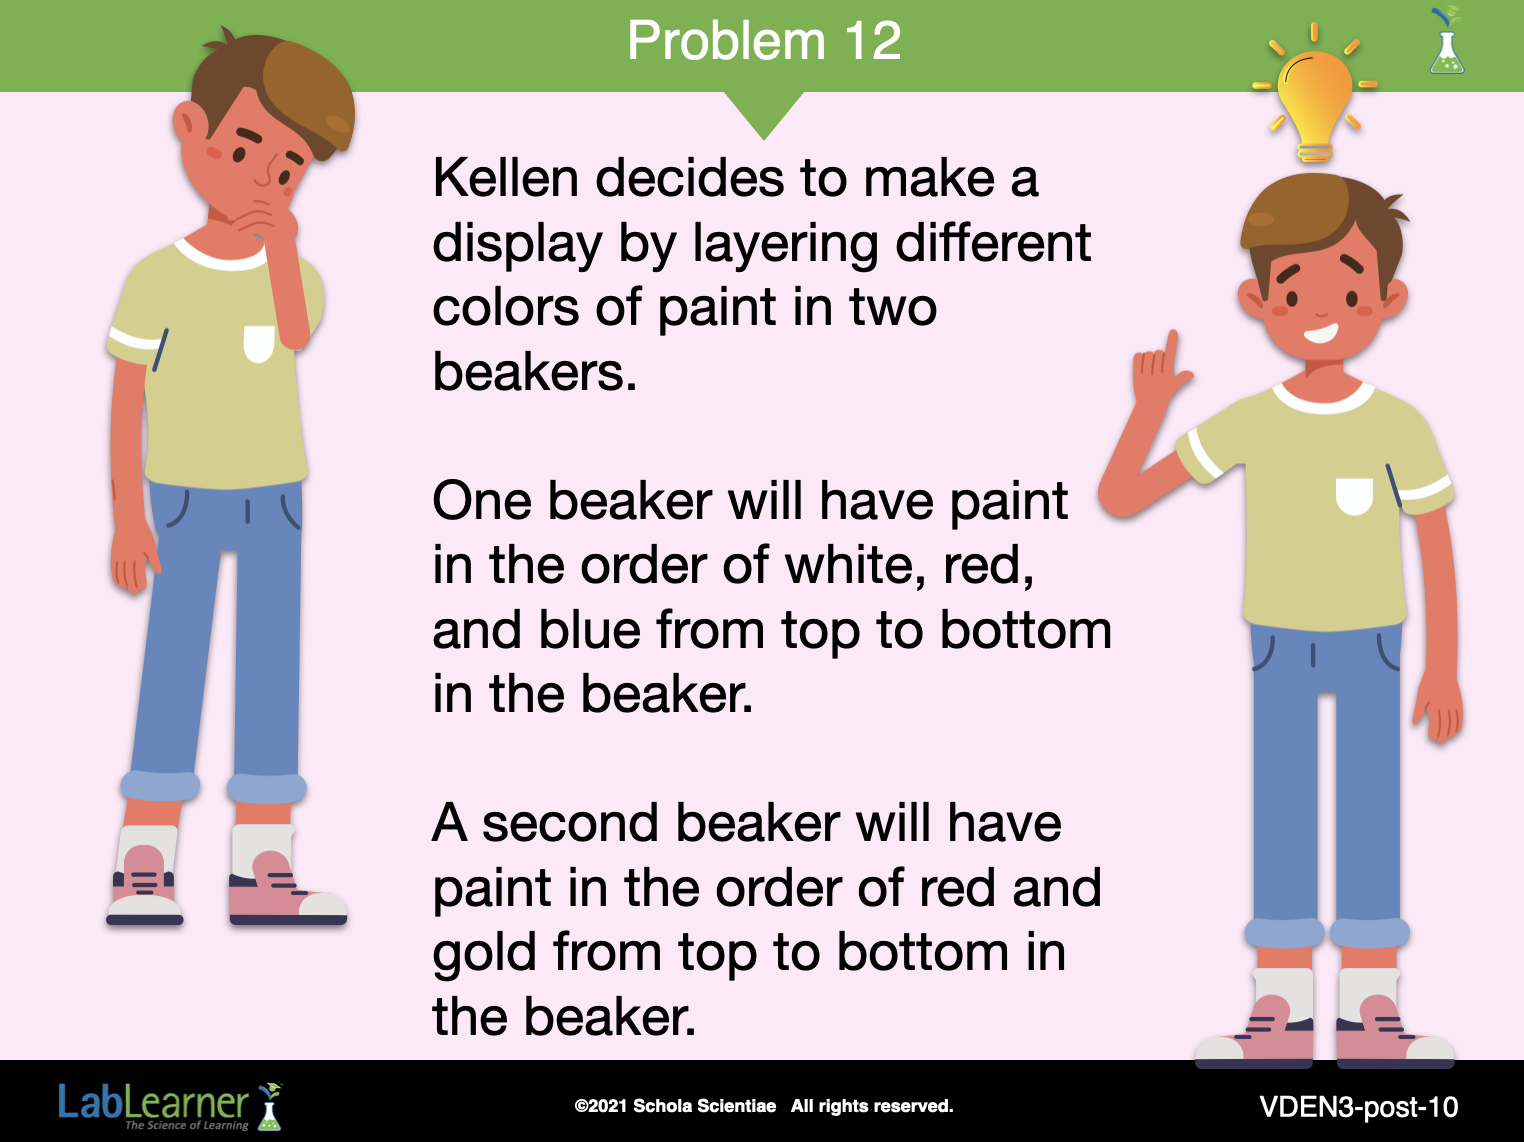
G. To conclude this portion of the Investigation, ask students to participate in the application problem described in Problem 12 of their Student Data Record. Discuss the solution to the problem as a class.
______________________________________________
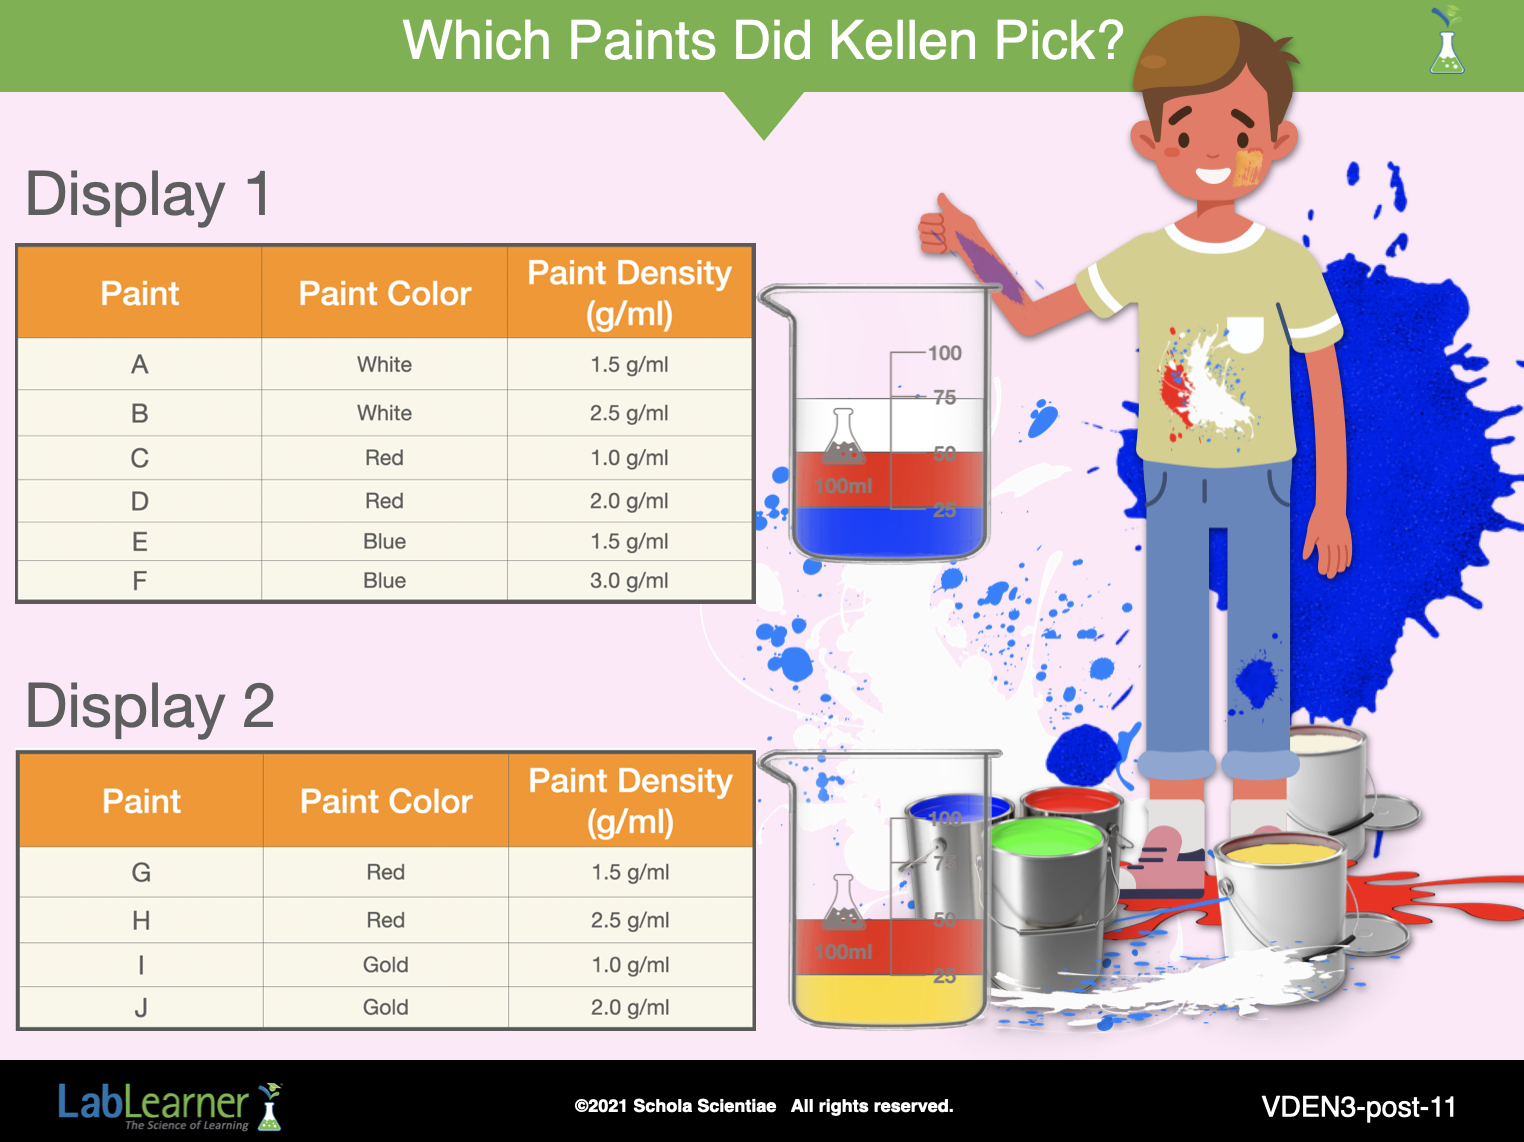
SLIDE VDEN3-post-11
KEYS: POSTLAB