Teacher Portal:
Work and Simple Machines
Investigation 4 – PostLab
 PRINT IT
Use your browser to download a printable PDF as help during the slide presentation and to make additional notes. In your browser, go to File > Print and then choose to save as PDF.
NAVIGATE IT
Once the slide presentation is launched
- use your left and right arrows to advance or go back in the slide presentation, and
- hover your mouse over the left edge of the presentation to get a view of the thumbnails for all the slides so that you can quickly move anywhere in the presentation.
- Click HERE to launch the slide presentation for the CELL.
SHARE IT

SLIDE VWORK4-post-1
Begin the analysis of the data by reviewing several of the concepts introduced during the experiment. The following questions can be used to initiate a discussion of these concepts with the students.
What is a lever? It’s an example of a simple machine. The lever uses a beam that turns on a fixed point, called the fulcrum.
Compare the two simple machines you have worked with thus far. How are they similar? How are they different? Both the lever and pulley have a load and effort arm. The application of effort along the lever can be changed, whereas on a fixed pulley the effort cannot be changed.
______________________________________________
SLIDE VWORK4-post-2
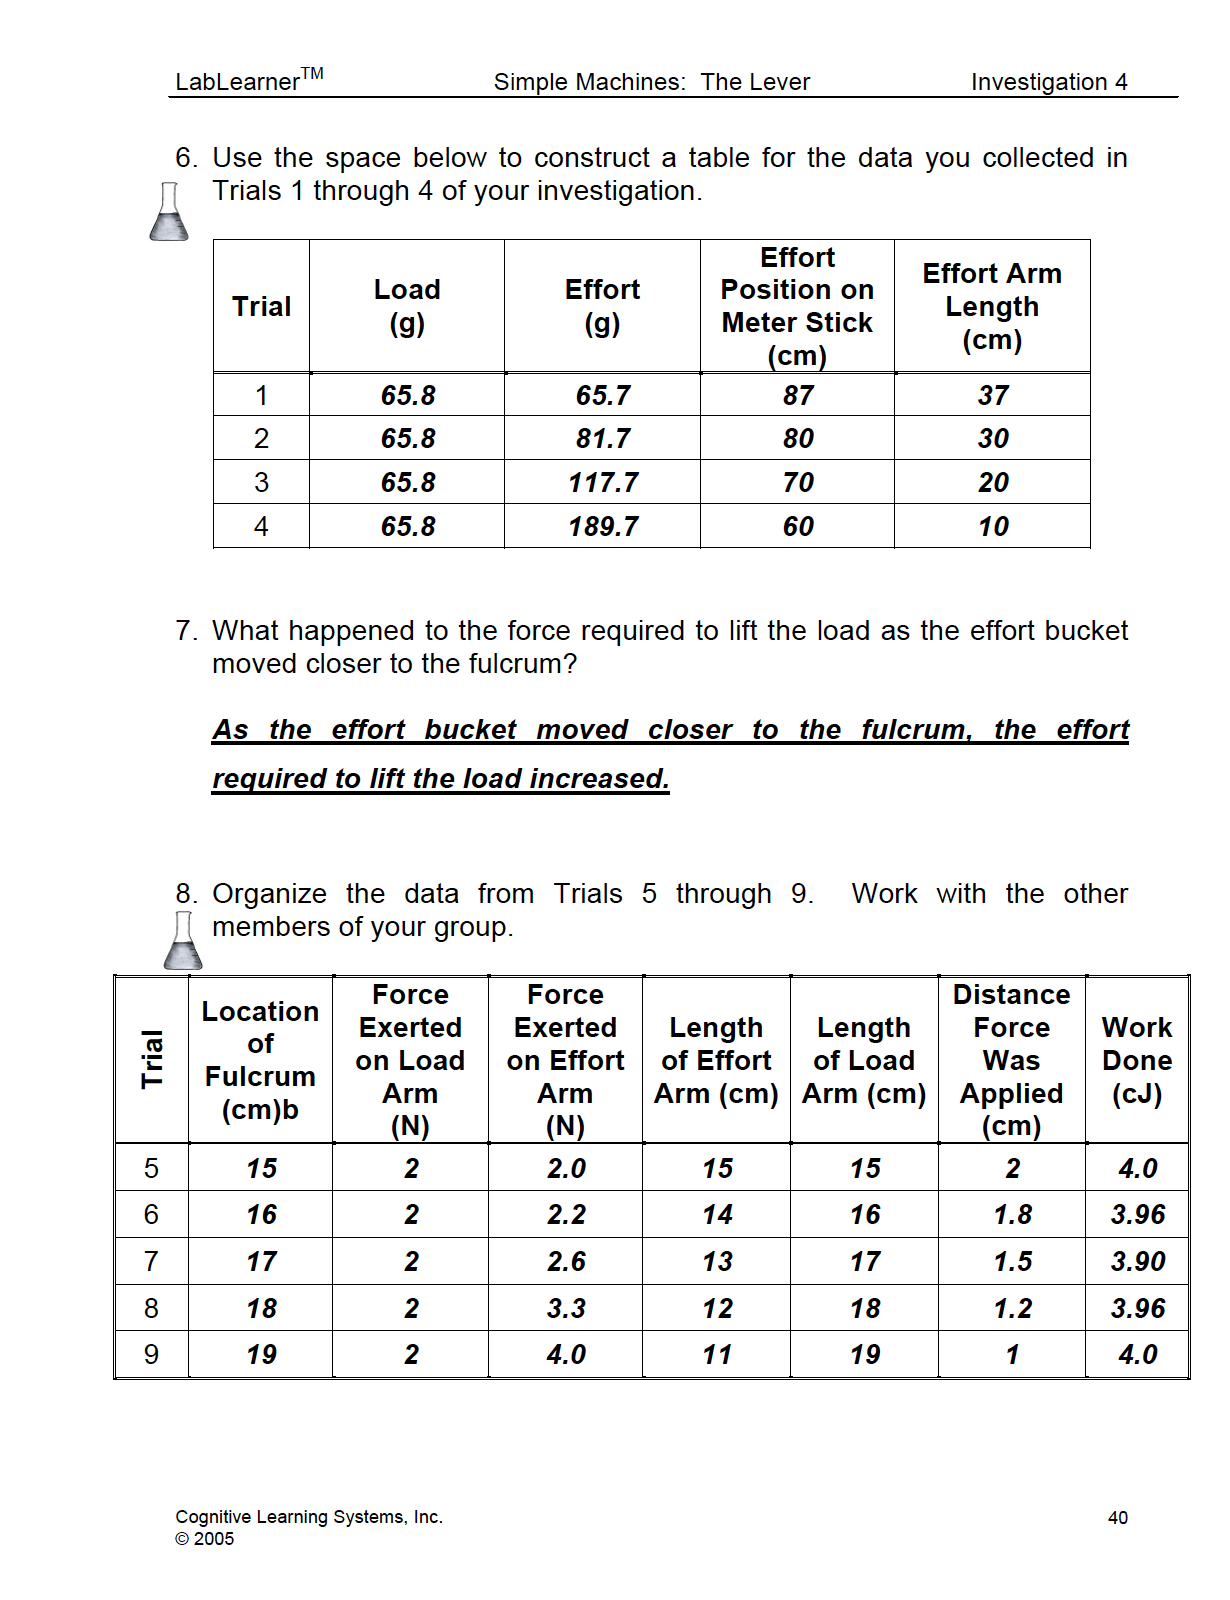
Direct students to think of the first set of experiments (Trials 1 – 4) they conducted.
In these experiments, they had a load and effort bucket on a lever and compared the effort needed to lift the same load as the effort bucket moved closer to the fulcrum.
1. Remind students of the question they were asked as they conducted the experiments. How does the force required to lift the load change when the effort is applied at different positions along the lever? Student answers will vary.
2. Ask students: How could we organize the data from this set of experiments (Trials 1 through 4) to help us answer this question? Student answers will vary.
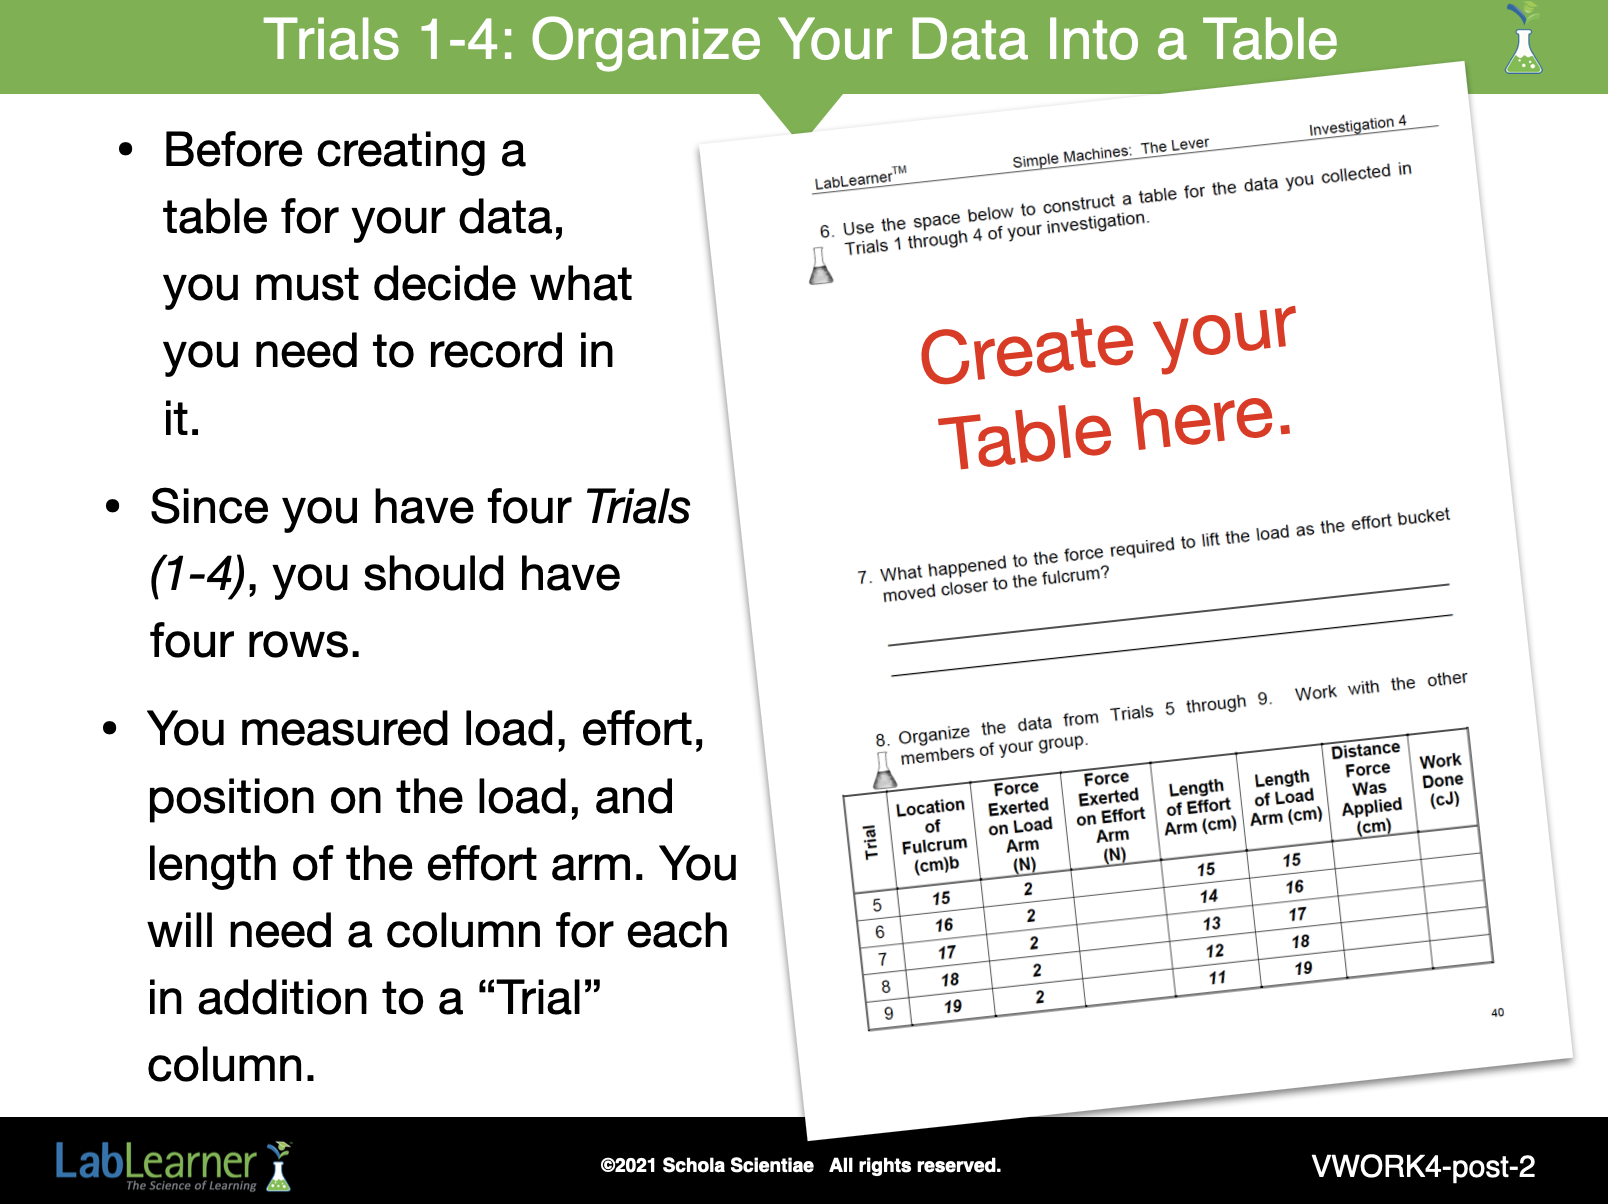
3. Model the construction of a table with the class that presents their data in a meaningful format for analysis. Students should use the blank space in Problem 6 of their Student Data Record to complete their table.
a. Before students create their Table, discuss with them how a Table could help organize their data from Trials 1 through 4. Model how to create a data table by explaining the decisions students will need to make in order to create the table.
• Before creating a table for your data, you must decide what you need to record in the Table.
• There were several Trials in the Investigation, so you want a place in your Table to identify and record the data from each Trial. Since you have four Trials, you should have four rows.
• You will need columns to record the data you collected from each trial, so you will need to identify the data needed in those columns.
• Since you recorded the mass of the load bucket, mass of the effort bucket, the position of where the effort was applied, and the length of the effort arm in your data, you will need four columns for your data.
• You must decide on appropriate titles for your columns.
b. After discussing each of the steps, construct a table on the board. Complete the table using the data from each trial.
______________________________________________
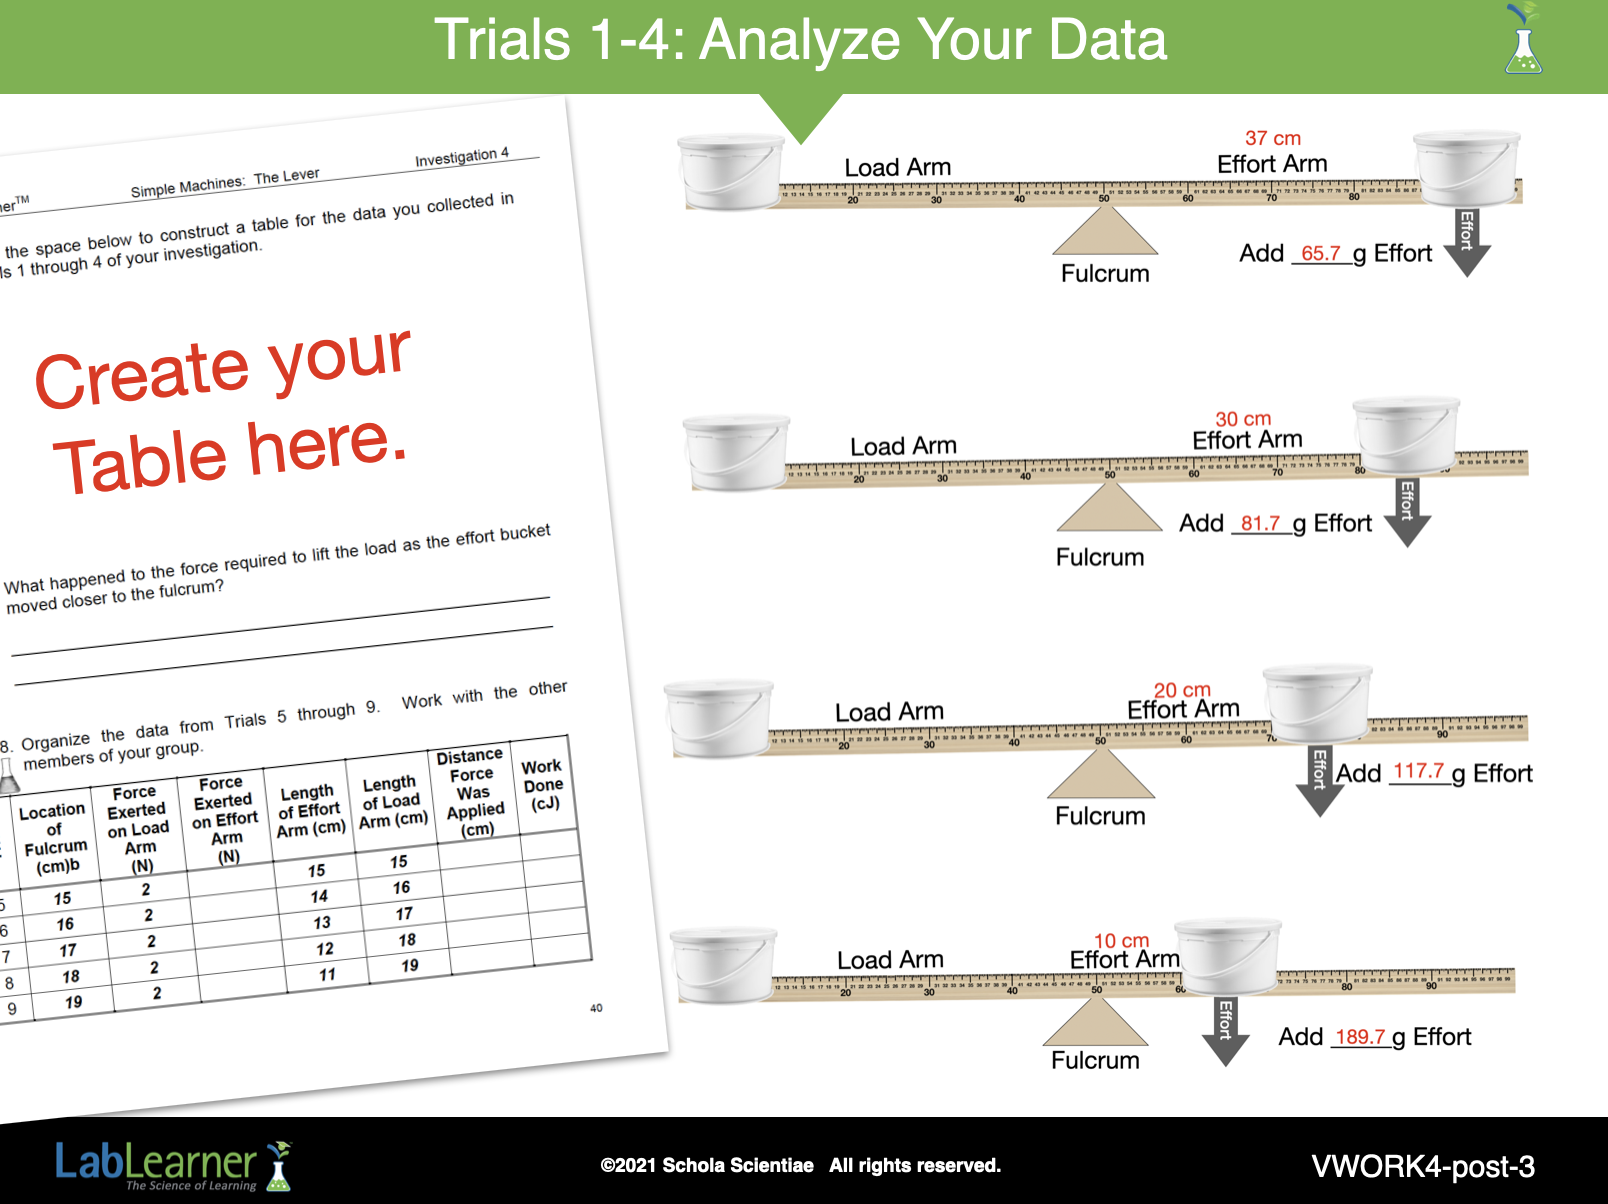
SLIDE VWORK4-post-3
Ask students the following questions to help them draw conclusions from the data in the Table:
1. Which parts of the lever remained constant from trial to trial? The mass of the load, position of the load, and fulcrum remained constant.
2. Which parts of the lever changed from Trial to Trial? The position of the effort bucket, the mass of the effort bucket, and the length of the effort arm changed.
3. The length of the effort arm is the distance from the effort bucket to the fulcrum. Describe how the length of the effort arm changed as the position of the effort bucket changed? As the effort bucket moved from the 87 cm mark to the 60 cm mark, it moved closer to the fulcrum and the length of the effort arm decreased.
4. Describe what happened to the effort required to lift the load as the effort bucket moved closer to the fulcrum. As the effort bucket moved closer to the fulcrum, the effort required to lift the load increased. Direct students to enter their answers in Problem 7 of their Student Data Record.
______________________________________________
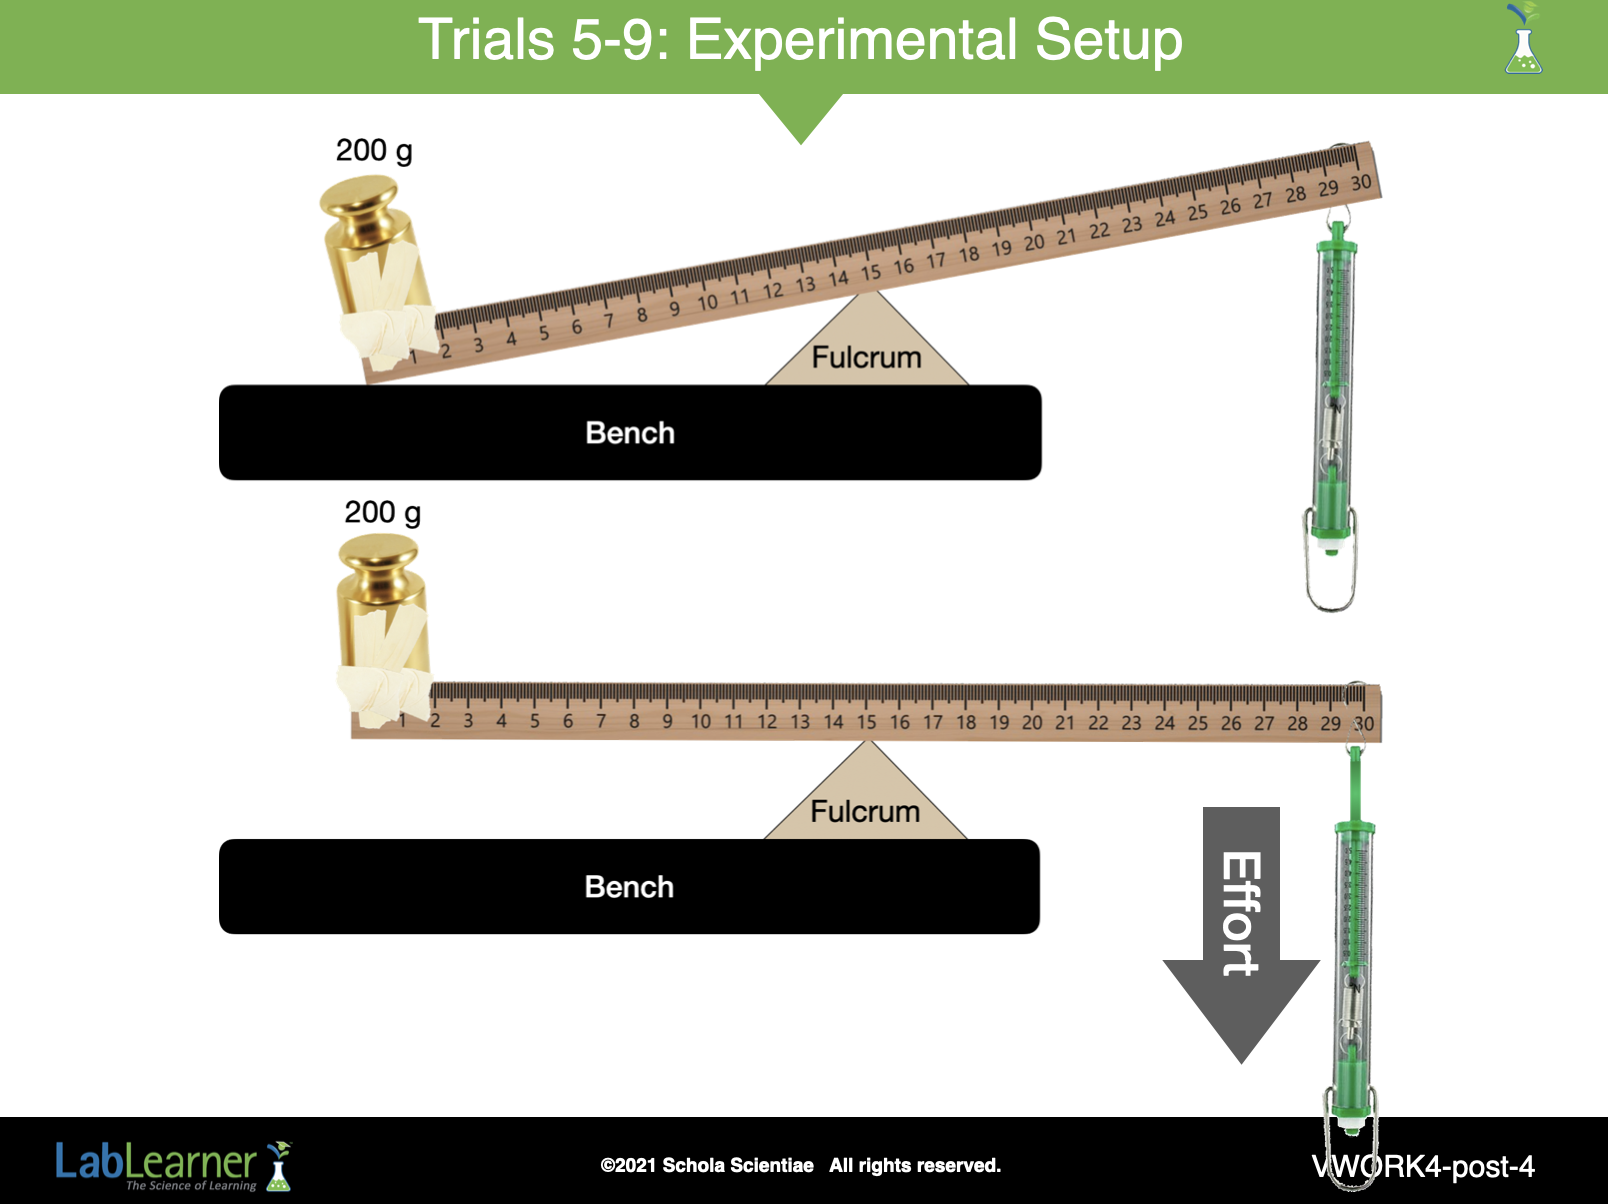
SLIDE VWORK4-post-4
This slide simply shows a diagrammatic view of the setup for Trials 5 – 9.
______________________________________________
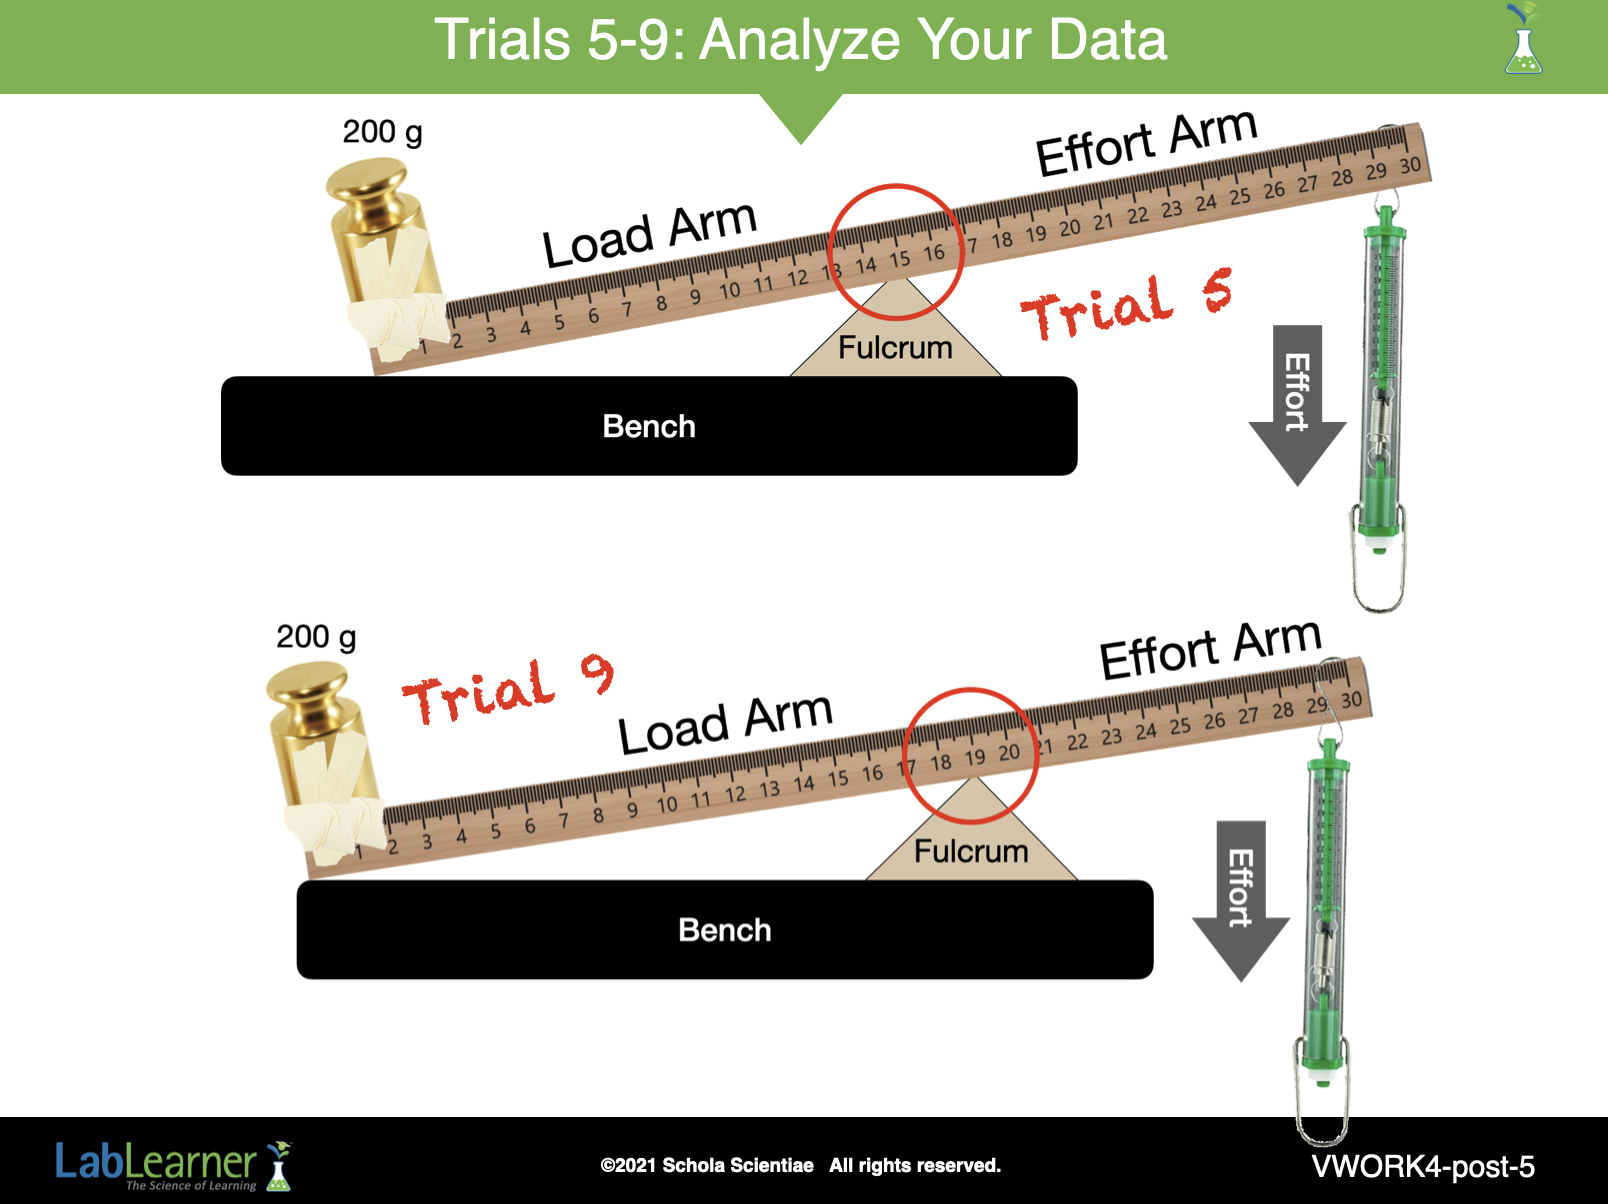
SLIDE VWORK4-post-5
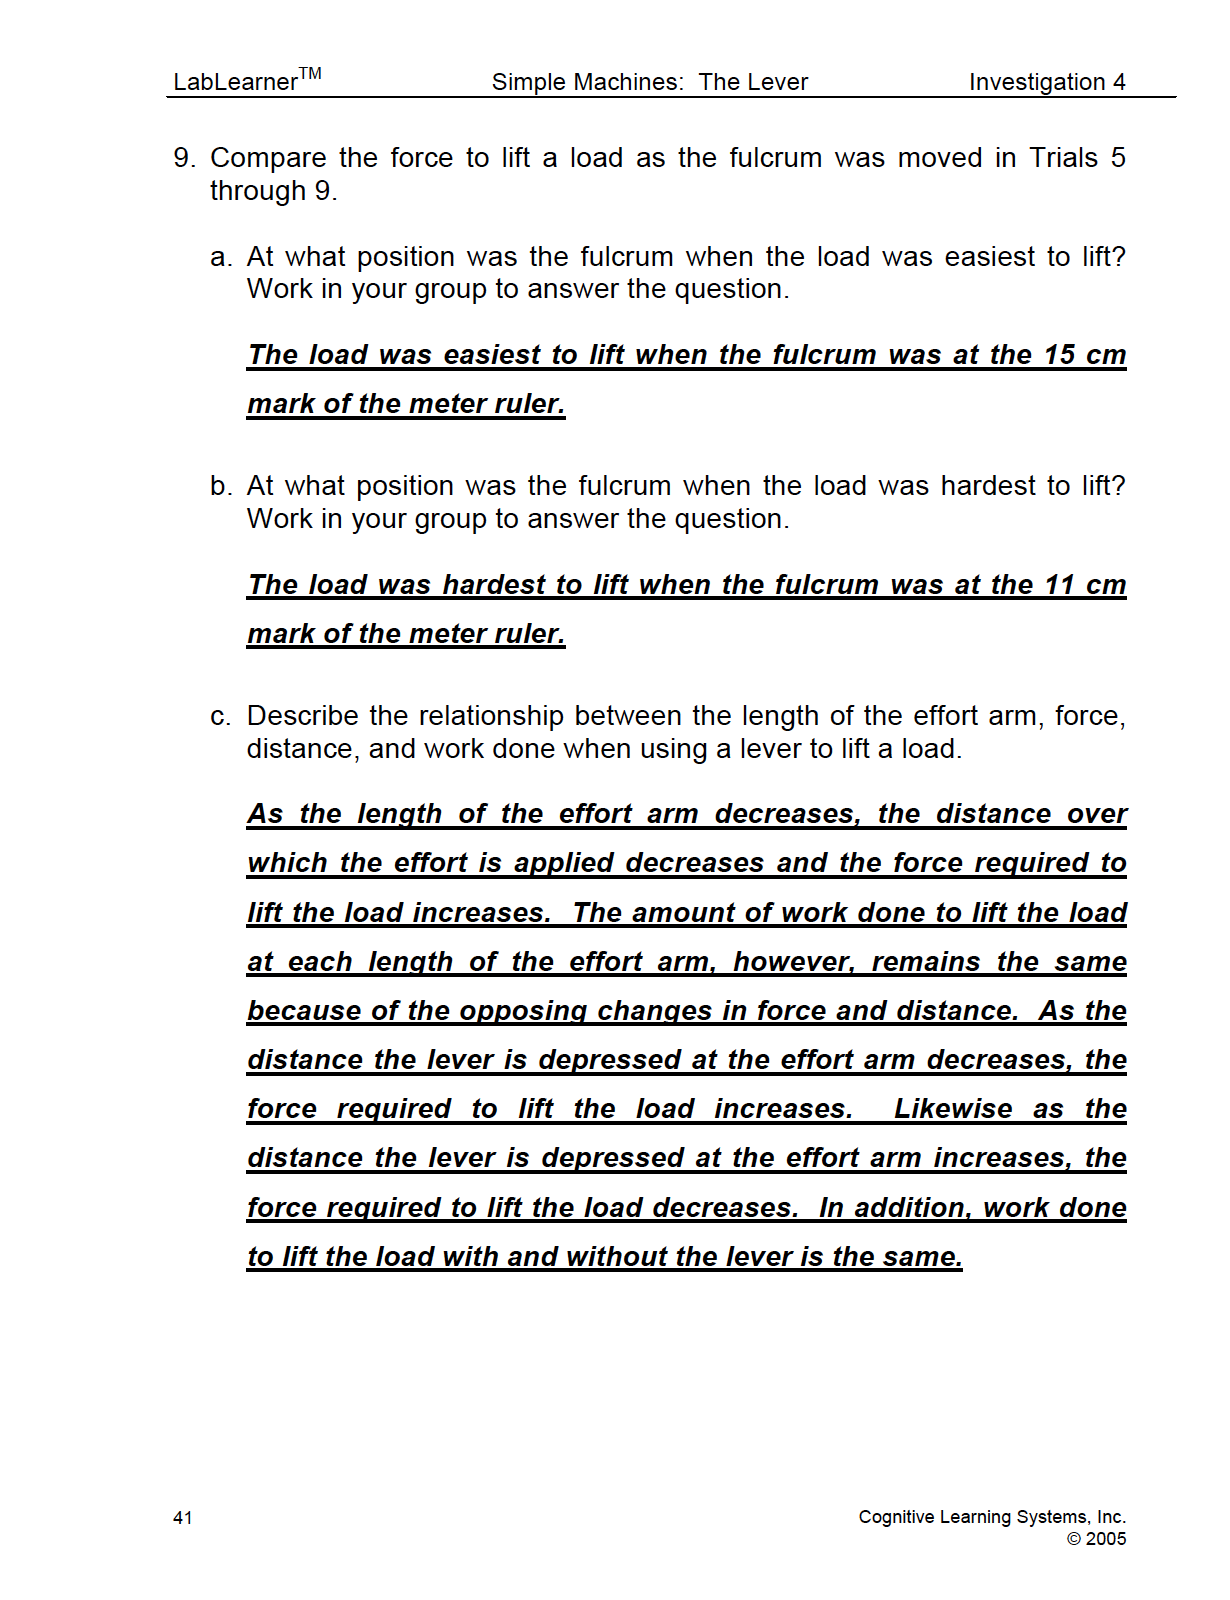
Remind students that they conducted experiments in which they compared the force to lift a load as the fulcrum was moved. These were Trials 5 through 9.
1. Ask students: How did the position of the fulcrum affect the force needed to lift the load?
2. Direct students to complete the third column of the table in Problem 8 of their Student Data Record to help answer the question. Columns 1, 2, and 4 have already been completed for students.
______________________________________________
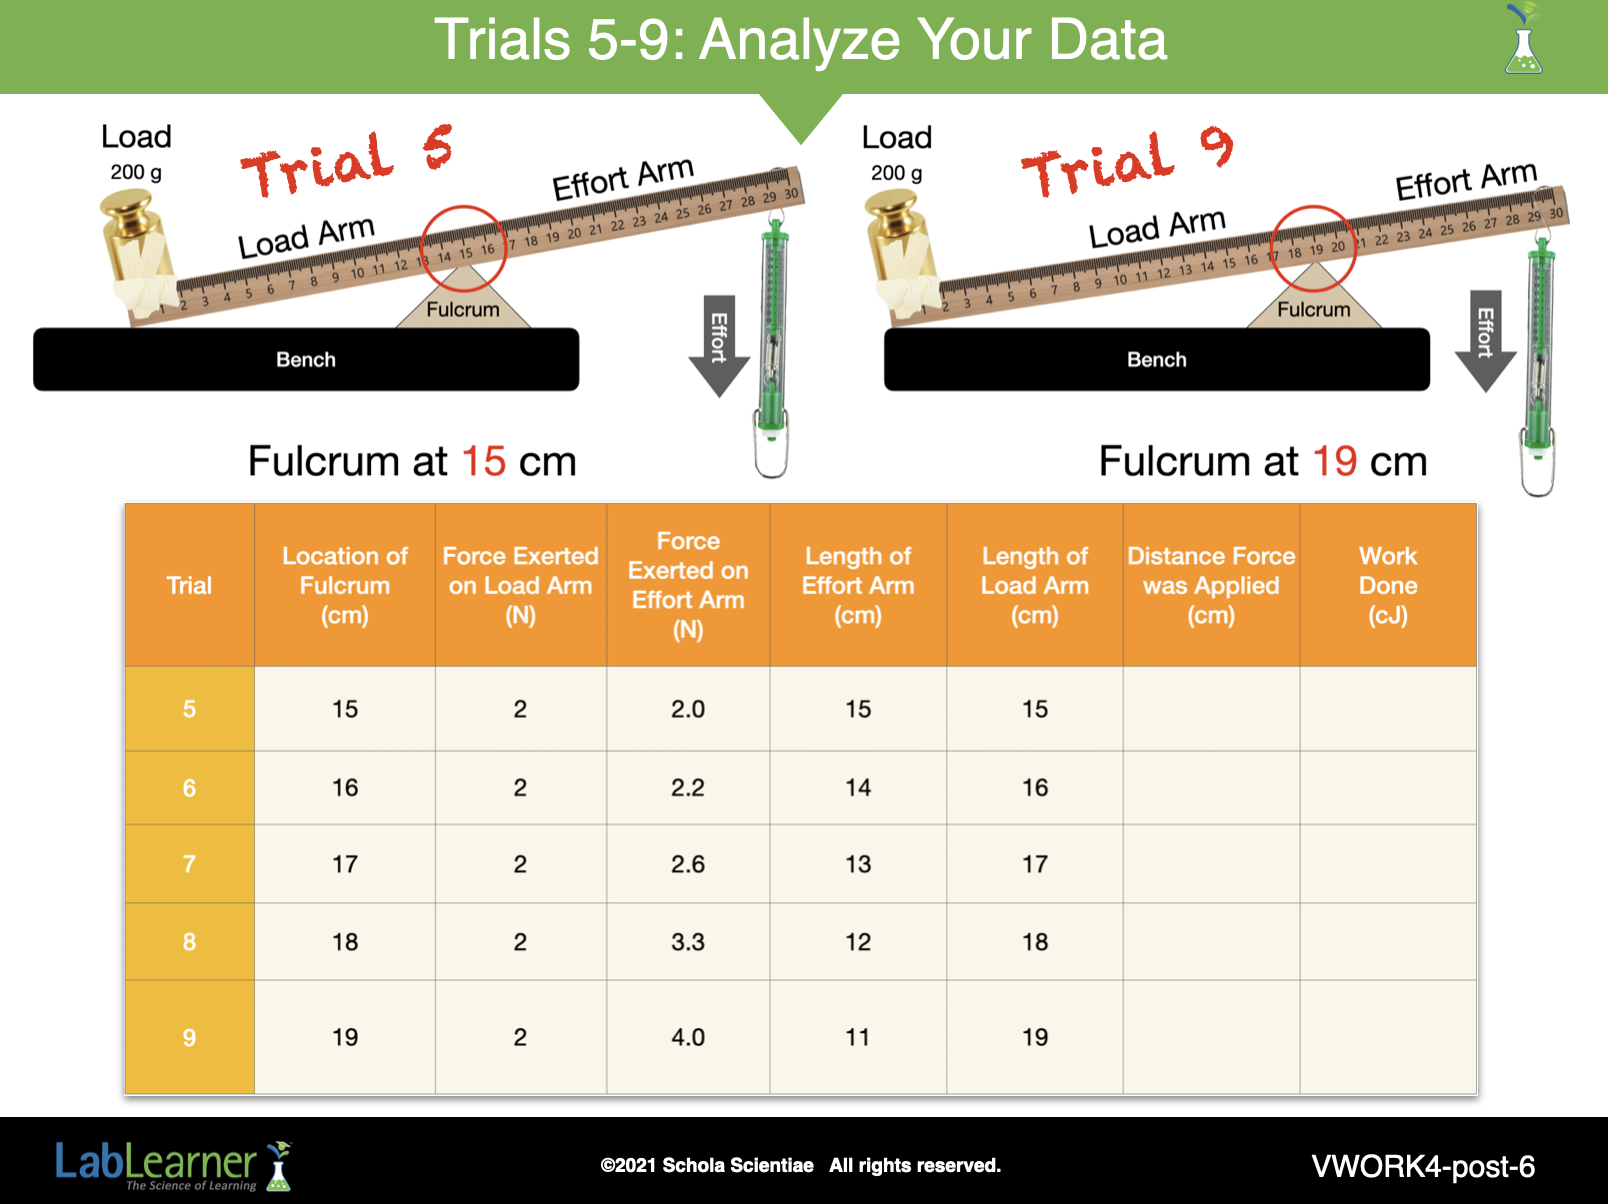
SLIDE VWORK4-post-6
Analyze the data from the first five columns of the table with the class. Ask students the following questions and refer to the data in the table as you discuss their responses. Students may record their conclusions in problem 9 of their Student Data Record.
1. What was similar about each trial? The force exerted by the load was the same for all five Trials.
b. As the fulcrum moved from the 15 cm mark to 19 cm, what happened to the length of the effort arm? It decreased.
c. As the fulcrum moved closer to the effort end of the lever and the effort arm decreased in length, what happened to the force needed to lift the load? It increased.
d. What happened to the length of the load arm as you moved the fulcrum? As the fulcrum was moved further from the load, the load arm’s length increased.
e. Can you summarize the changes that occurred as you moved the fulcrum? As the effort arm decreased, the load arm increased.
______________________________________________
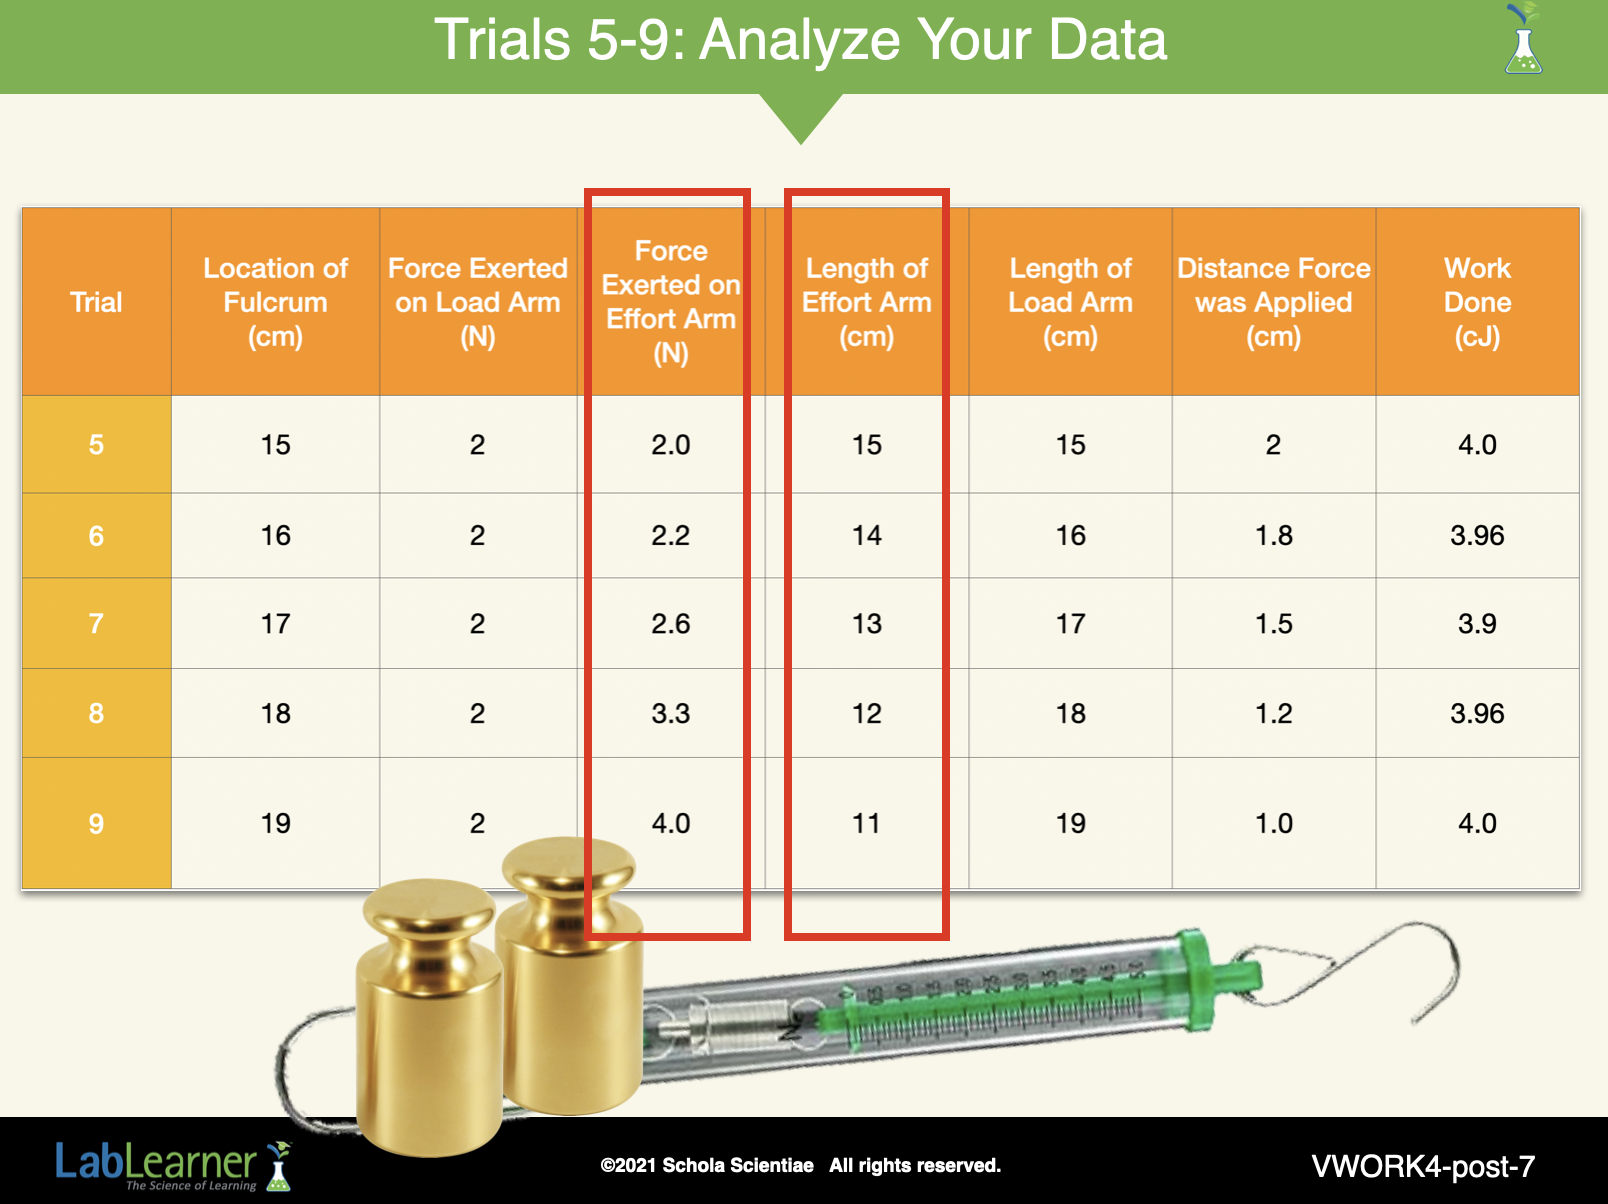
SLIDE VWORK4-post-7
Ask students: How does a change in effort arm length affect the work done to lift a load?
1. Help students determine the answer by completing the last two columns of the table. Direct students’ attention to the units of work for this table. The units in which students will record work are centijoules (cJ). Centijoules are smaller units of work than joules and are used when the distance recorded is in centimeters. Students will continue to calculate work using the formula Work = Force × distance. However, because the distance is smaller than 10 cm, the conversion of cm to meters will not be performed. Instead, work will be reported as centijoules.
2. Ask students the following questions about the data:
a. Did the amount of work done to lift the load change as the effort arm decreased? No. Students may observe small differences in the amount of work such as 4.2cJ at one fulcrum position versus 4.68 cJ in another fulcrum position. However, these differences are within the normal limits of experimental variation and are minimal. Thus students should conclude that the work done did not change in effort arm length. If students ask for examples of types of data that would suggest a change, you could give the following example: 4 cJ of work in one Trial versus 8 cJ of work in another Trial.
b. Why was work the same? As the fulcrum moved and effort arm length decreased, the force increased, but the distance the effort arm had to be pulled to lift the load decreased. The increase in force needed to lift the load was matched by an equivalent decrease in distance, and the work was the same.
c. When using a lever, does the amount of work done change when effort arm length changes? No. Work is always the same.
d. The force on the load was 2 N. If you lifted the load without the lever a distance of 2 cm, how much work would you do? 4.0 cJ.
e. Is this the same or a different amount of work as with the lever? The same.
f. Did the lever change the amount of work done? No.
______________________________________________
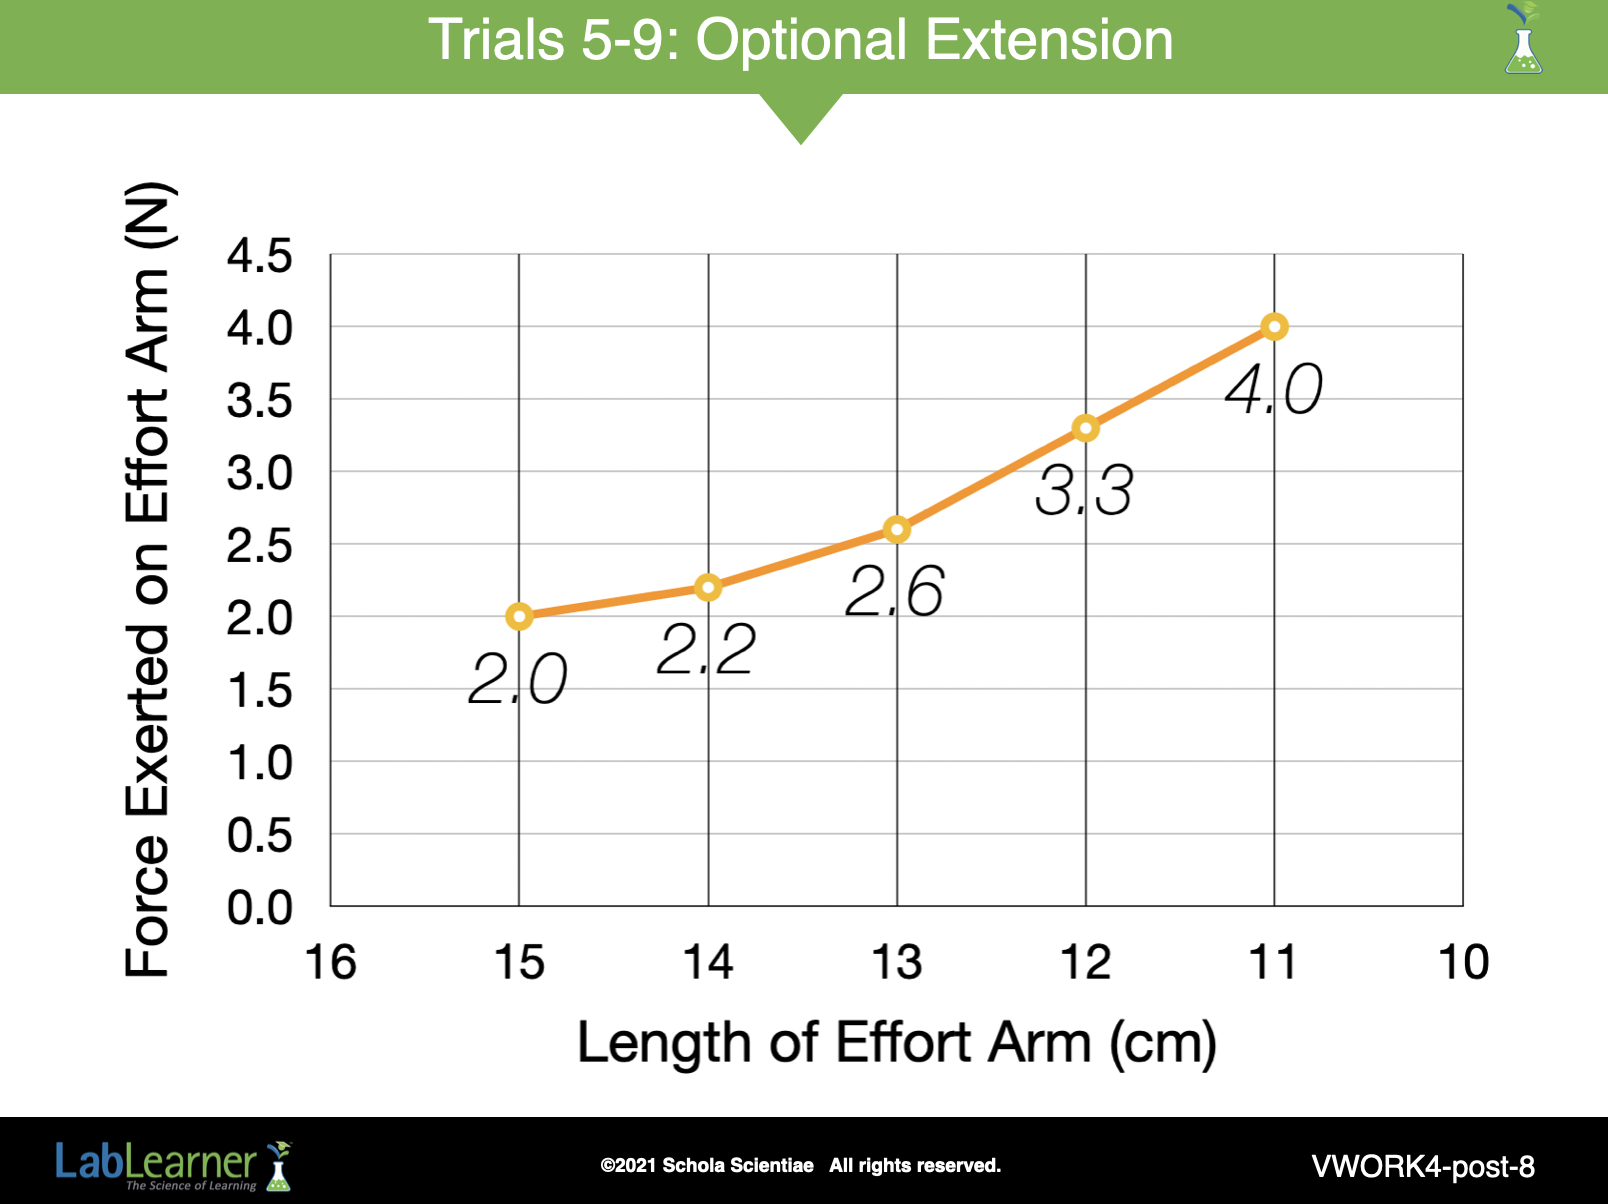
SLIDE VWORK4-post-8
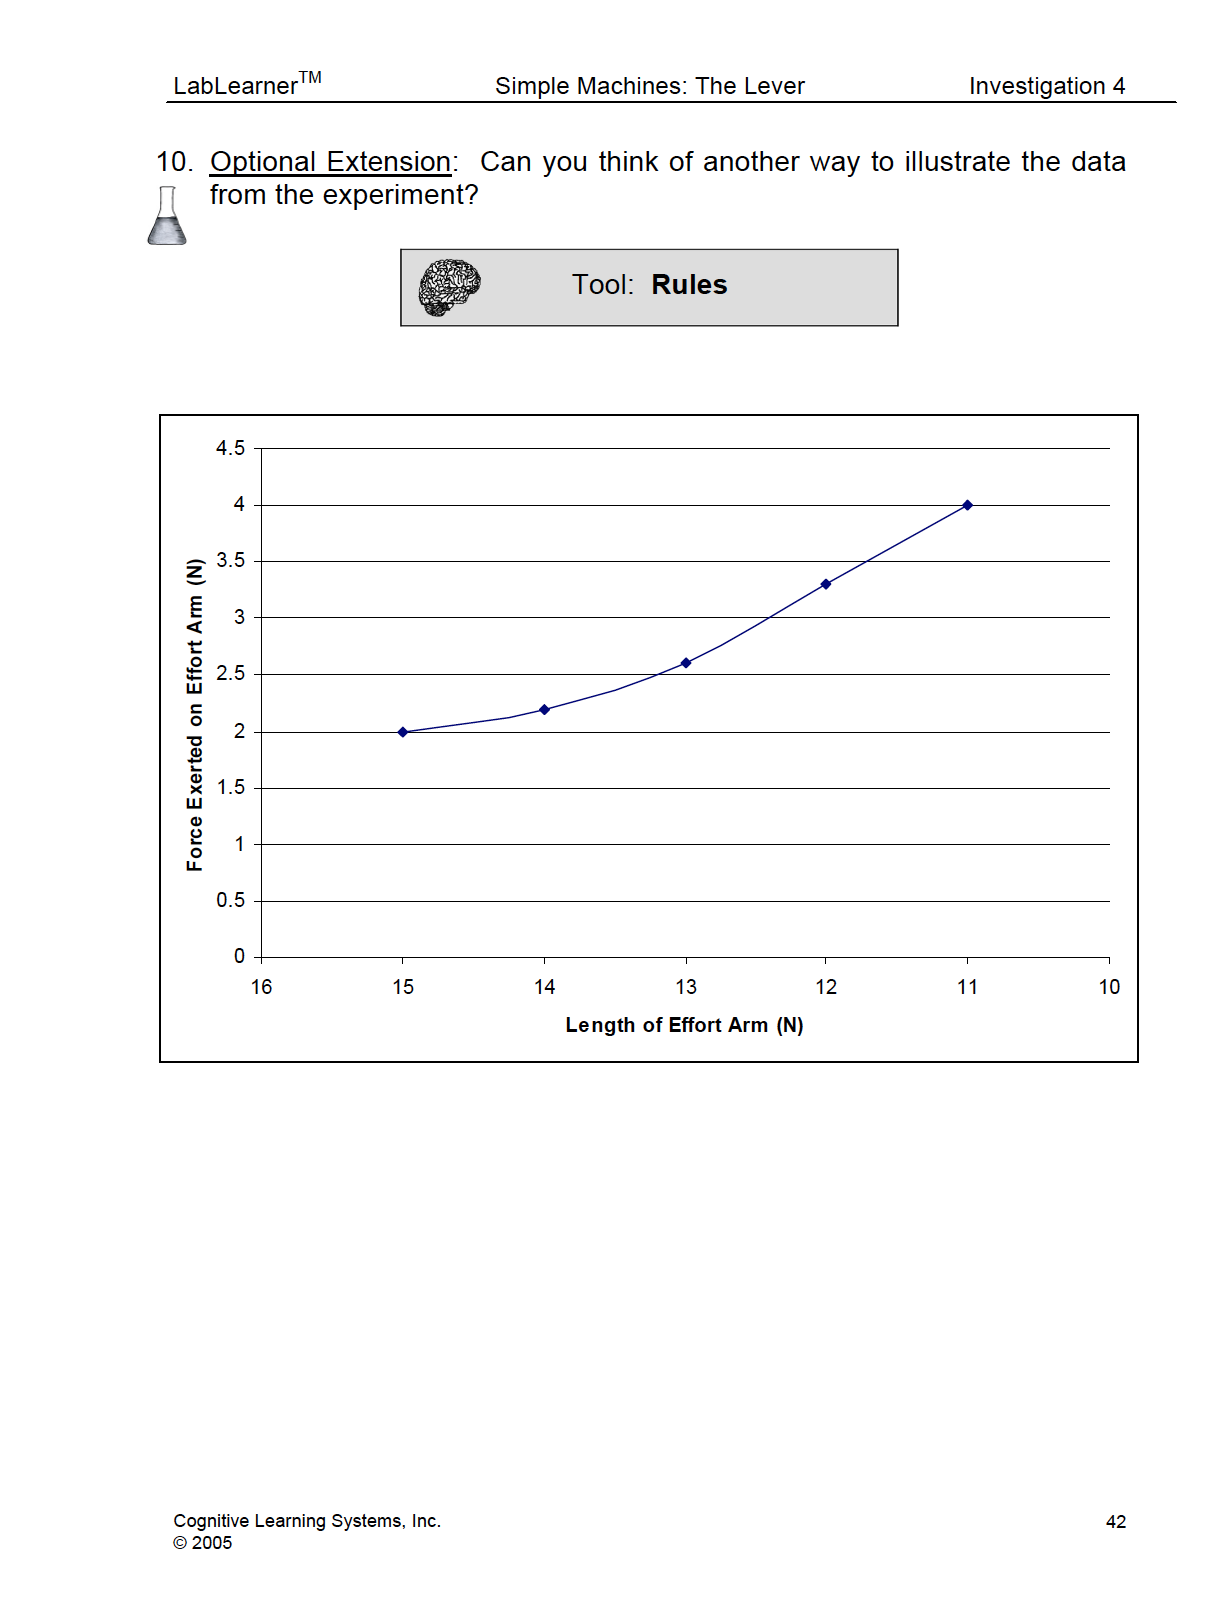
Optional Extension: Can you think of another way to illustrate the data from the experiment? Guide students to the realization that a line graph can be used to compare the relationships they noticed in the table. Direct students to form the same groups they had during the experiment. Direct students to refer to their Procedural Toolbox as you walk through the steps for completing a line graph.
1. Instruct students to use the graph in Problem 10 in their Student Data Records to plot the data. Lead the class through the completion of the graph.
2. A short summary of important steps for completing a line graph are shown below.
-
- Locate the x-axis and a y-axis.
- Observe which variable should be plotted on the x-axis and which variable should be plotted on the y-axis.
- Note the labels on the axes.
- Observe the beginning and ending numbers on the x-axis and y-axis. The numbers should allow all the points to be plotted on the graph.
- Observe the scale for each axis.
- Graph the data and connect the points with a line.
3. Ask students to study their completed line graphs. Allow them a few moments to compare and discuss the completed graphs within their group. Ask the following questions to guide students in their understanding of the relationships shown in the graph:
a. How is the length of the effort arm changing? The length of the effort arm is decreasing.
b. How is the force exerted on the effort arm changing? The force exerted on the effort arm is increasing.
______________________________________________
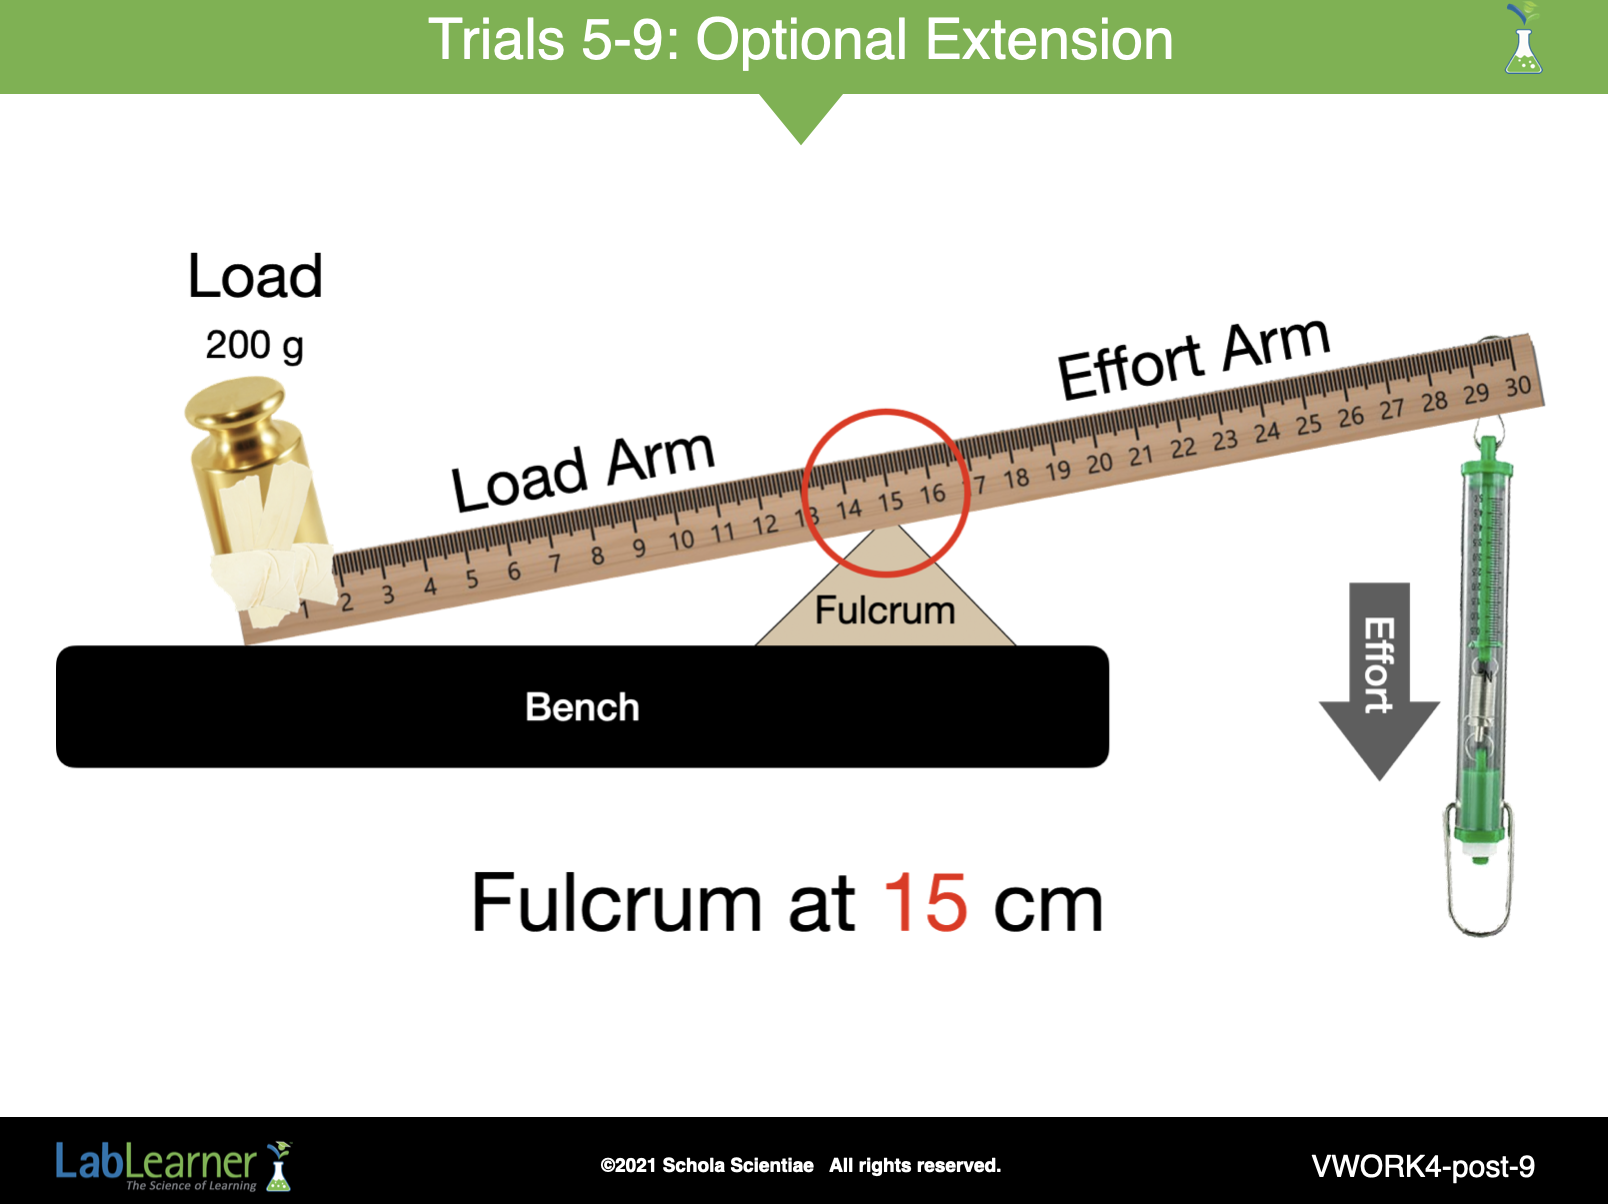
SLIDE VWORK4-post-9
To complete this analysis:
1. Ask students: In your investigation, you moved the fulcrum closer to the effort. Based on your results, what would happen if you moved it closer to the load? Students should suggest that a move closer to the load would decrease the length of the load arm and increase the length of the effort arm. This would be the opposite of the situation from their experiments in the lab. The result would be a decrease in the force needed to lift the load. A small example of this can be seen by observing the results from Trials 5 through 9. The closer the fulcrum was to the load, the lower the force.
2. If the lever does not change the amount of work done to lift a load, what is the advantage of using a lever? How does a lever make work easier? The lever either decreases the distance over which force is applied by exerting a greater force or decreases force to lift a load but over a longer distance.
______________________________________________
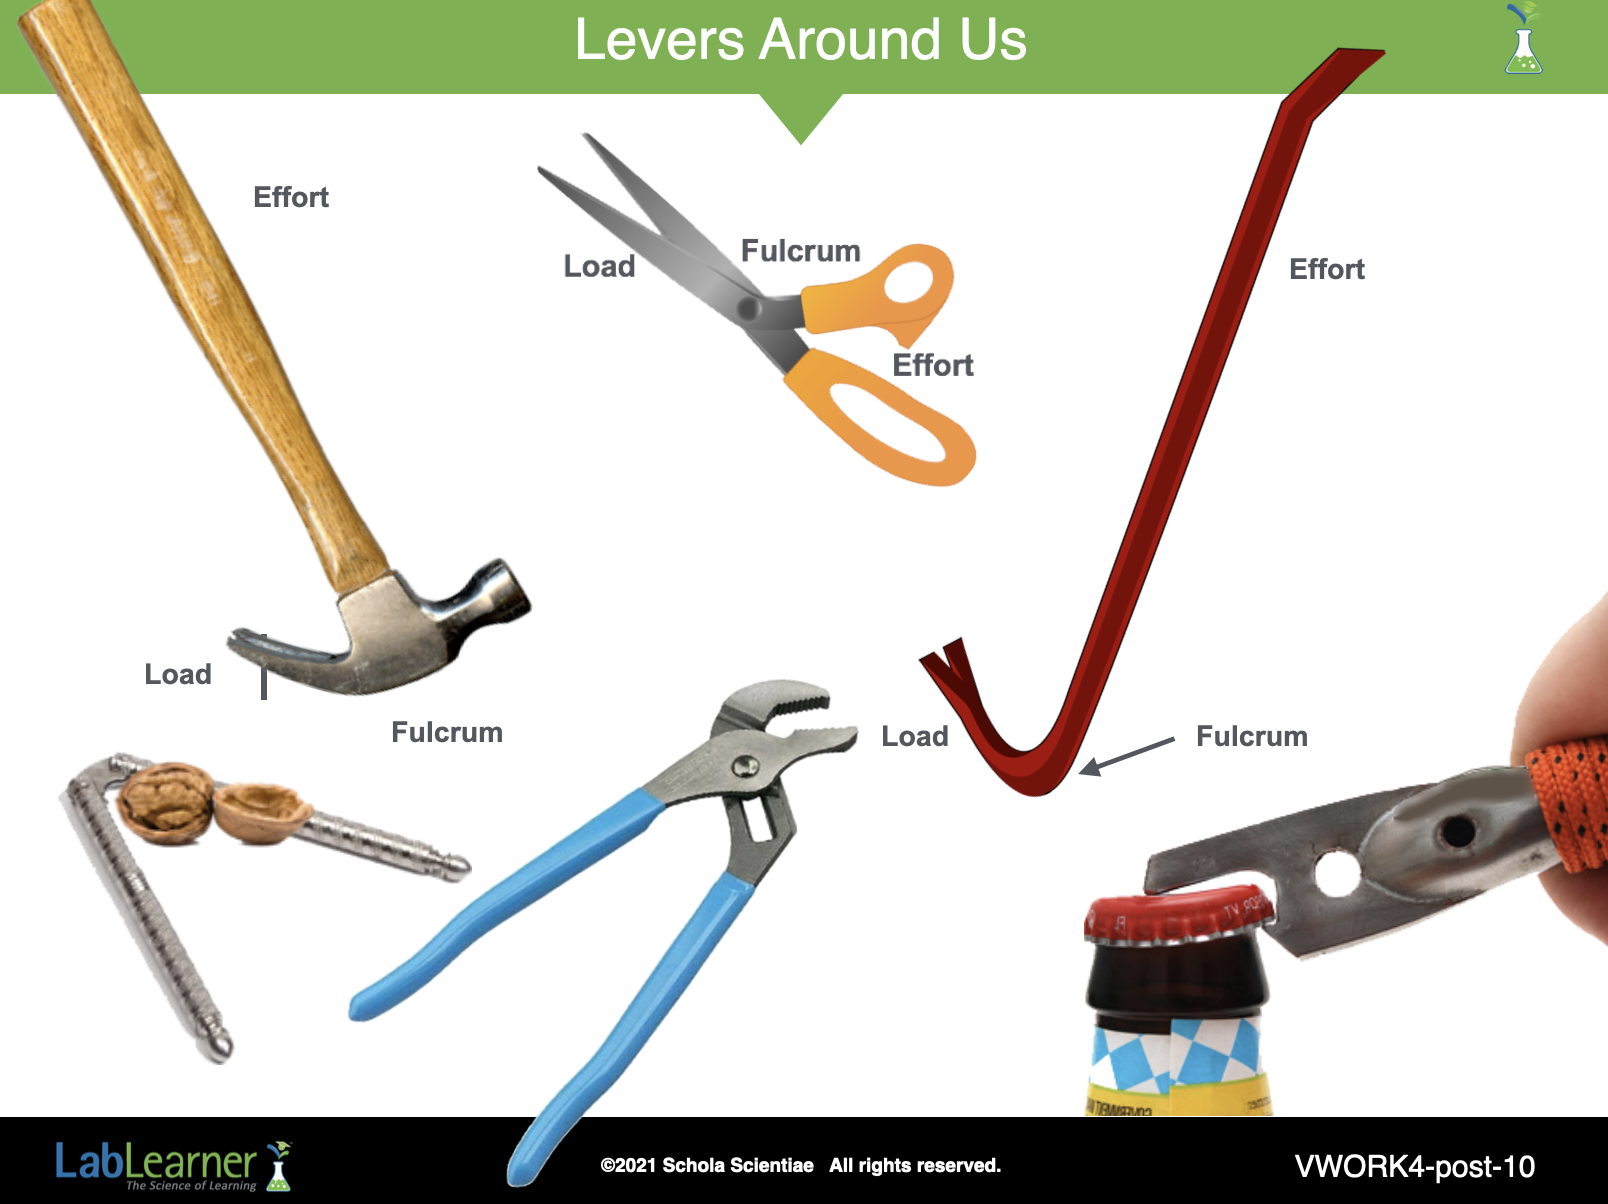
SLIDE VWORK4-post-10
To complete this Investigation:
Ask students: What are some examples of levers that you might see in your home, school, or even on your own body? Student answers will vary. Examples of levers students may see in or around their homes or school include a wheelbarrow, scissors, a see-saw, shovel, a nutcracker, or tweezers.
______________________________________________
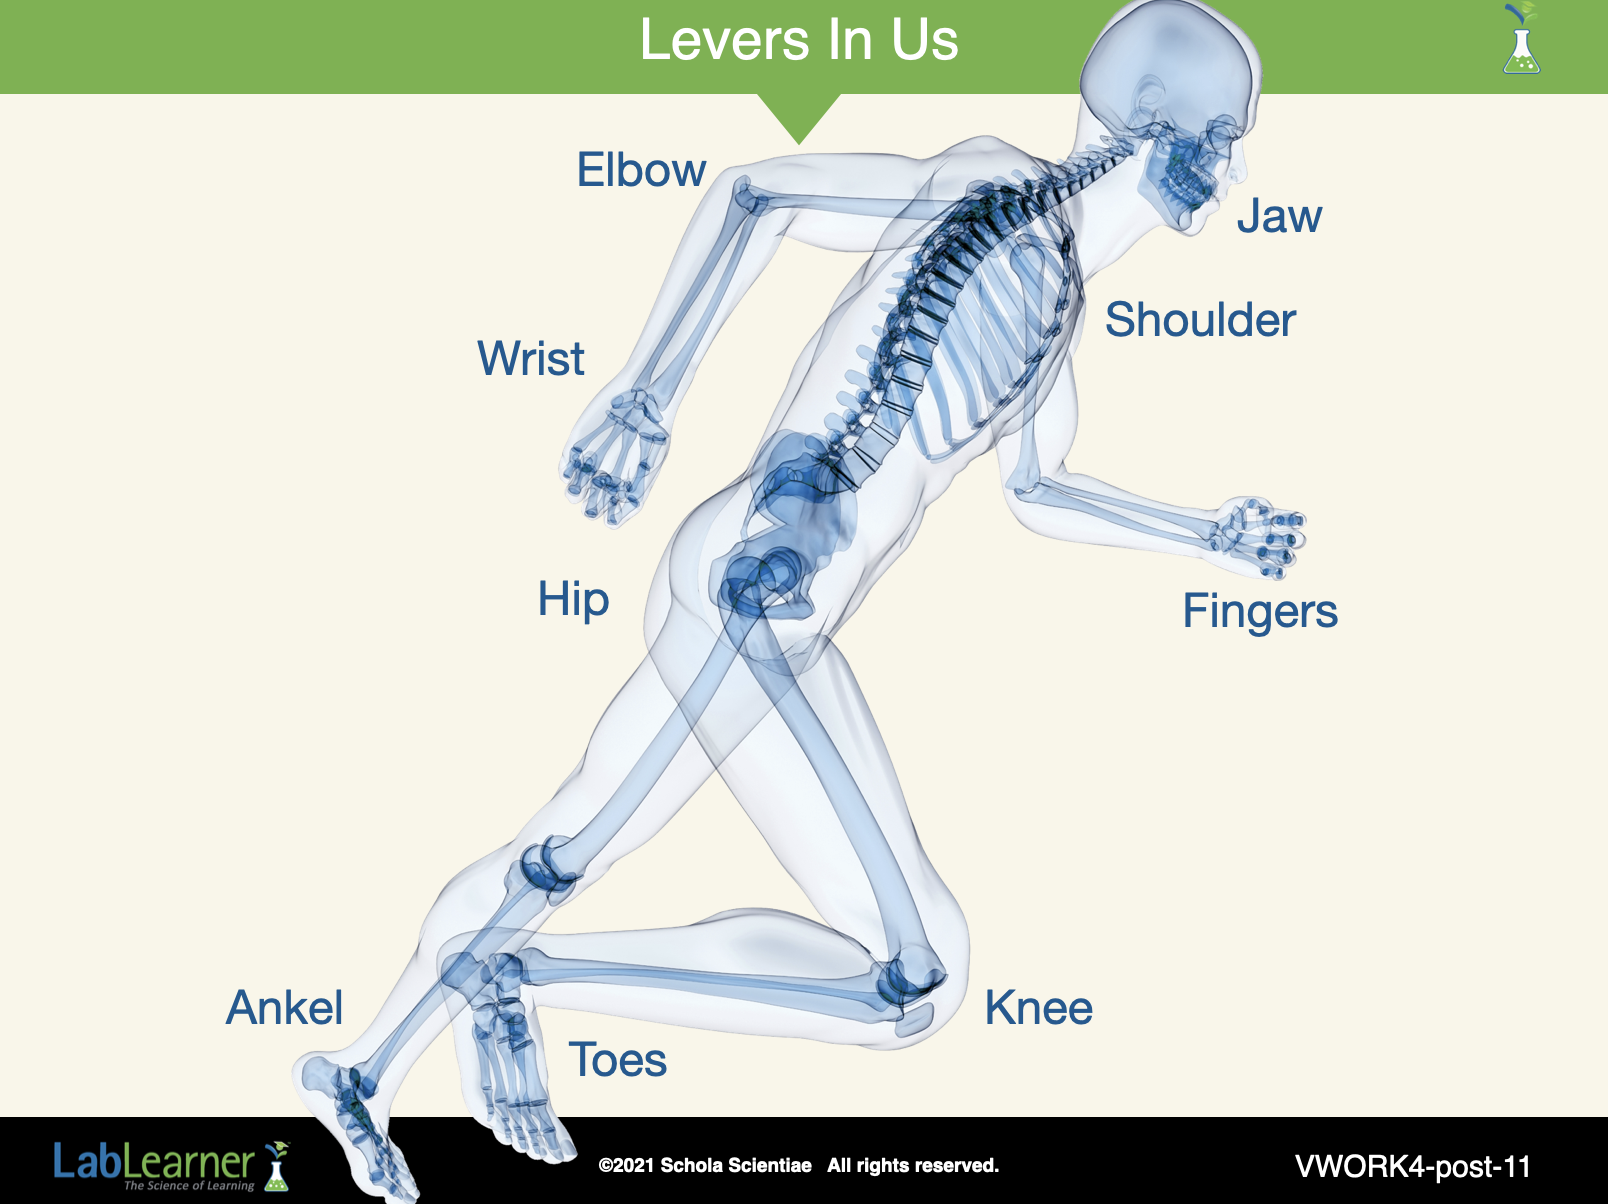
SLIDE VWORK4-post-11
Levers in our bodies:
Many parts of the human body function as levers. The elbow is one joint that acts as a fulcrum when the hand or arm is moved upward to touch the shoulder. In this case, the hand is considered the load and the effort is applied just below the elbow.
A second example of a lever in the human body occurs when a person stands on his or her toes. The toes serve as the fulcrum, the load is the rest of the body and the effort is applied by the calf muscle.
A third example of a lever occurs when a person performs push-ups on the knees or toes. The knees or toes serve as the fulcrum, the effort is applied by the shoulder and chest muscles and the load is the human body.
Tell students they will explore another simple machine, the inclined plane, in the next Investigation.
______________________________________________
KEYS: LAB/POSTLAB