Teacher Portal:
Work and Simple Machines
Investigation 2 – PostLab
 PRINT IT
Use your browser to download a printable PDF as help during the slide presentation and to make additional notes. In your browser, go to File > Print and then choose to save as PDF.
NAVIGATE IT
Once the slide presentation is launched
- use your left and right arrows to advance or go back in the slide presentation, and
- hover your mouse over the left edge of the presentation to get a view of the thumbnails for all the slides so that you can quickly move anywhere in the presentation.
- Click HERE to launch the slide presentation for the CELL.
SHARE IT

SLIDE VWORK2-post-1
Begin the analysis of the experiment by reviewing several of the concepts introduced thus far in this CELL. The following questions can be used to initiate a discussion of these concepts.
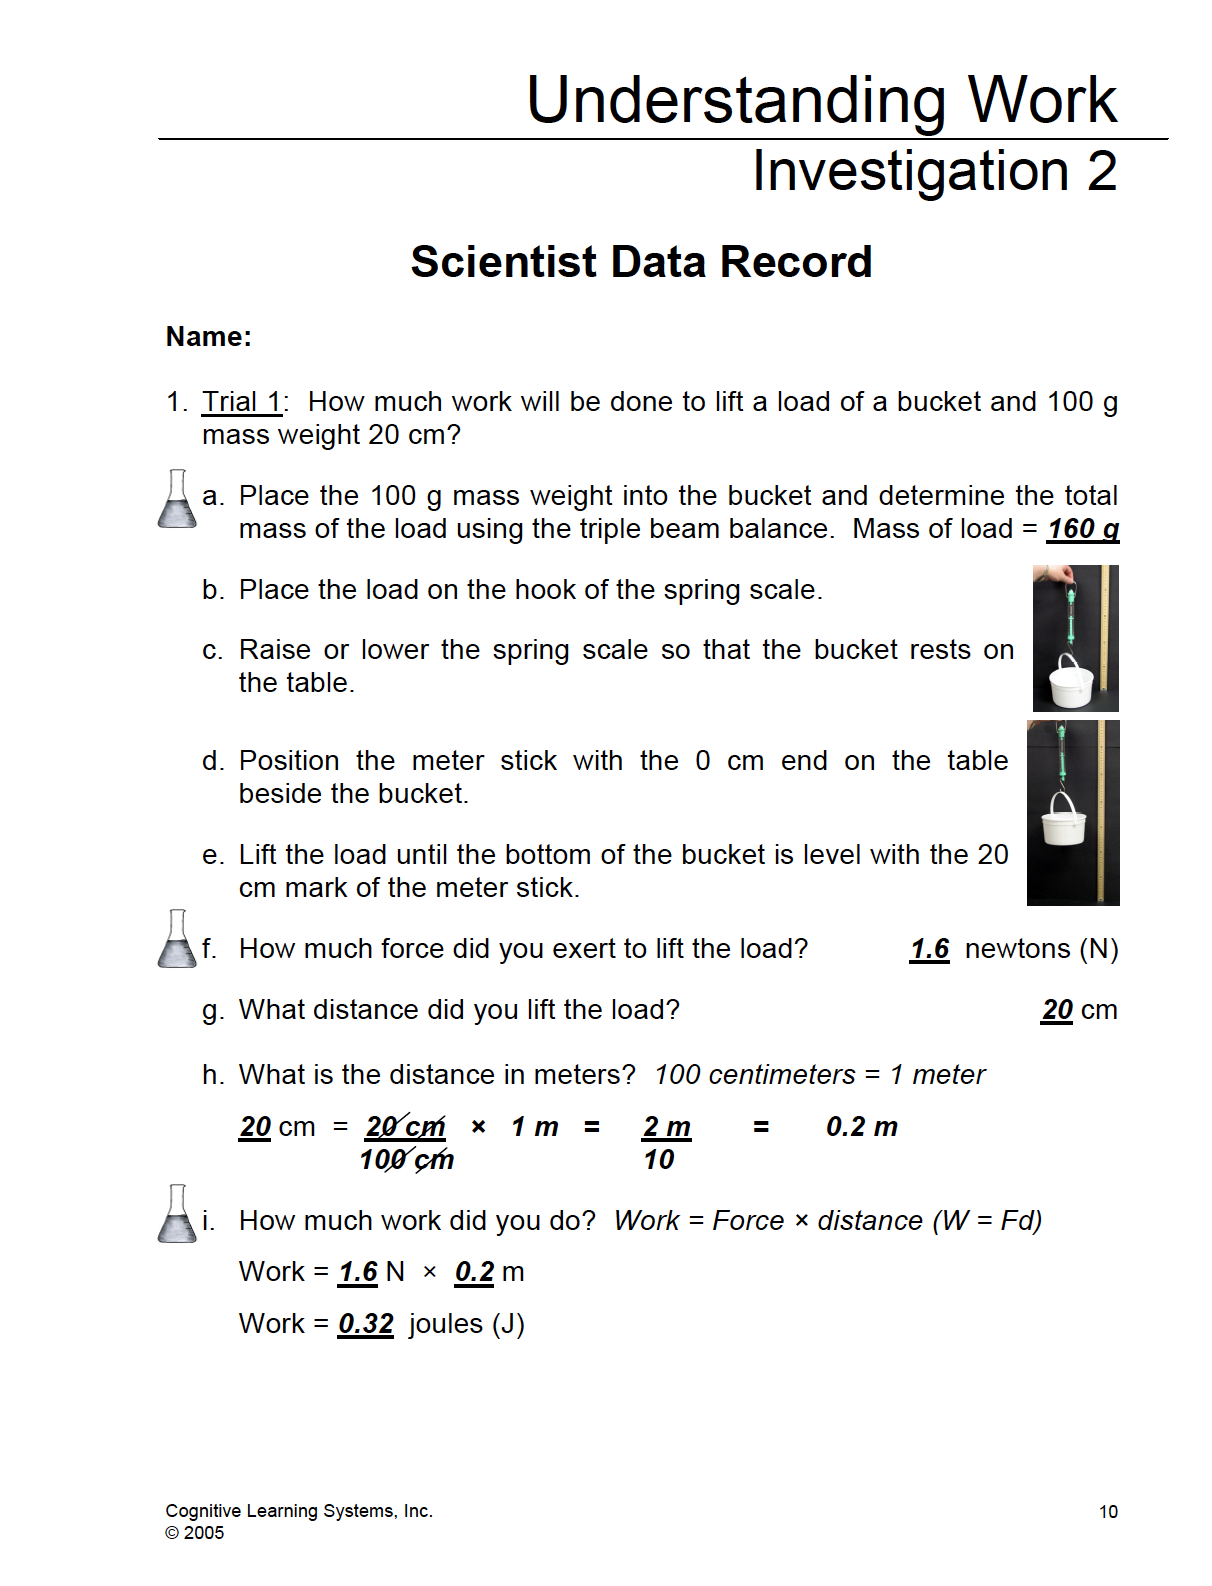
How would you describe work? Work occurs when a force is applied over a distance.
How is work calculated? Work is calculated by multiplying the amount of force applied by the distance over which the force is applied. A formula is used to calculate work: Work = Force × distance (W = Fd).
What is a Joule? A joule is the metric unit of measurement for work. It is represented mathematically as a “J.”
______________________________________________

SLIDE VWORK2-post-2
Ask students: How could you analyze the data from this experiment so that it would be easier to analyze and draw conclusions? Student answers will vary. However, organizing data into tables, graphs, charts, etc. leads directly into the next slide.
______________________________________________
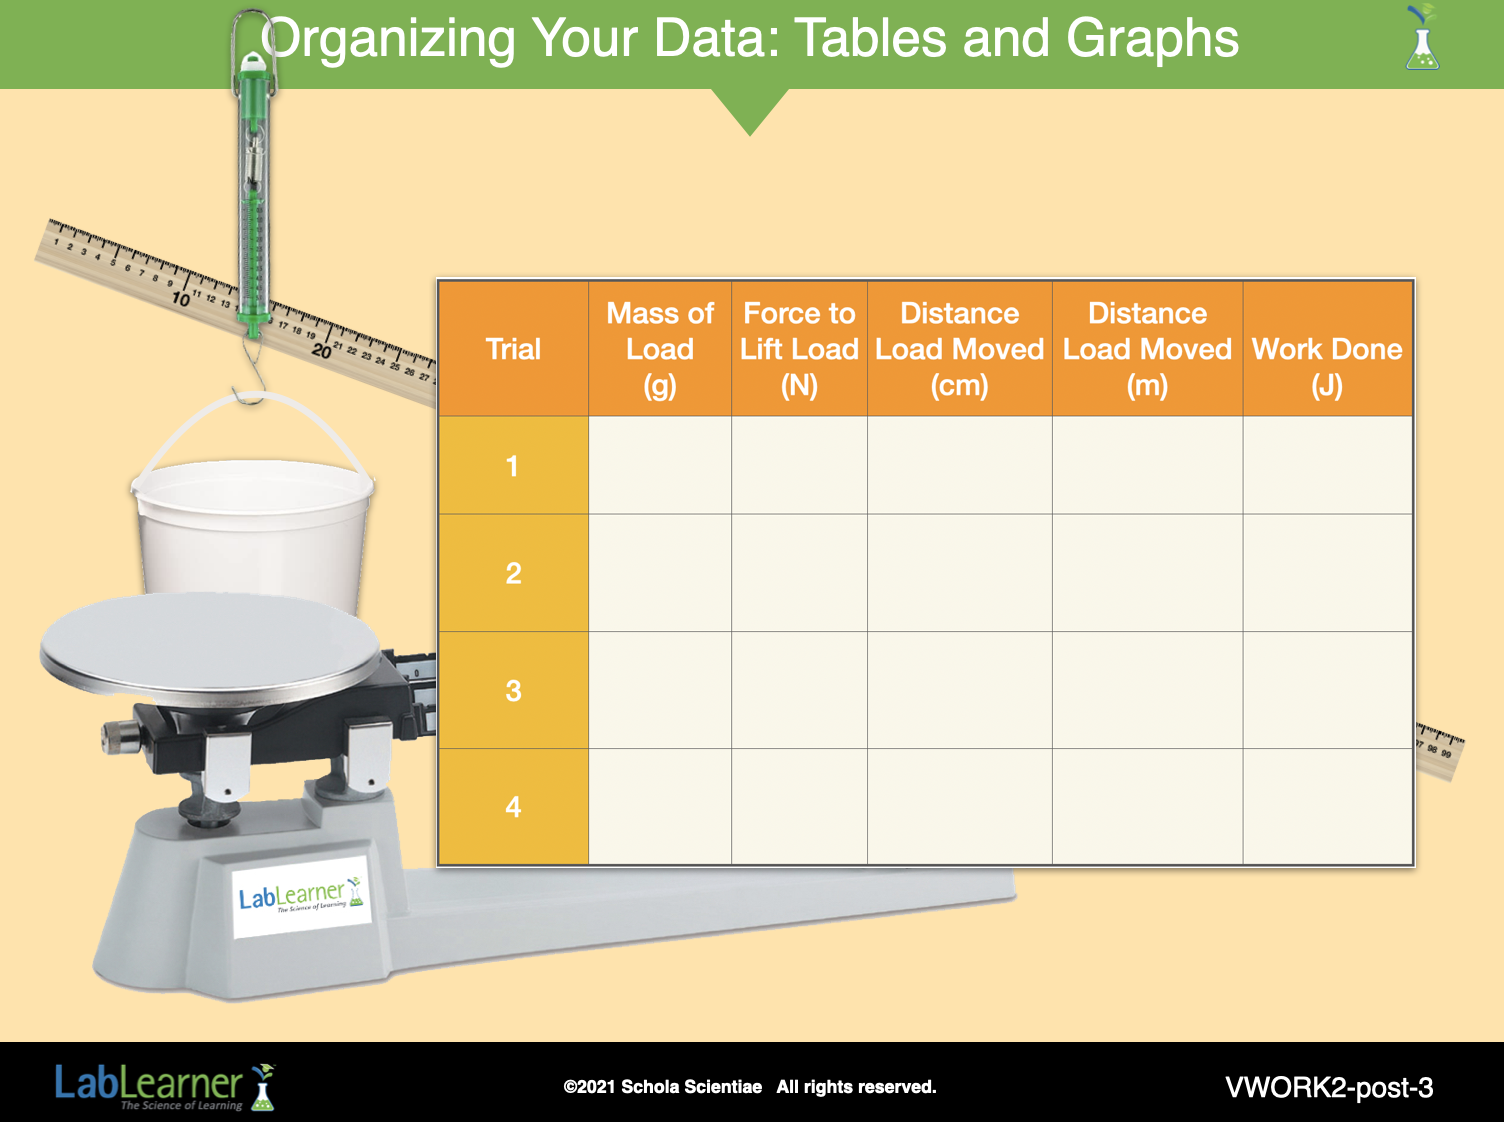
SLIDE VWORK2-post-3
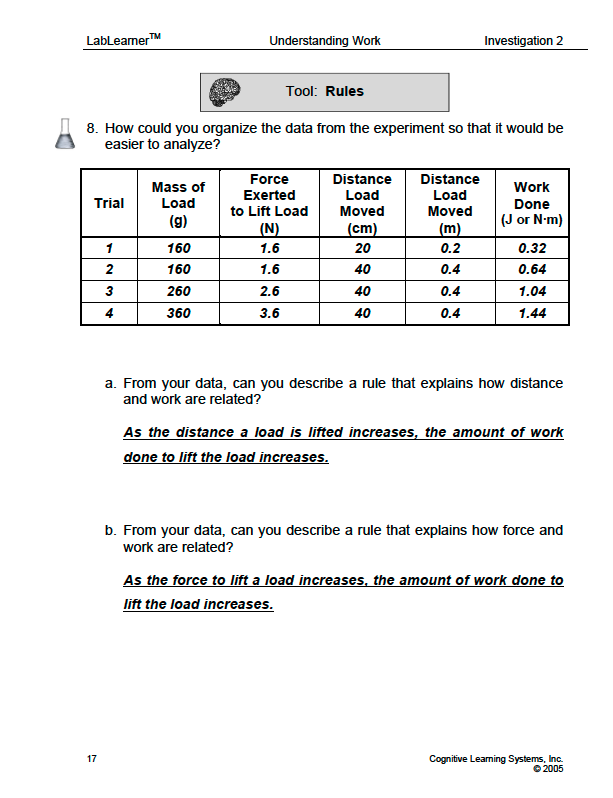
Organize the data into a table:
- Work with students to develop a table that will organize their data.
- Select the data collected by one group and enter it into the table. If differences in data arise, point out to students that some variation in the amount of force they exerted to lift the load is normal.
- Ask students: Why was the distance the load was moved converted from centimeters into meters in the table? The distance was converted into meters because the calculation of work in units of joules requires that the distance a load is moved to be presented in meters.
- Direct students to enter their data for each trial into the Table provided in Problem 8 of their Student Data Record.
______________________________________________
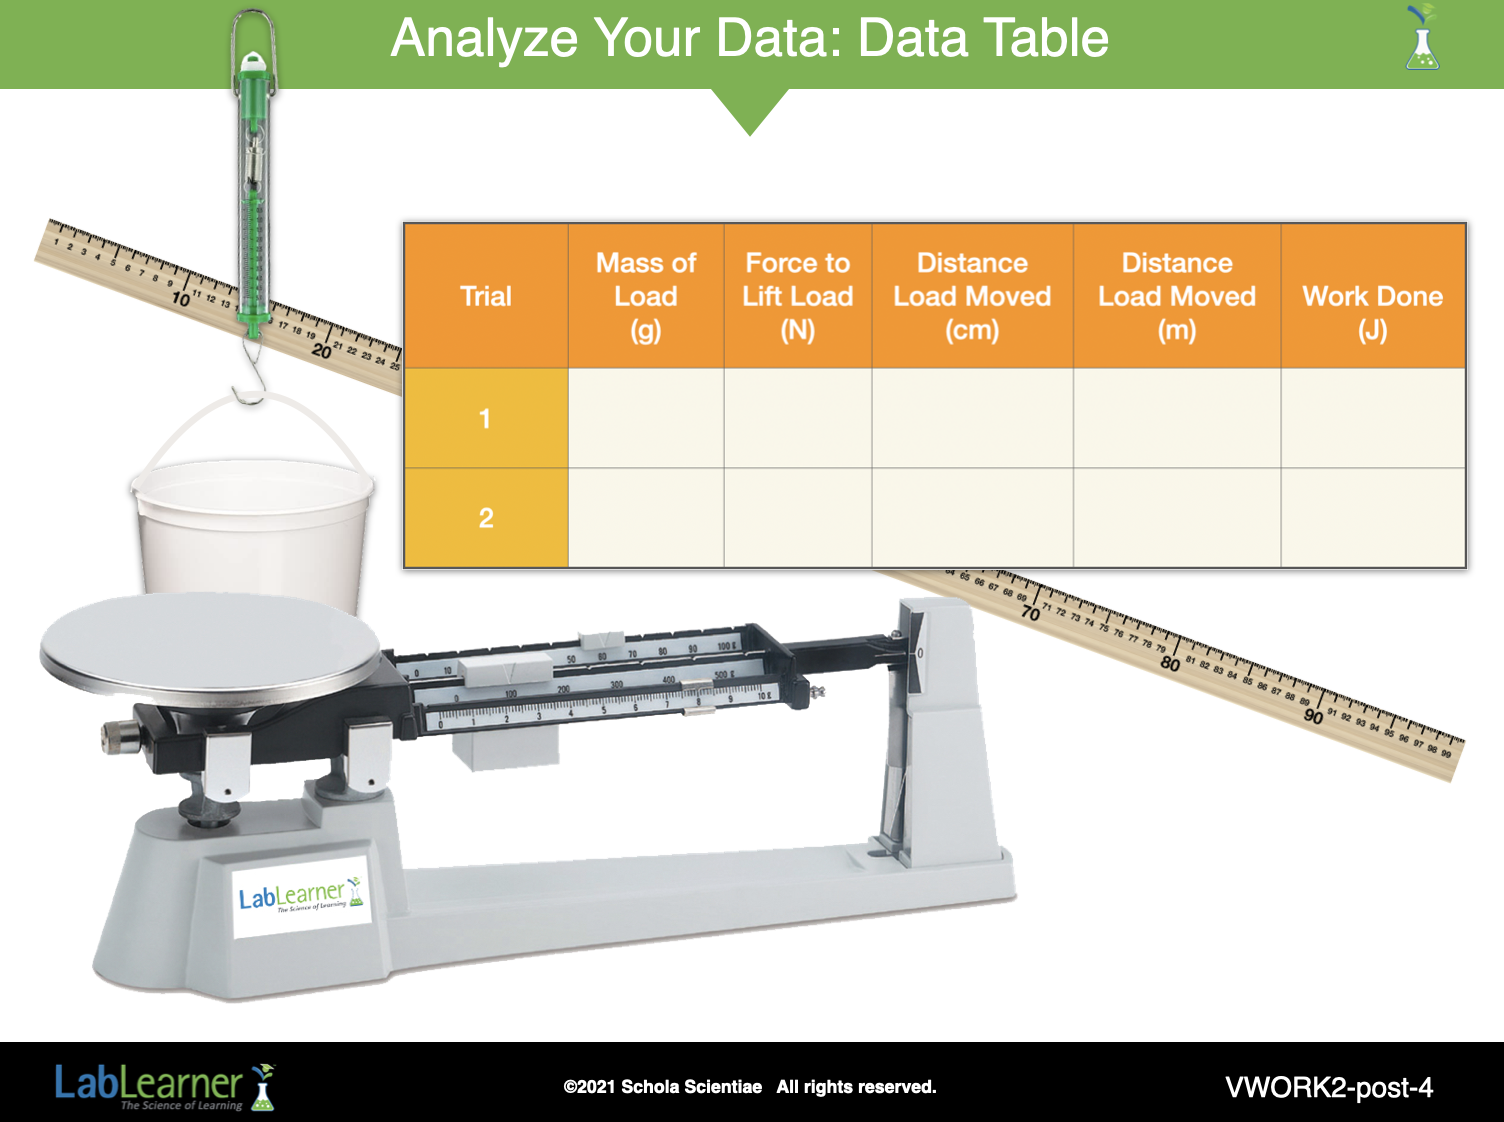
SLIDE VWORK2-post-4
Provide time for student groups to review the organization of the Table and the data.
1. Ask student groups to discuss and answer the following questions.
• What are some differences between the trials?
• What are some similarities between the trials?
2. After several minutes, ask for student groups to share their findings.
3. Some students may experience some difficulty in directing their focus. Help students review what they should look for when analyzing the table. When thinking about work, students should look for the amount of work done in each Trial. Force and distance are two variables that affect work. Therefore, students should also look for similarities or differences in force and distance between Trials.
What are some differences between the trials? The work done during each trial was different. The distance the load was lifted was different in Trial 1 as compared to Trials 2, 3, and 4. The mass of the load differed between Trials 3 and 4 and Trials 1 and 2.
What are some similarities between the Trials? The distance the loads were lifted in Trials 2, 3, and 4 was the same.
4. Ask students to think about how they could use the similarities and differences they found to explain the differences in the work done in each Trial. Begin by encouraging student understanding of the relationship between distance and work. Utilize the questions and steps that follow to promote student discussion.
a. Look at the Table in Problem 8 of your Student Data Record. Find Trials 1 and 2.
-
-
- Is there a difference in the force between the trials? No
- Is there a difference in the distance between the two trials? Yes
-
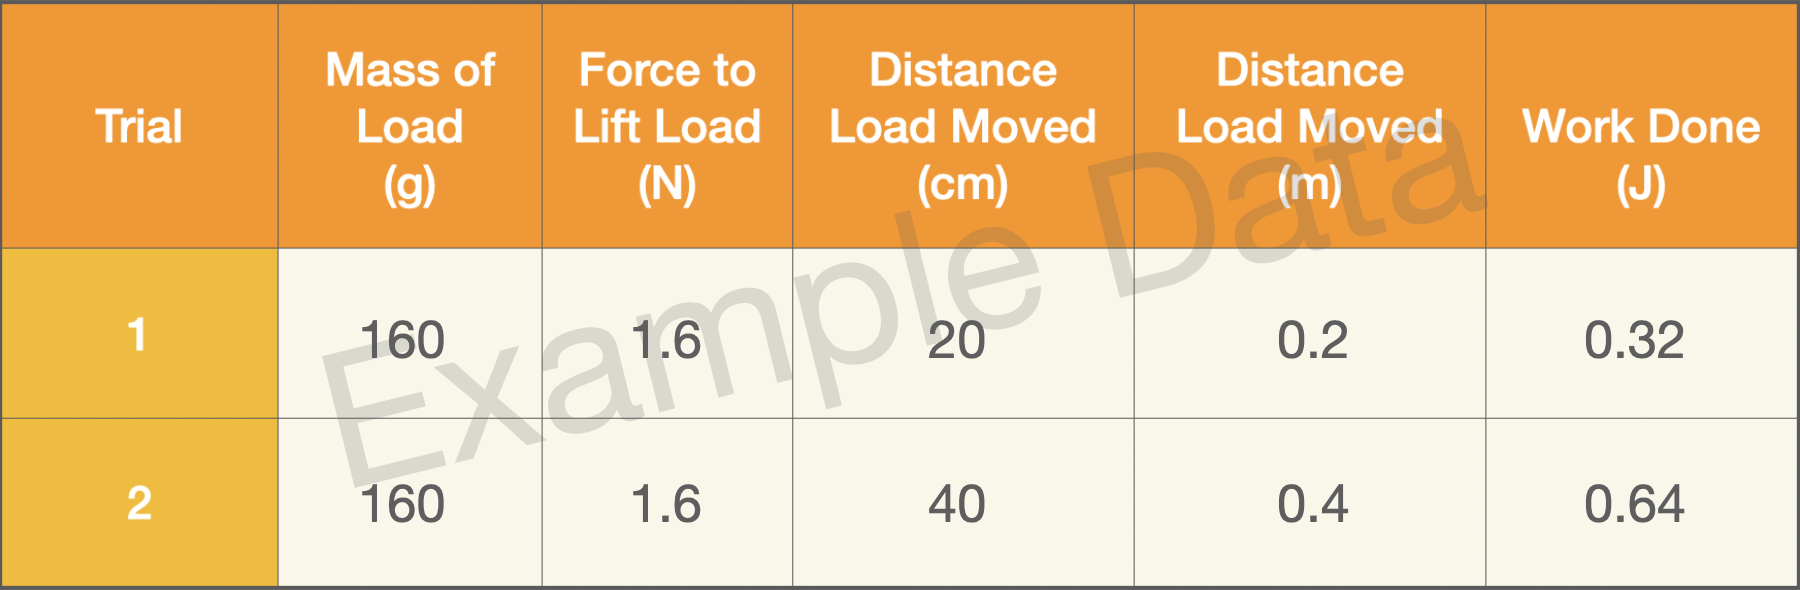
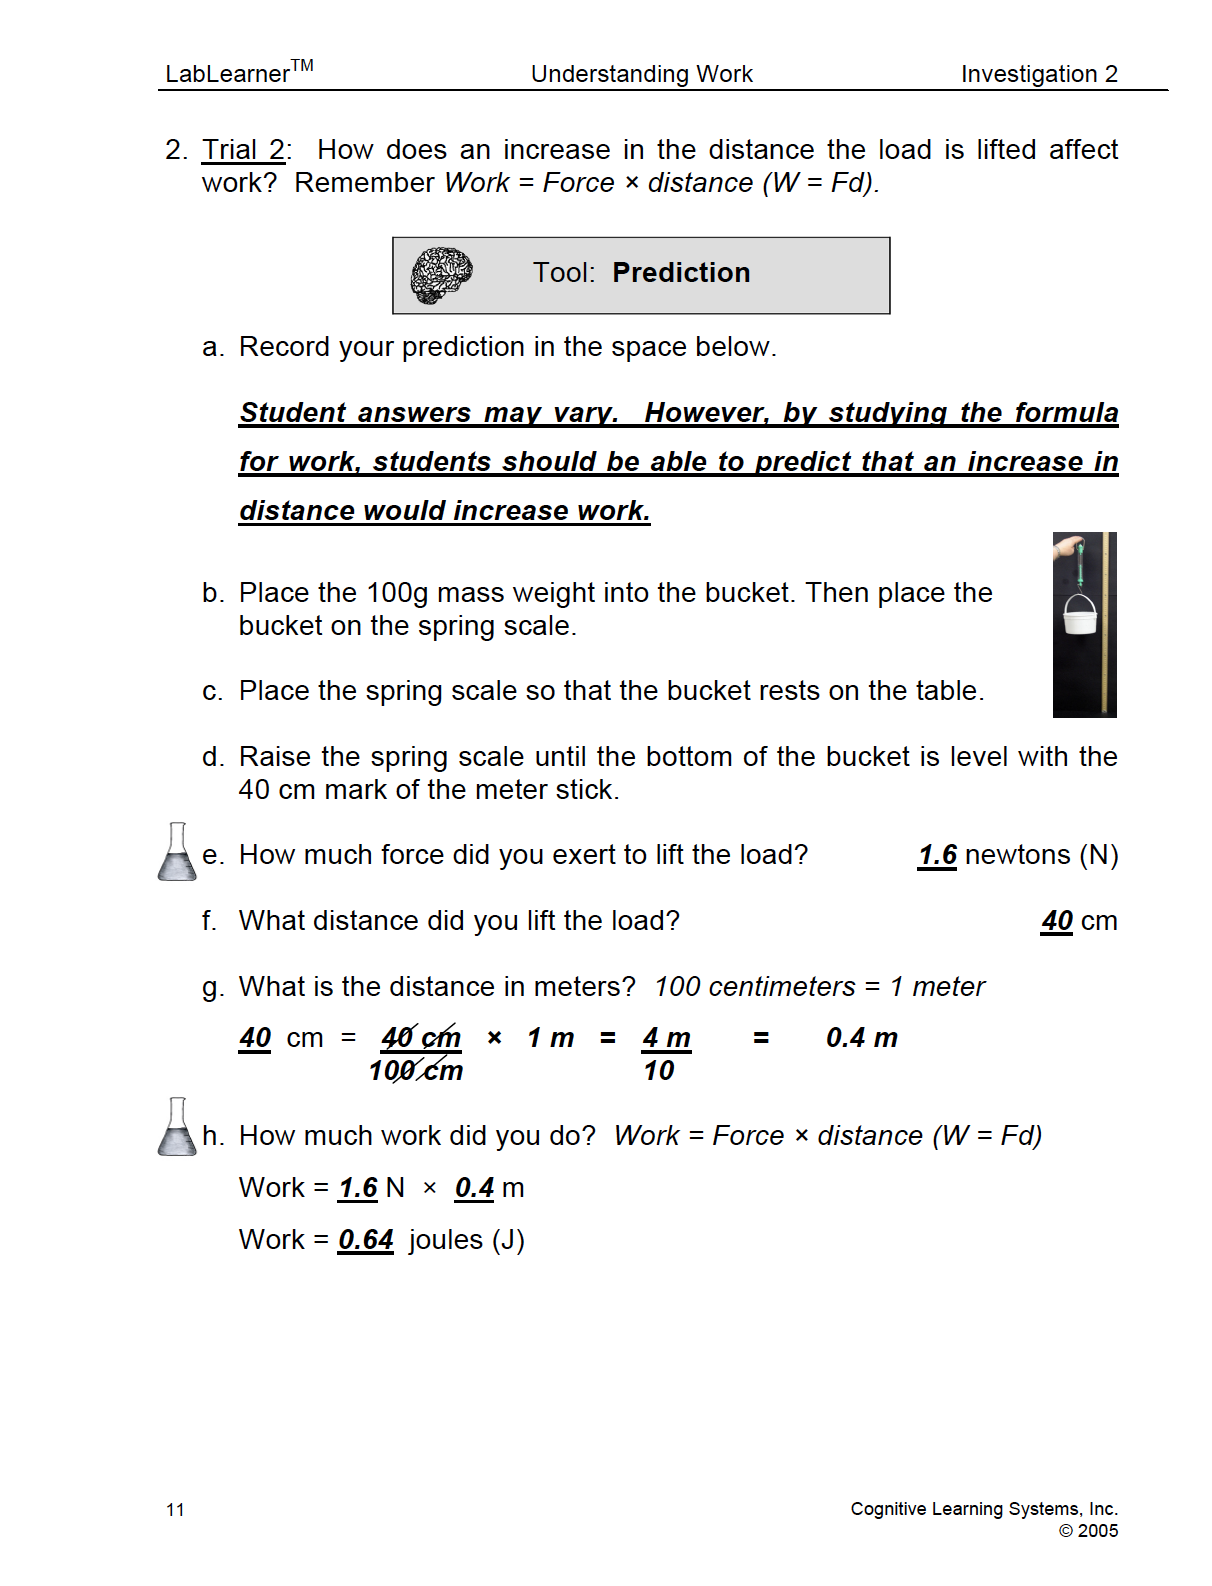
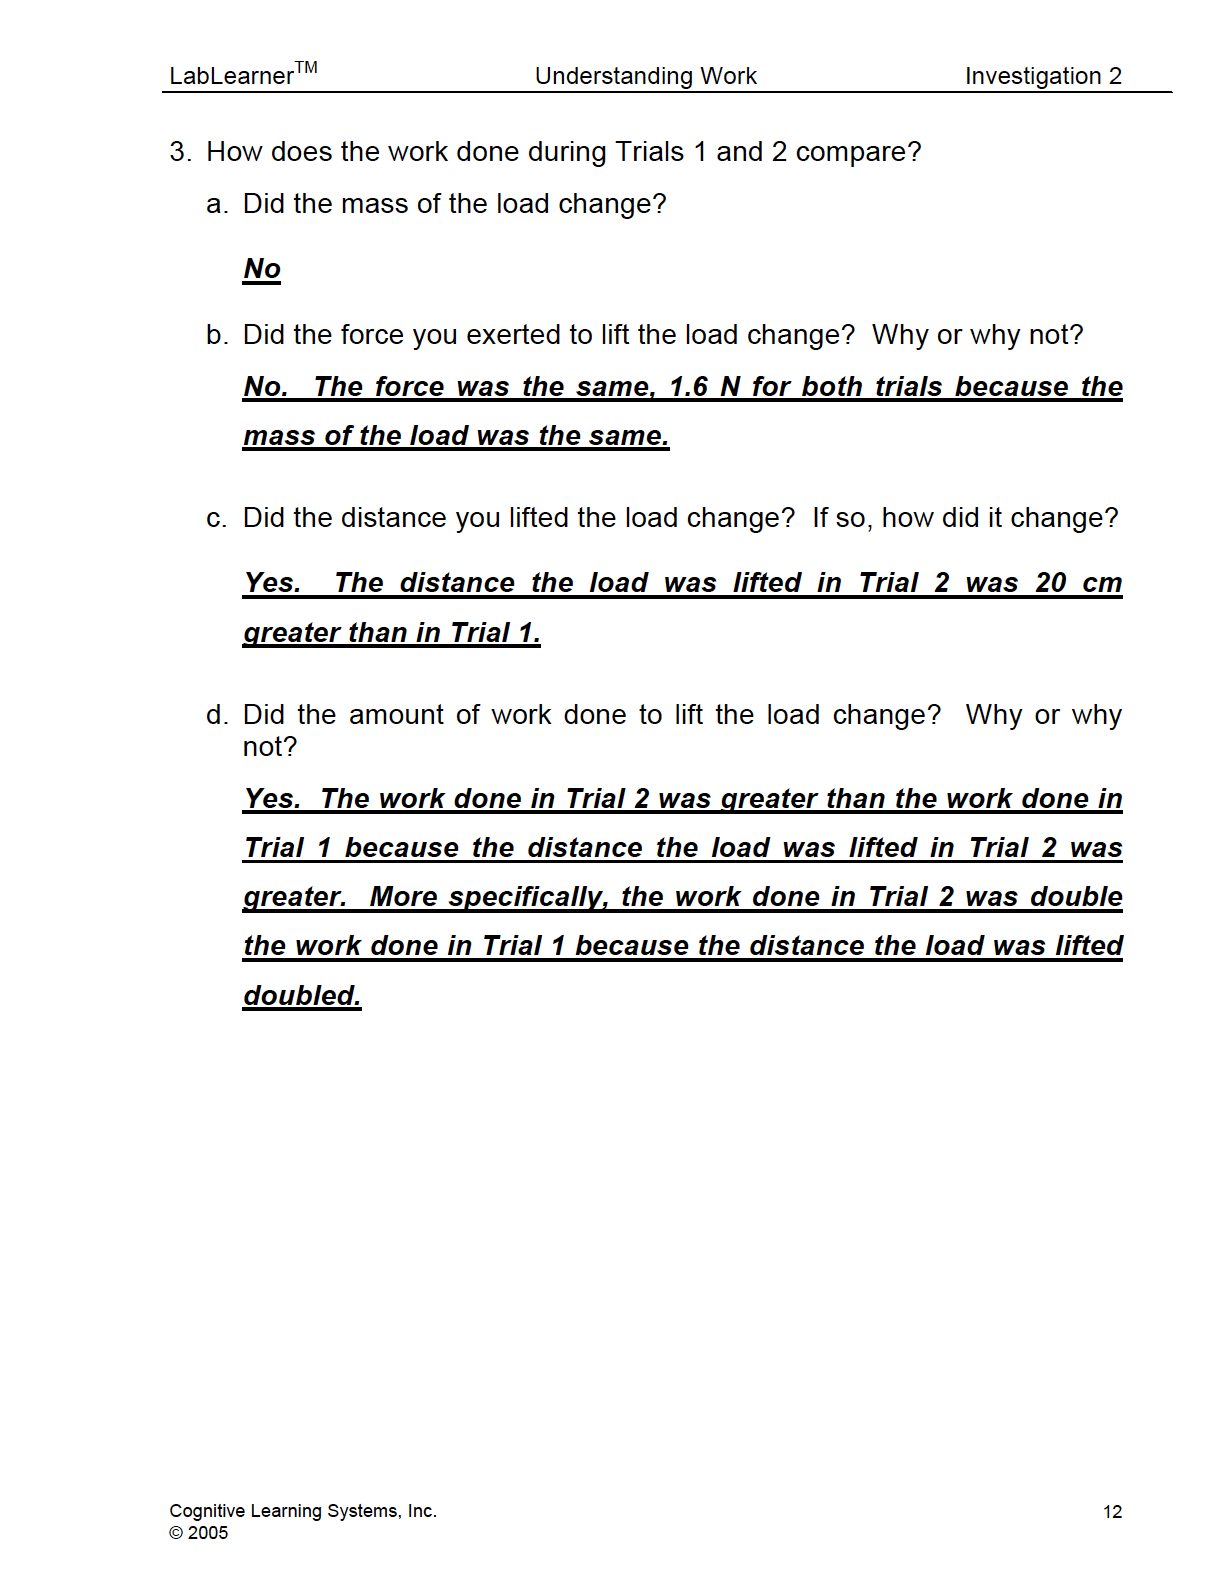
b. Did changing the distance the load was moved, or lifted, have an affect on the amount of work done? Yes. When the 160 g load in Trial 1 was lifted 0.2 m, the amount of work done was 0.32 J. When the same load in Trial 2 was lifted 0.4 m, the amount of work done was 0.64 J.
c. Was the increase in work proportional to the increase in the distance the load was lifted? Yes. In these trials, the mass of the load was the same – 160 g – and the force on the load (1.6 N) was the same. But when the distance the load was lifted increased, the amount of work done to lift the load increased proportionally. The distance the load was lifted in Trial 2 was two times that of Trial 1, and the work done to lift the load in Trial 2 was two times that done in Trial 1.
______________________________________________
SLIDE VWORK2-post-5
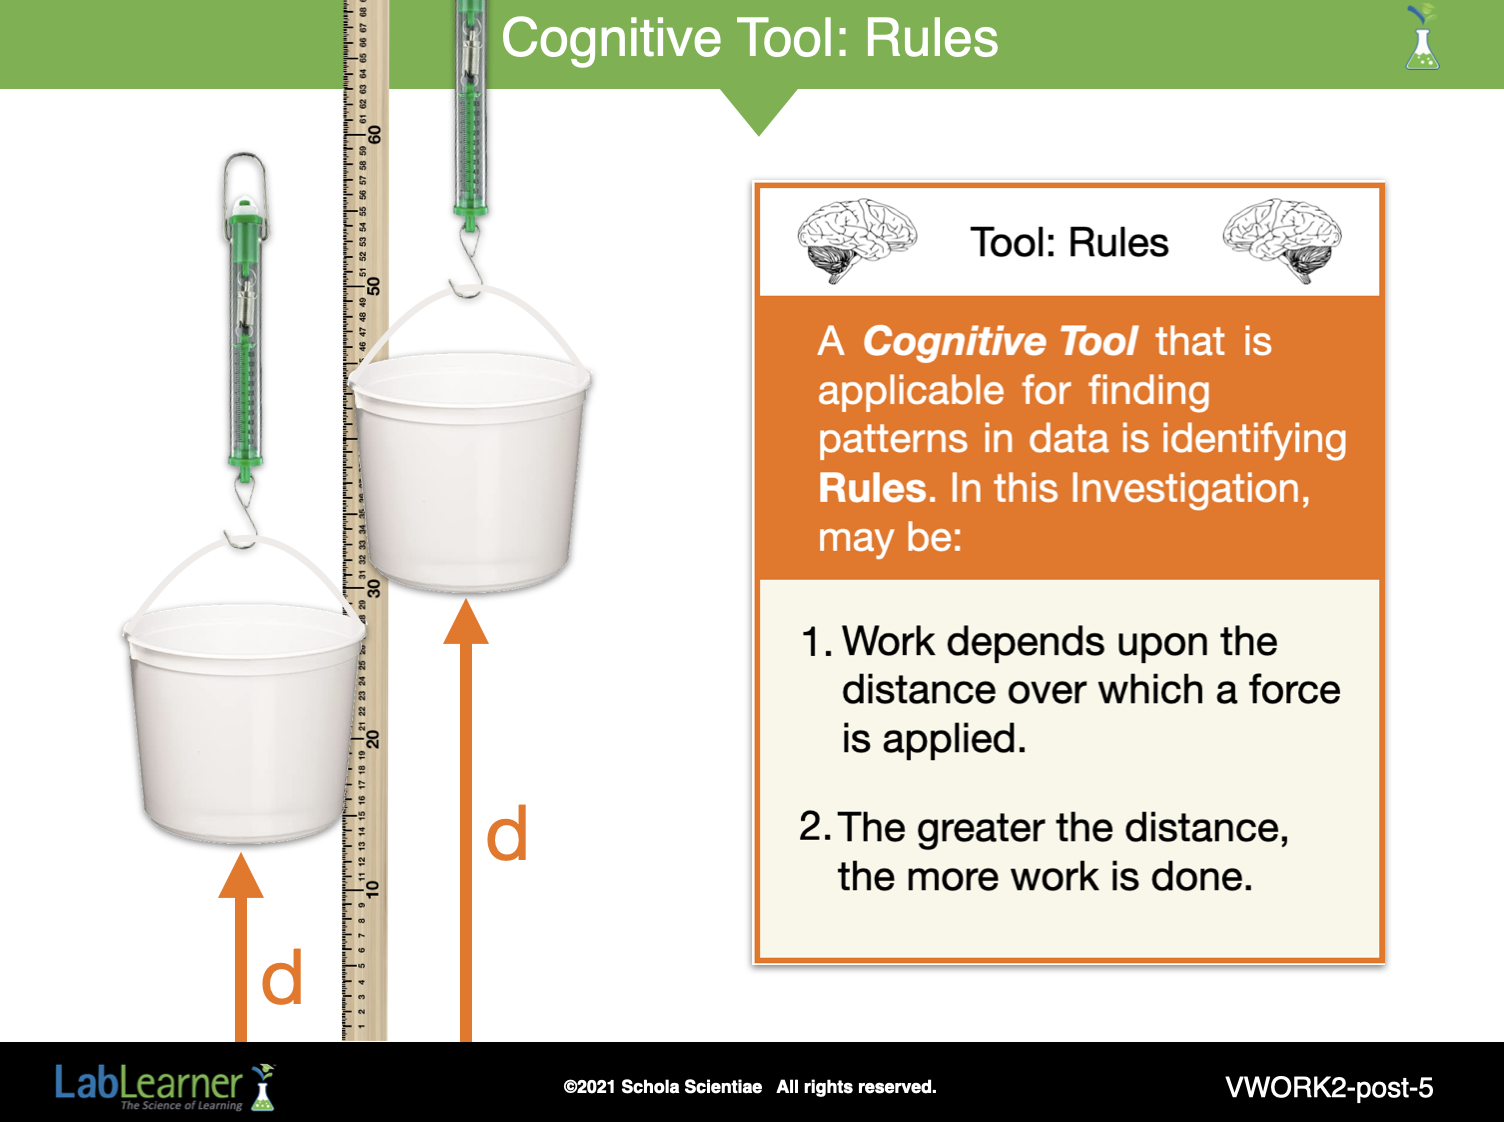
Ask students: Can you think of a Rule or a way to describe the relationship between distance and work? Student answers will vary. By reviewing both the formula for work and their data, students should suggest that work depends upon the distance over which a force is applied. The greater the distance, the more work is done. Students can record the conclusion about the rule in Problems 8a and b of their Student Data Record.
______________________________________________
SLIDE VWORK2-post-6
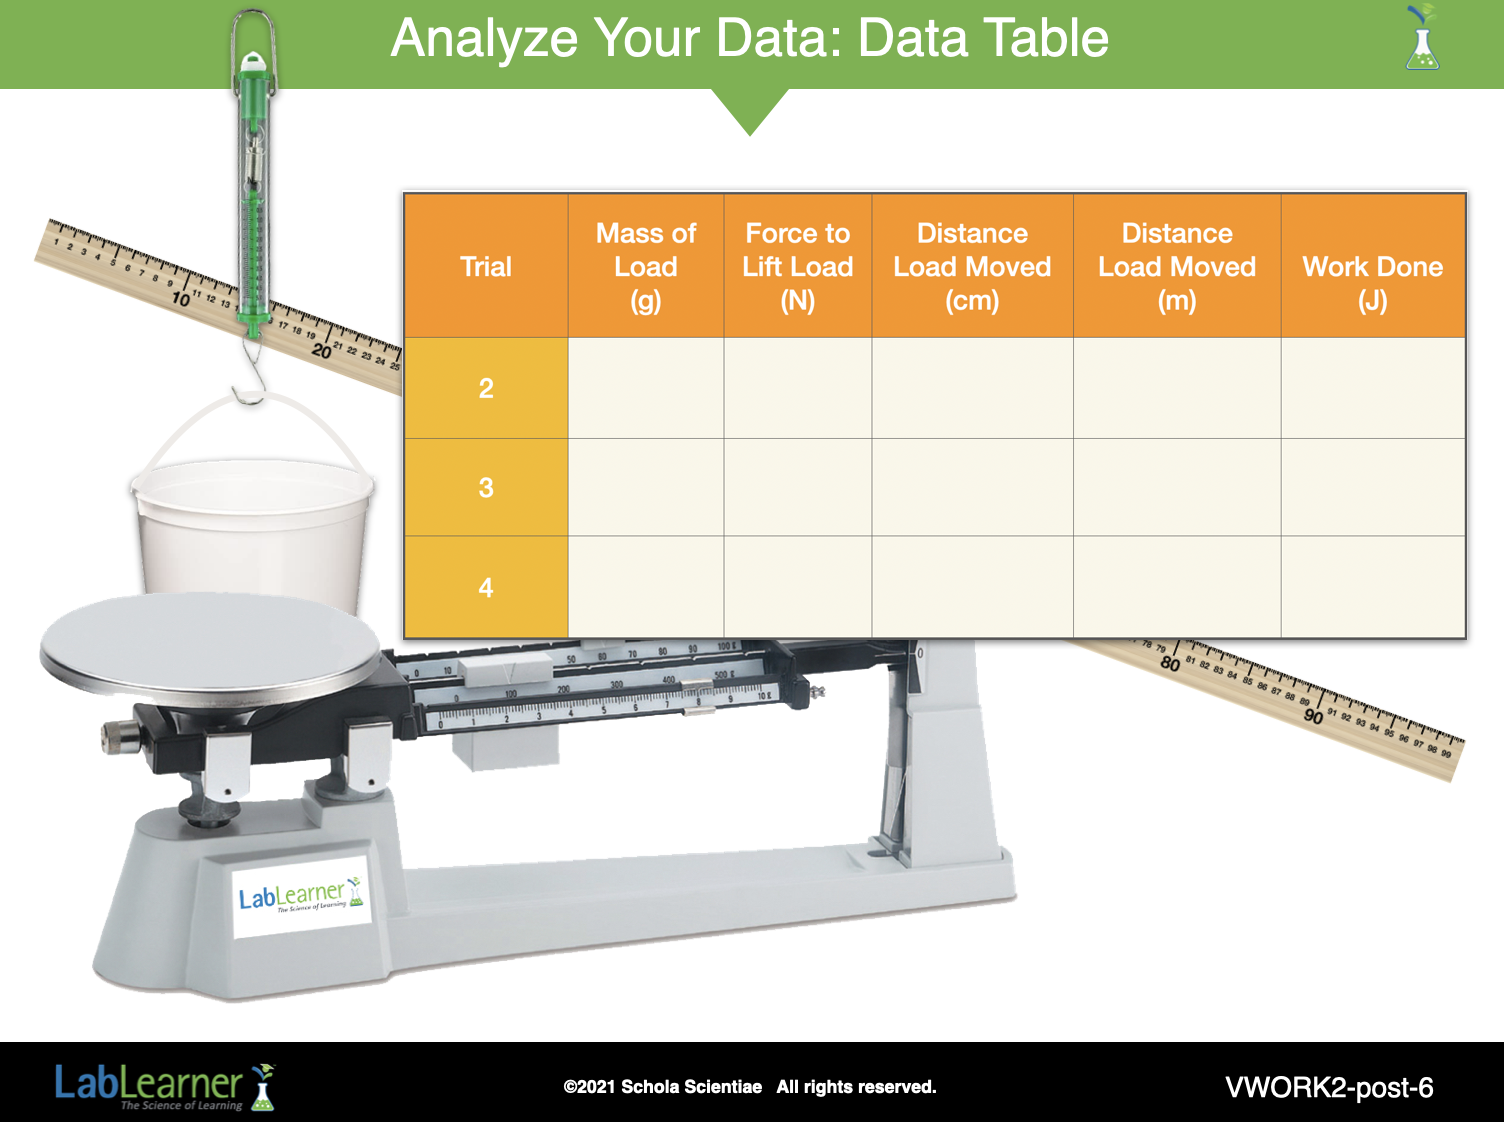
Continue the analysis of the experiments. Encourage student understanding of the relationship between mass, force, and work by utilizing the questions and steps that follow.
Direct students’ attention to Trials 2, 3, and 4 in the Table.
- Provide time for each group to identify the similarities and differences between each trial.
- Tell students to place a circle around the variables that are different between Trials 2, 3, and 4.
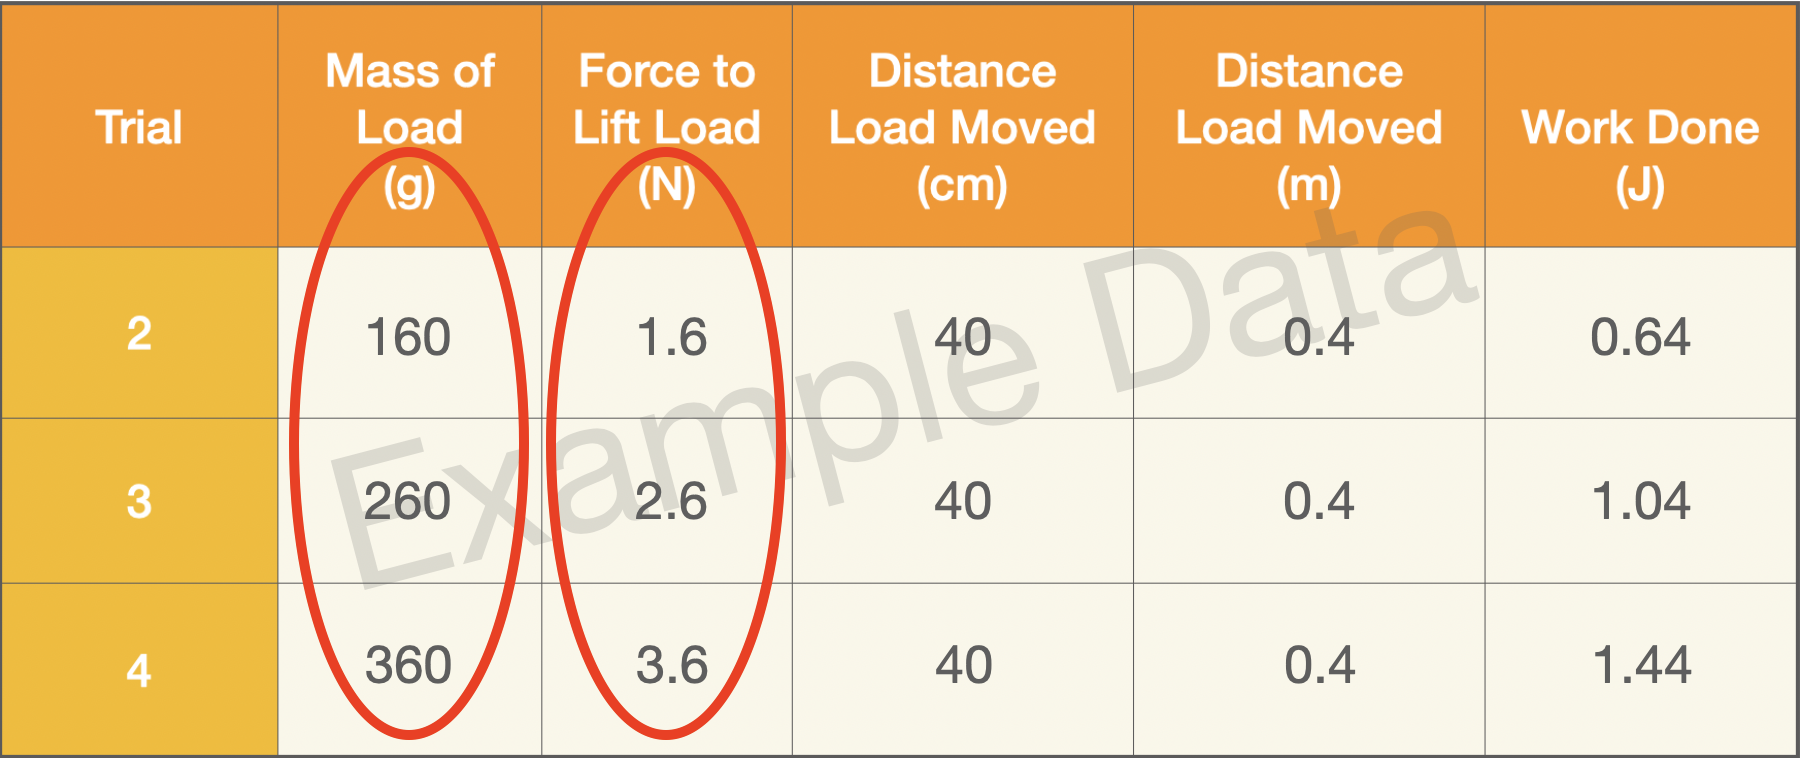
- After sufficient time, ask student groups to share their observations.
Ask Students: Did changing the mass of the load make a difference in the amount of
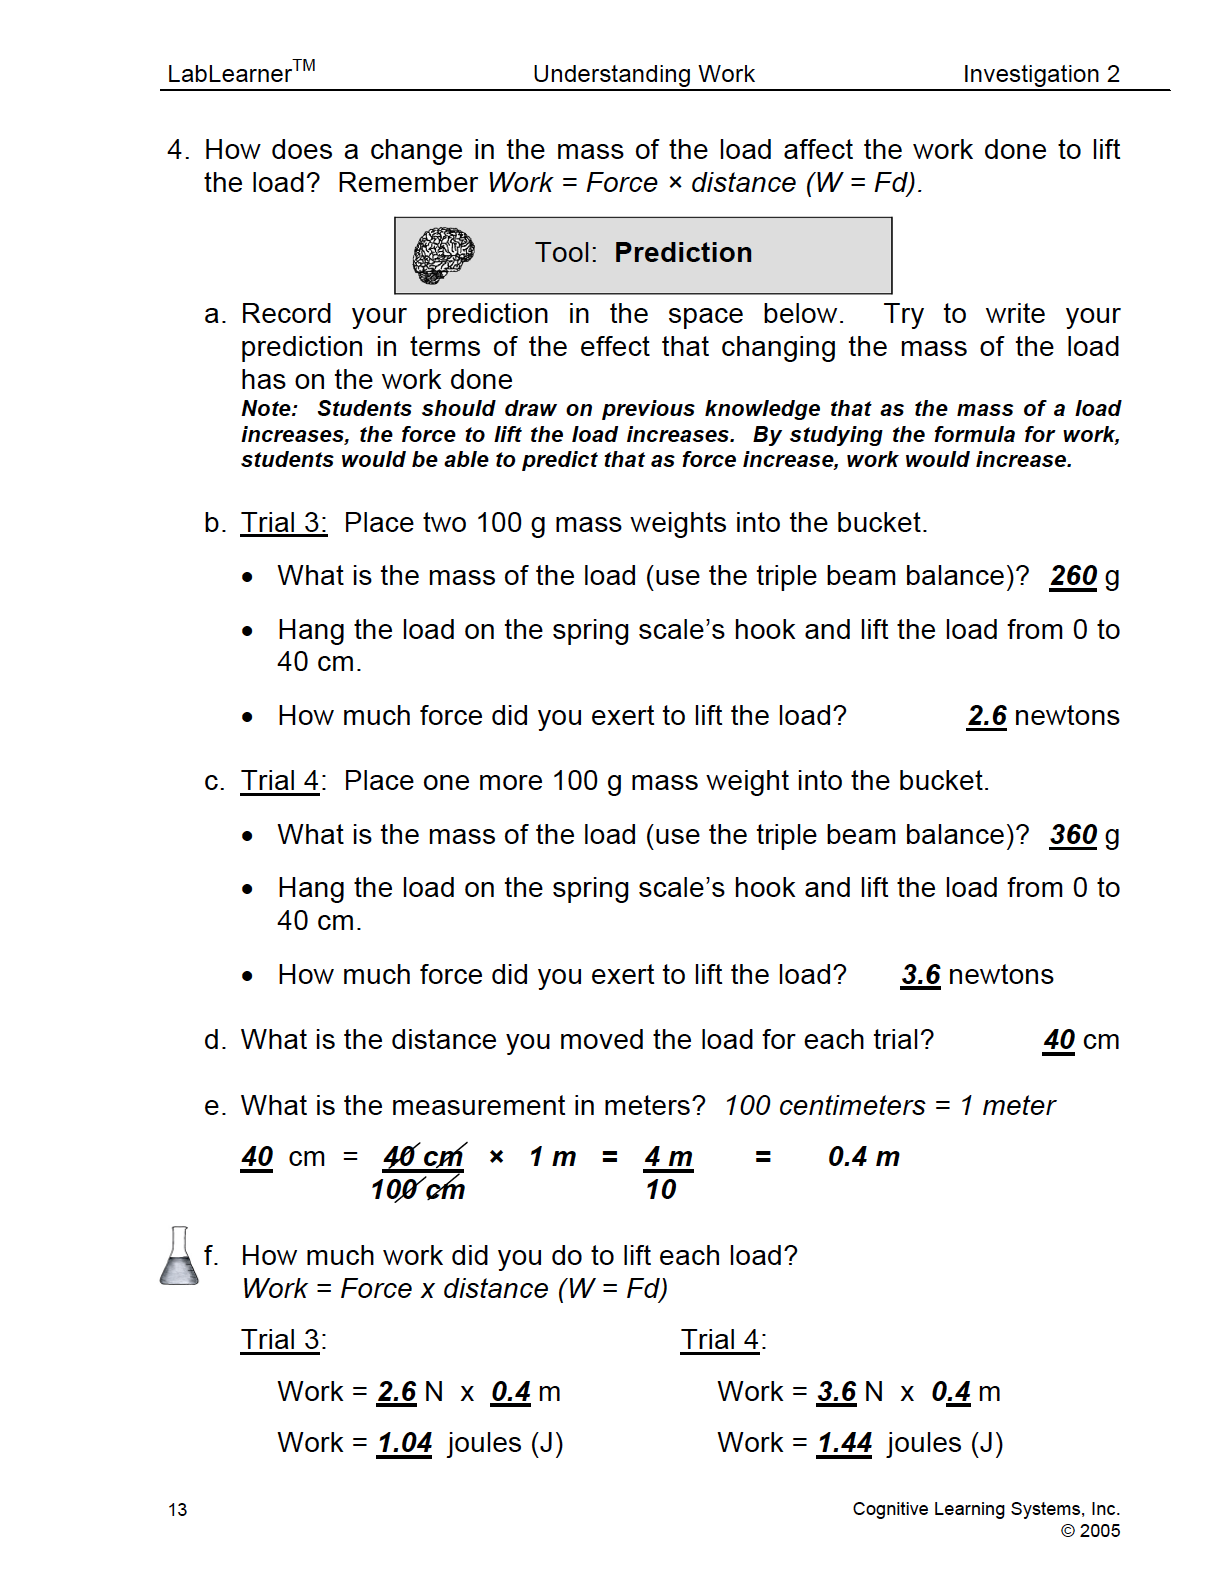
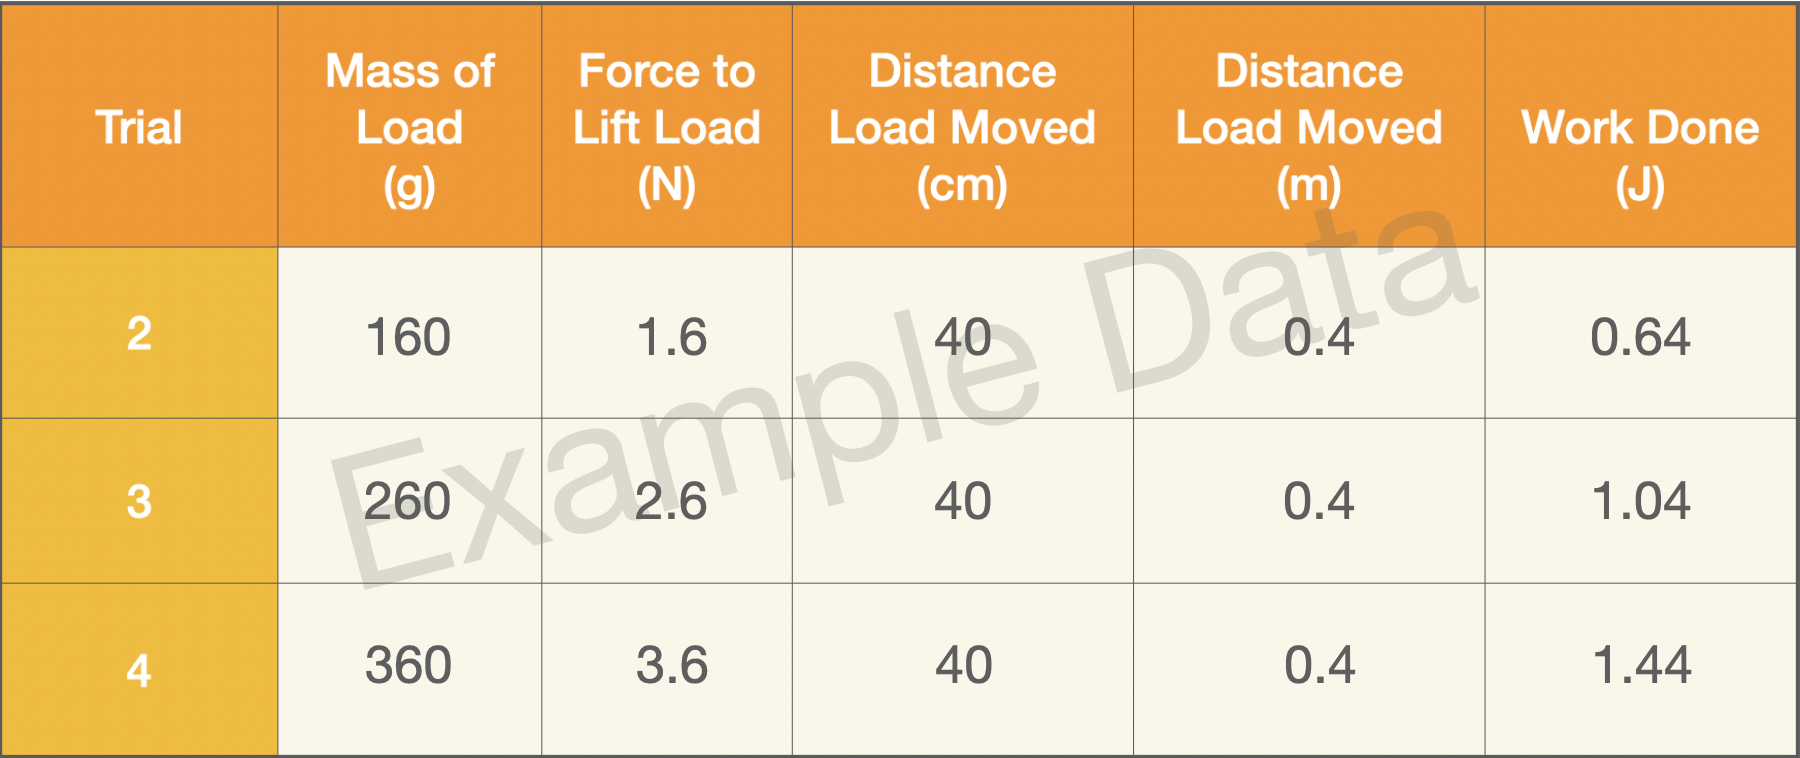
work done to lift the load? Why? Yes. As the mass of a load increased, the amount of force exerted on the load increased. As the force exerted on the load increased, so did the work.
Ask Students: Was the increase in work proportional to the increase in force? Yes. Compare the data in Trials 2, 3, and 4. In these trials, the distance the load was lifted remained the same – 40 cm. But when the force exerted on the load increased, the amount of work done increased proportionately.
Ask Students: Can you think of a way to describe how force and work are related? As the force exerted on a load increases, work increases. Students can record their conclusion in question 8b of their Student Data Record.
______________________________________________
SLIDE VWORK2-post-7
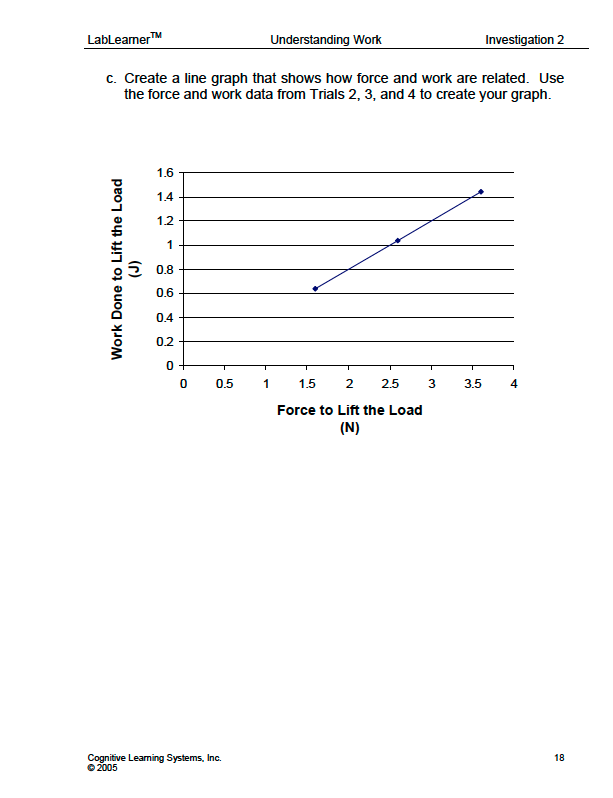
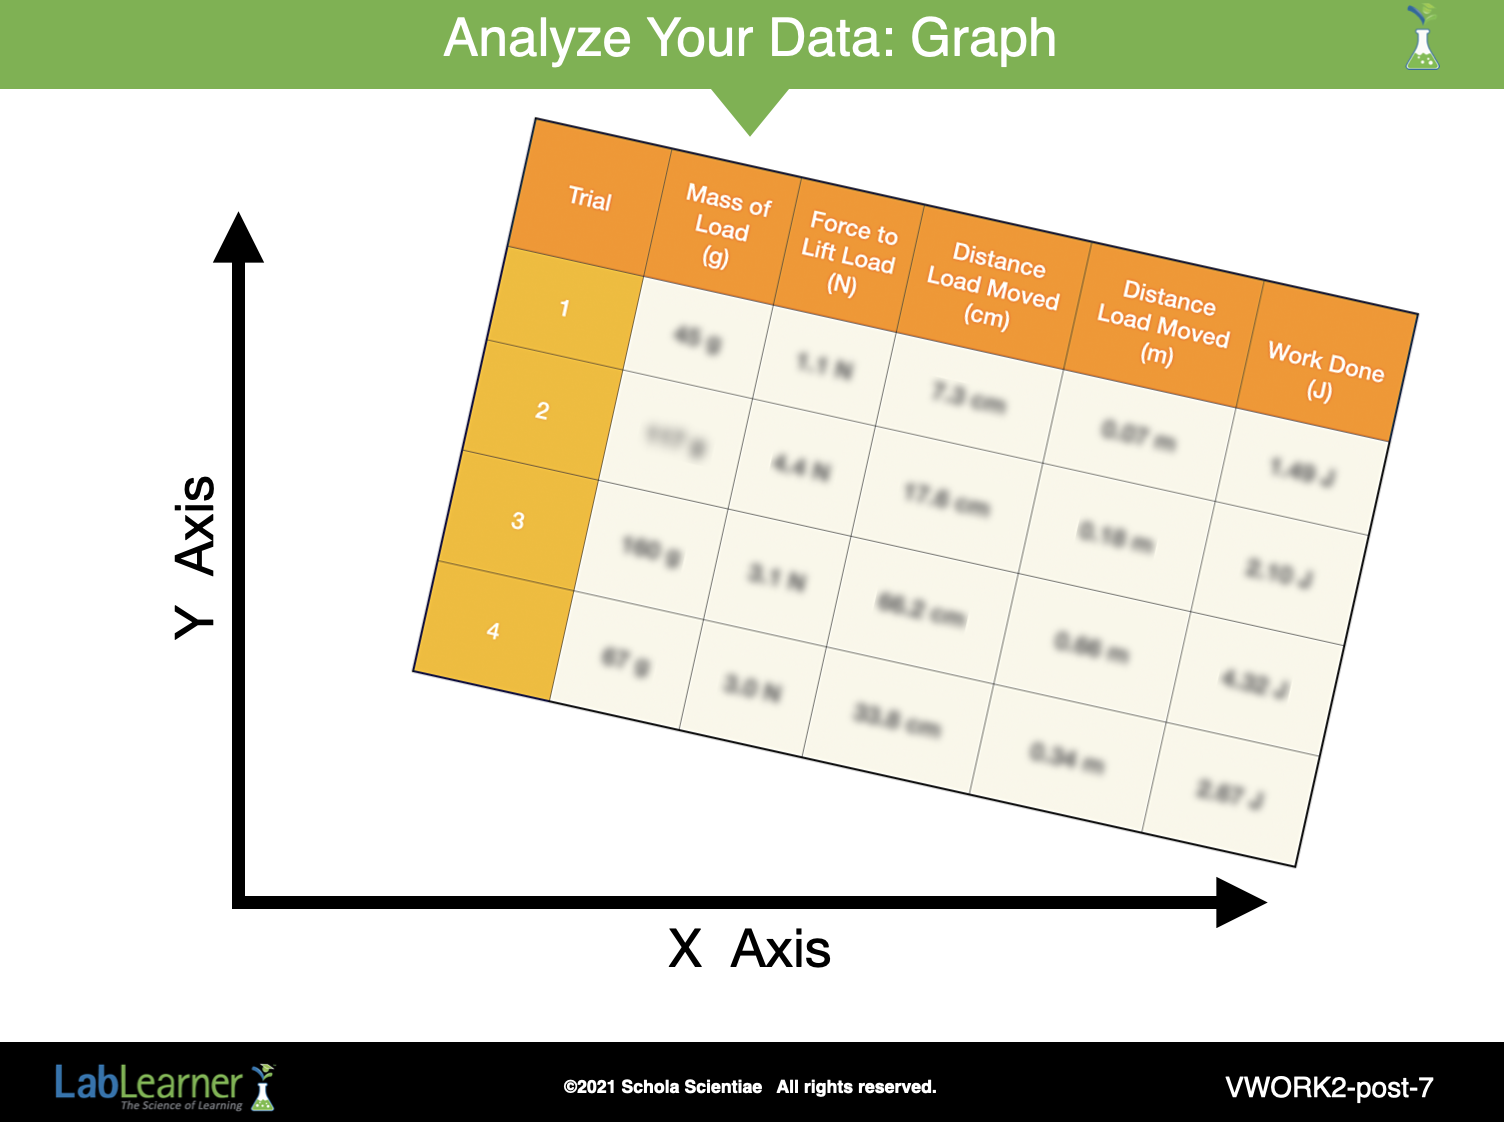
Ask Students: Can you think of another way to illustrate the relationship between force and work? Guide students to the idea that a graph could be used to show the relationship between force on the load and work.
- Work with students to model how to create a line graph using the force and work data from Trials 2, 3, and 4.
- You may find it helpful to review the steps from the Procedural Toolbox with students.
Draw an x-axis and a y-axis.
______________________________________________
SLIDE VWORK2-post-8
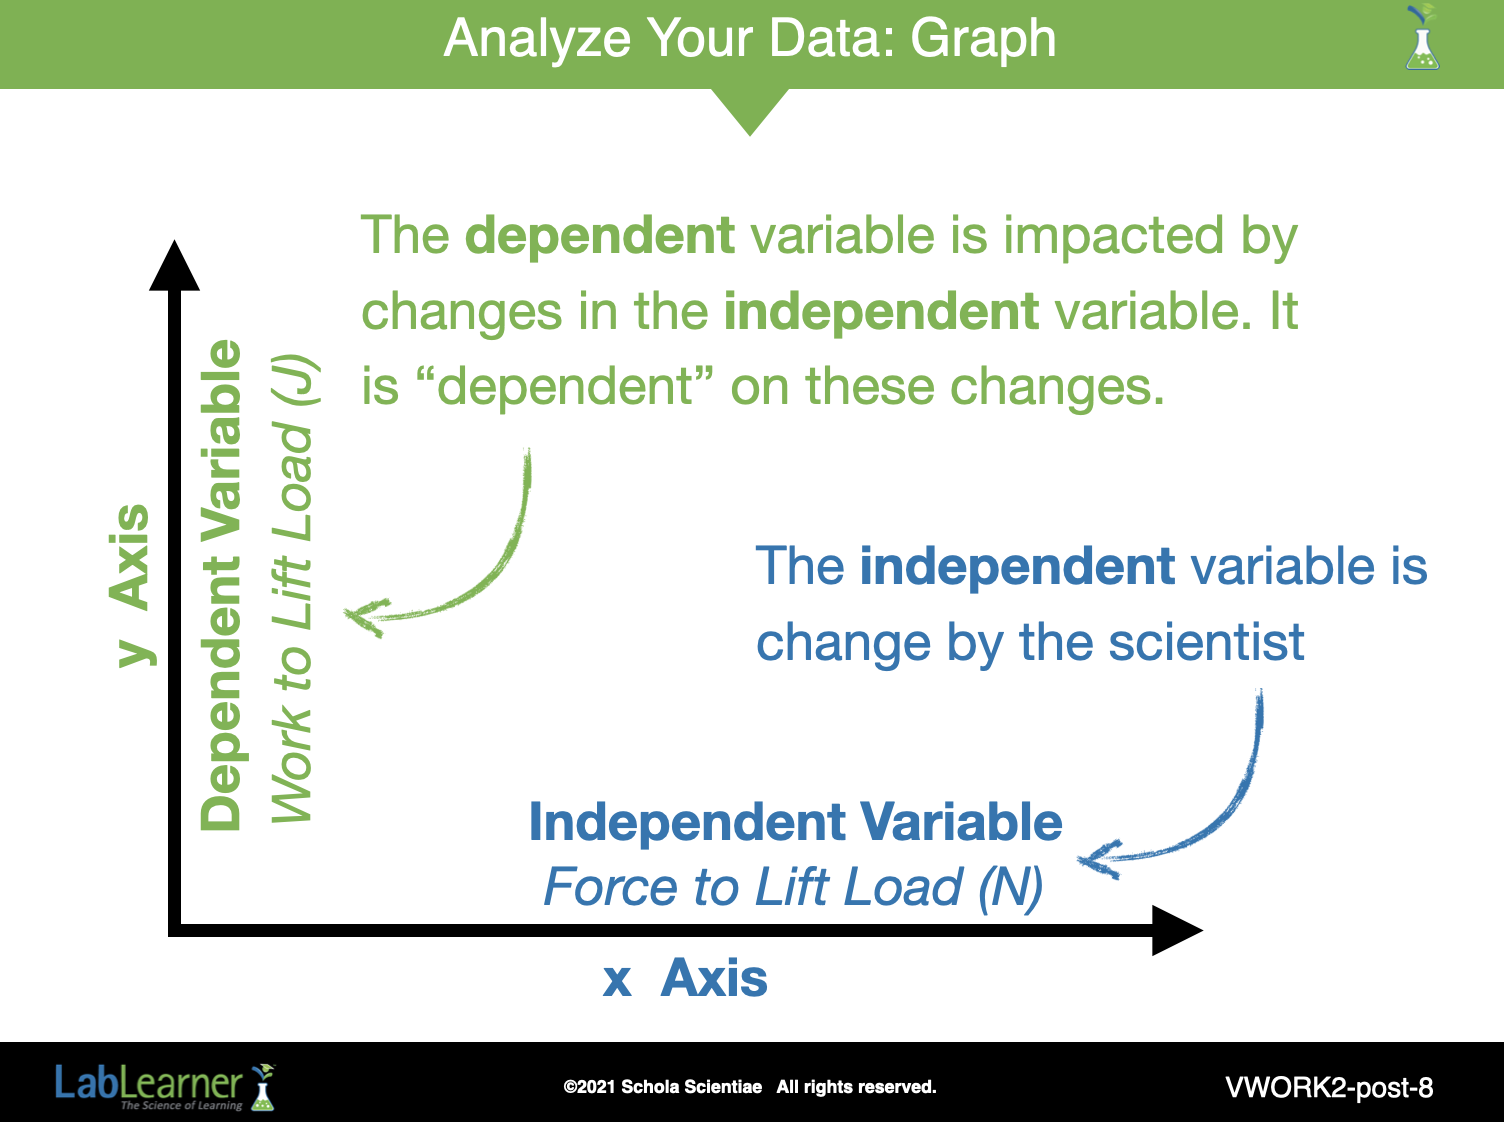
Determine which variable you will plot along the x-axis and which variable you will plot along the y-axis.
In experiments, there is a variable changed or controlled by the person doing the experiment. There is also a variable whose impact is observed or measured by the person doing the experiment.
Typically, scientists place the variable they control (the independent variable) on the x-axis. Guide students to understand that in this Investigation, the variable they controlled was the force when lifting the load. They controlled this by changing the mass that was lifted.
Typically, scientists place the variable they observed or measured (the dependent variable) on the y-axis. Help students understand that the word “measure” in this circumstance means “observing the impact of” in addition to taking a measurement. Students may say they that measured the force in the lab. This would be true, but the questions they were to answer in the lab dealt with how changes in distance and mass affected the WORK done. They manipulated distance and mass (force) and OBSERVED the IMPACT on WORK. This graph illustrates whether there is a relationship between force and work. Students changed the FORCE and are looking for its impact on WORK.
______________________________________________
SLIDE VWORK2-post-9
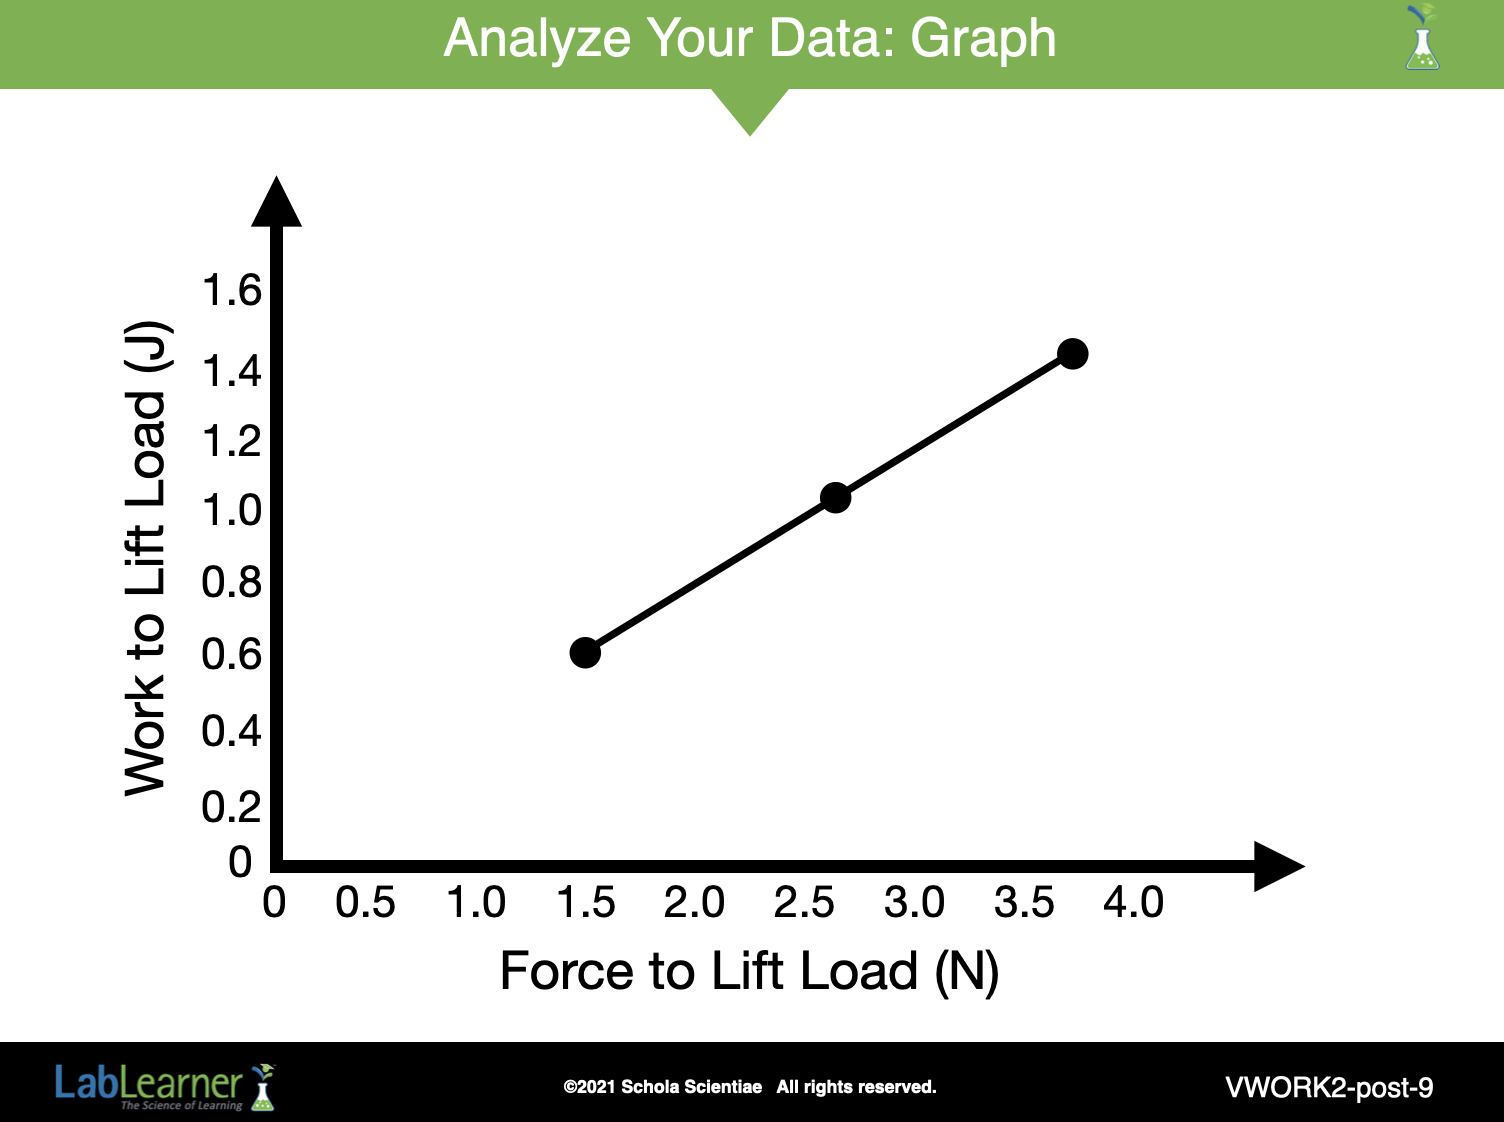
Label the axes accordingly. Force should be placed on the x-axis and work on the y-axis.
Determine the beginning and ending numbers you will plot on the x-axis and y-axis. The beginning and ending numbers should be selected so that you can plot all of your points on the graph.
Determine the scale for each axis. A scale is the difference between numbers. For example, you may wish to include all numbers between your beginning and ending numbers. You could also create a scale that only uses some numbers that are multiples of each other.
- Graph the data and connect the points with a line.
When students have finished their line graphs, ask a student volunteer to draw his or her graph on the board. An example of a line graph is shown in this slide. Discuss the completed graph with the class.
- Look at the x-axis on the graph. Begin on the left side: Ask Students: What happens to the units of force as you move from left to right? The units increase in magnitude.
- Look at the y-axis on the graph. Begin at the bottom: Ask Students: What happens to the units of work as you move from the bottom to the top of the graph? The units increase in magnitude.
- For each measurement of force along the x-axis, you plotted a point along the y-axis that corresponded to the work done in the same trial. Look at the line that connects the points. Ask Students: Does it go up or down? It goes up.
• Ask Students: Can you describe what happened to the work done when loads required more force to lift? As the force exerted to lift the load increased, the work done to lift the load increased.
______________________________________________
SLIDE VWORK2-post-10
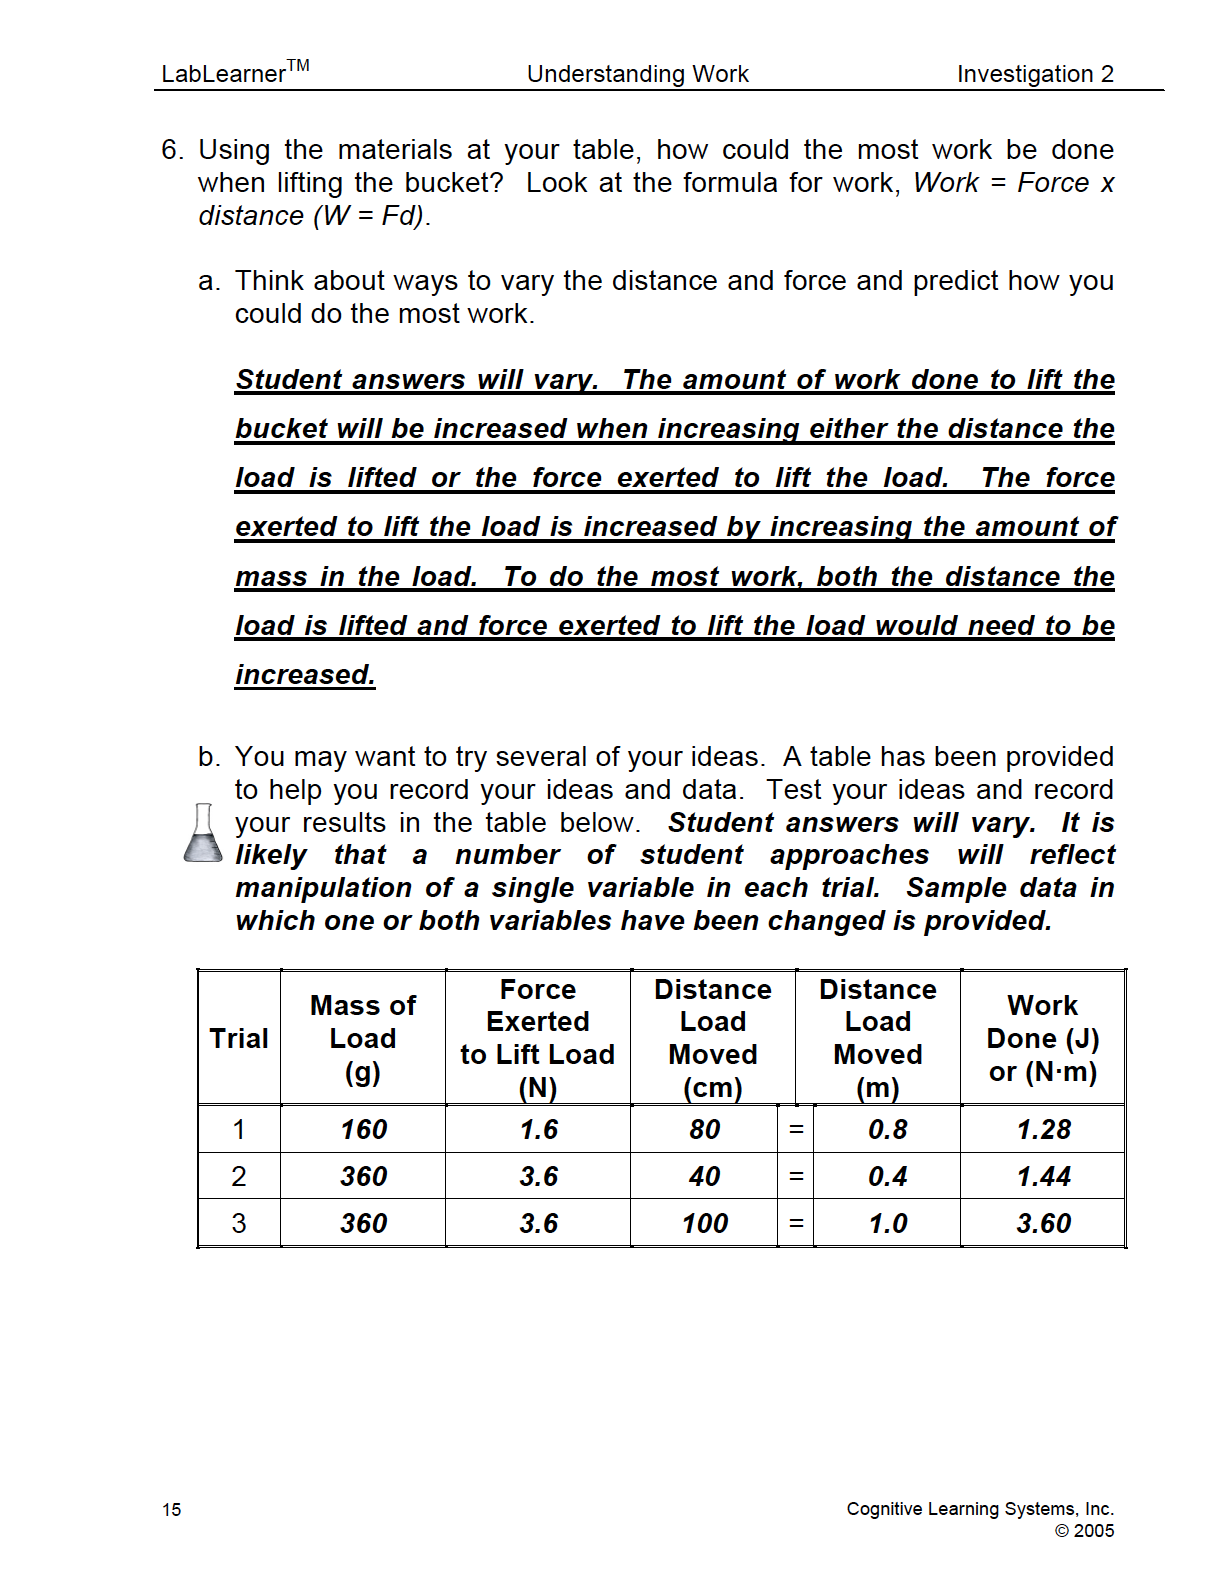
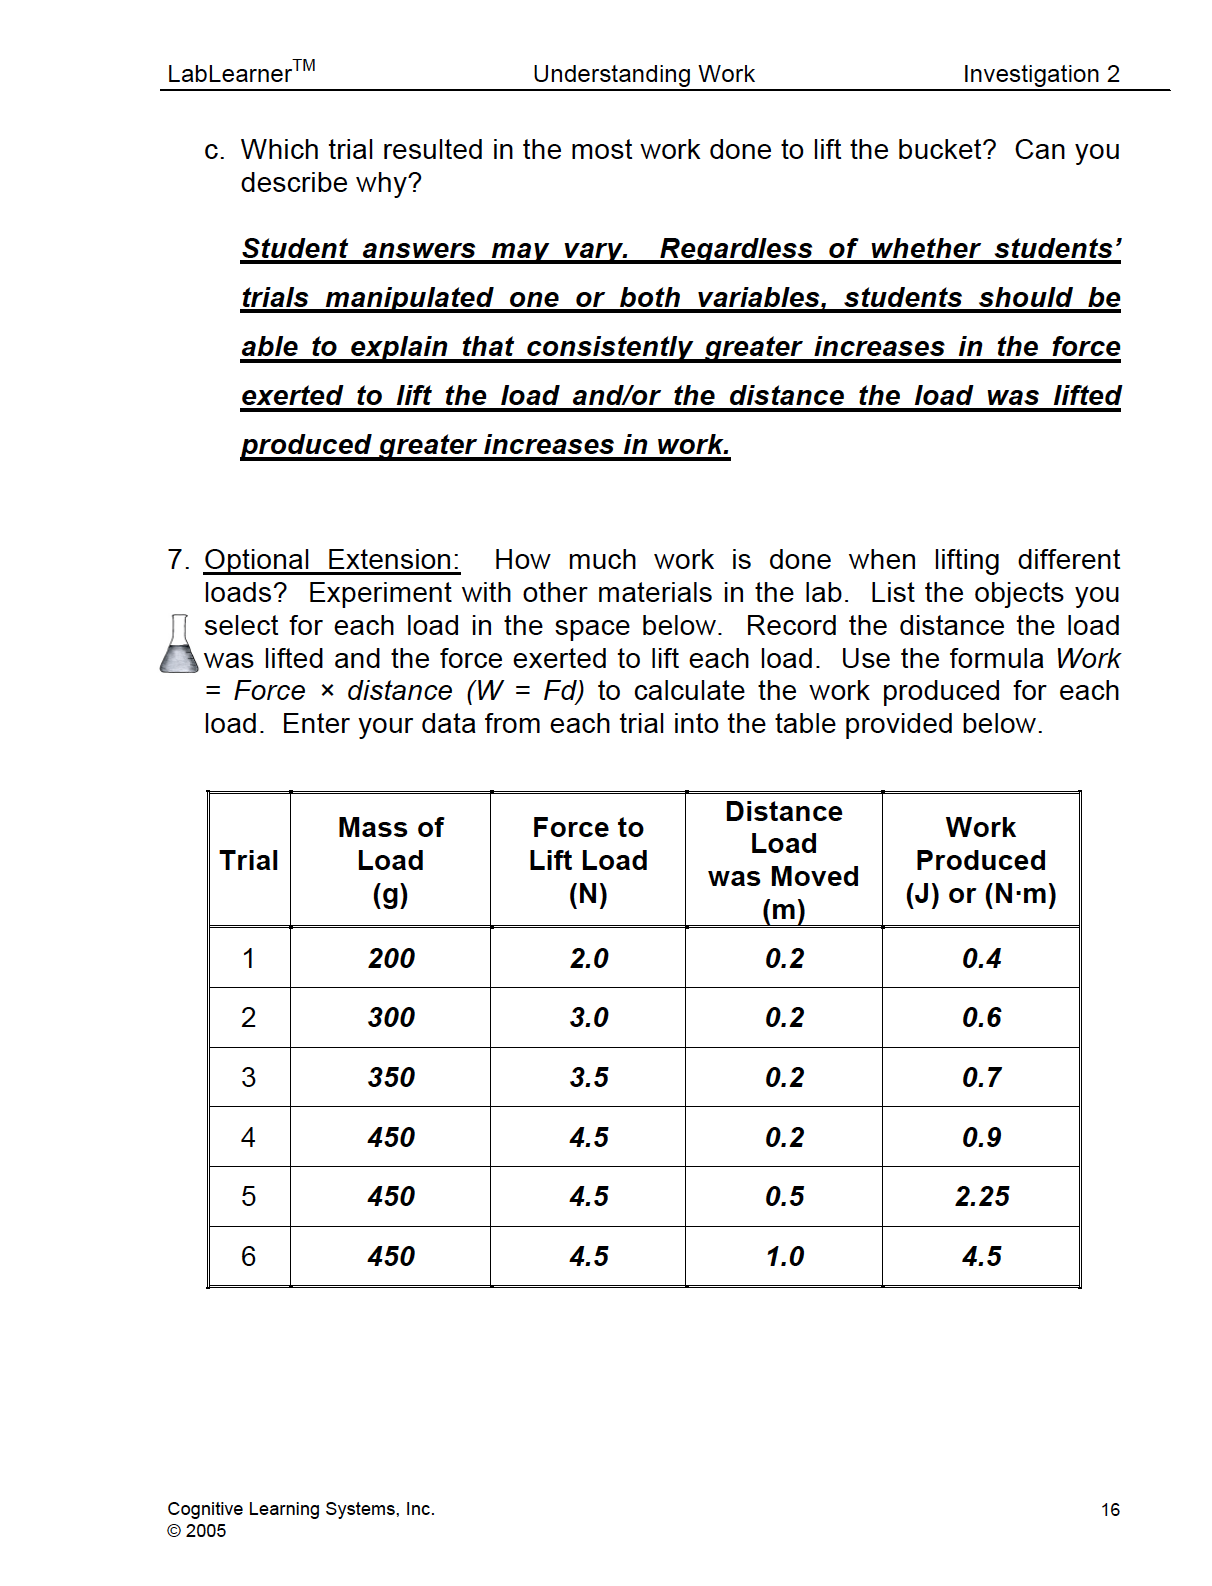
To complete the analysis, ask students to refer to Problem 6 of their Student Data Record.
Ask Students: How did you increase the work done to lift the bucket? Student answers will vary. Some students may have increased the distance the load was lifted, some increased the force exerted to lift the load by the mass of the load, some may have increased both variables. Discussion of the question, however, should center on the two variables that affect work.
After analyzing our data and seeing how work is increased by the force applied on a load or the distance over which the force is applied, would you solve the problem differently? Student answers will vary. If students had not increased both force and distance previously, they may suggest they would do so.
KEYS: LAB/POSTLAB