Teacher Portal:
Properties of Matter
Investigation 2 – PostLab
 PRINT IT
Use your browser to download a printable PDF as help during the slide presentation and to make additional notes. In your browser, go to File > Print and then choose to save as PDF.
NAVIGATE IT
Once the slide presentation is launched
- use your left and right arrows to advance or go back in the slide presentation, and
- hover your mouse over the left edge of the presentation to get a view of the thumbnails for all the slides so that you can quickly move anywhere in the presentation.
- Click HERE to launch the slide presentation for the CELL.
SHARE IT
SLIDE VPROP2-post-1
This is the second Investigation of the LabLearner CELL Exploring Density. In it, students focused on measuring the volume of water and making estimates.
______________________________________________
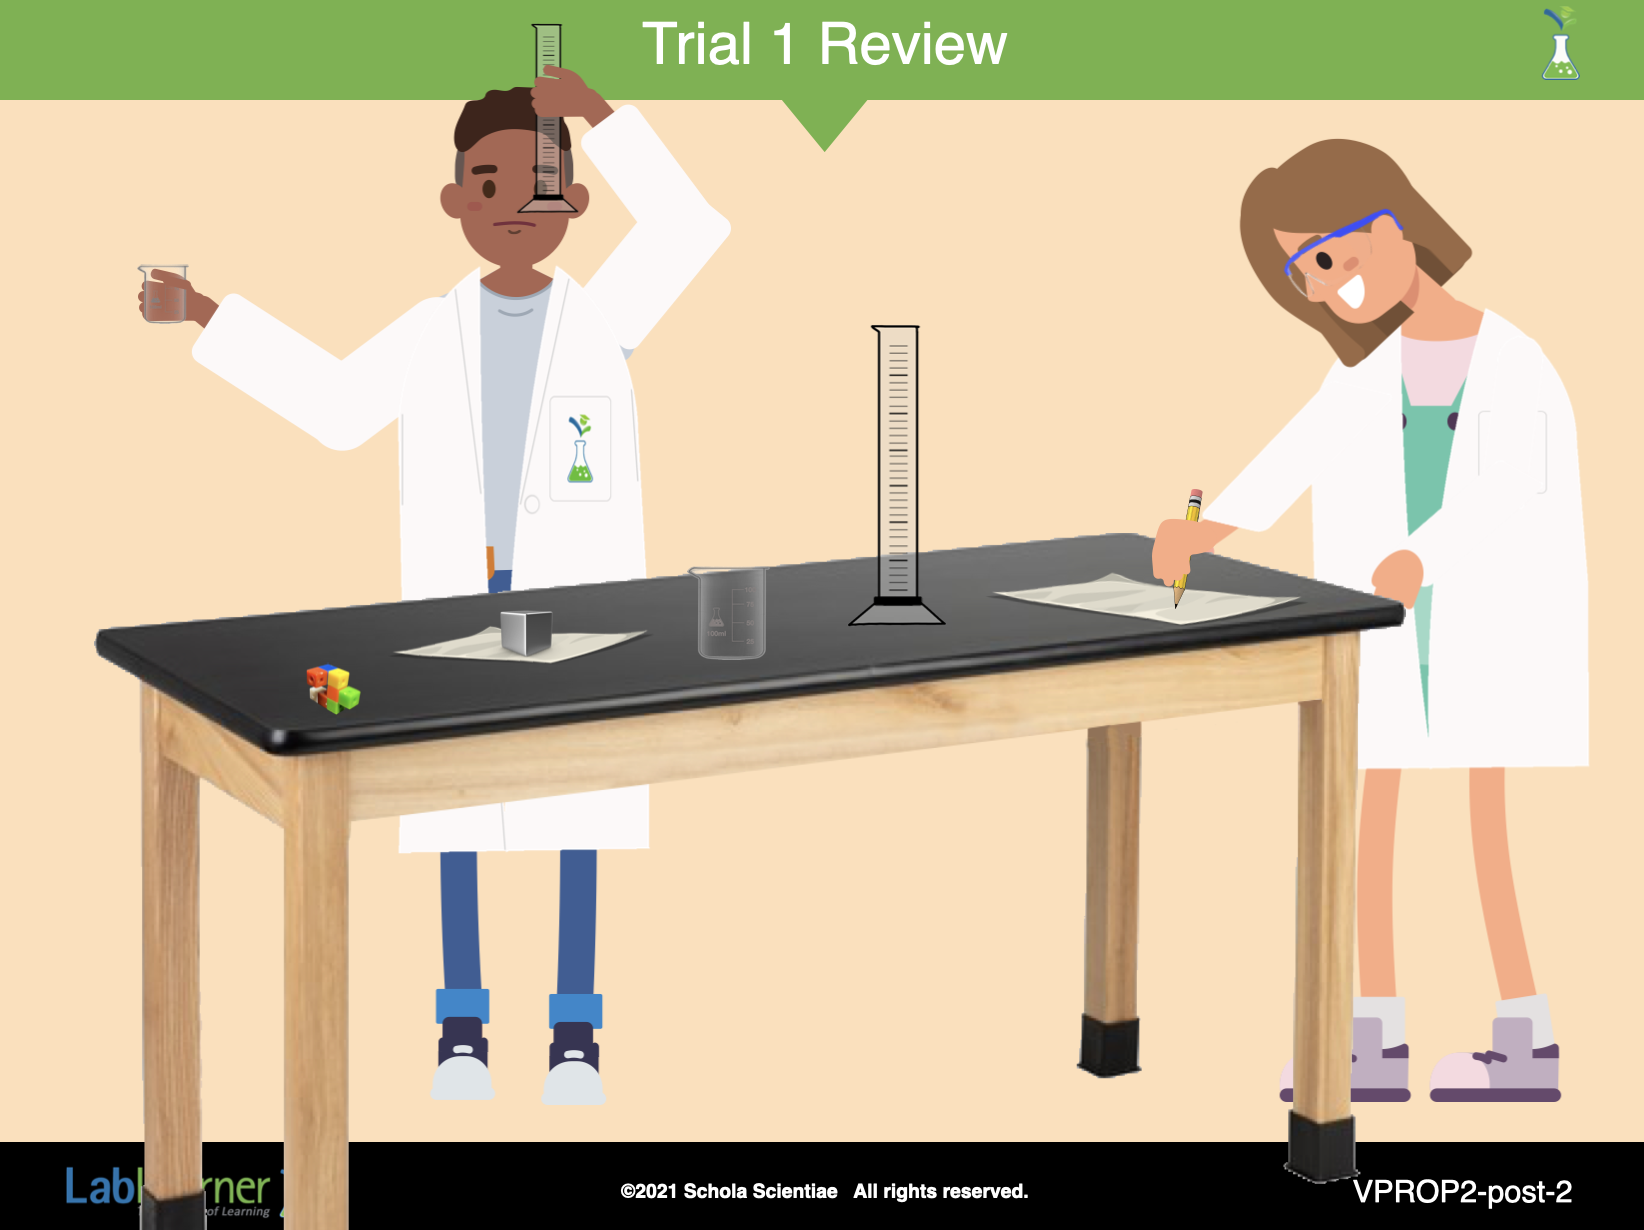
SLIDE VPROP2-post-2
A. Begin the analysis of the experiments by reviewing several of the concepts introduced thus far in Investigation Two. The following questions can be used to initiate a discussion of these concepts.
1. Ask students: What questions were investigated through the experiments in the Lab? Are the volumes of these containers the same or different? How many smaller containers will fill a larger container? How does an object affect the volume of water in a container?
2. Ask students: Can you describe what you did in your experiments to answer the questions? Students should suggest that they poured water from one container into another. They refilled smaller containers to see how many filled the larger container. They also placed objects in water and measured the volume before and after.
B. Review the Lab experiments beginning with Trial 1. Students may wish to refer to their Student Data Record during the review. Ask students the following questions to prompt discussion:
1. Ask students: Can different shaped containers have the same volume? How do you know? Yes. Students should indicate that they tested different containers in the lab and some of them had the same volume.
______________________________________________
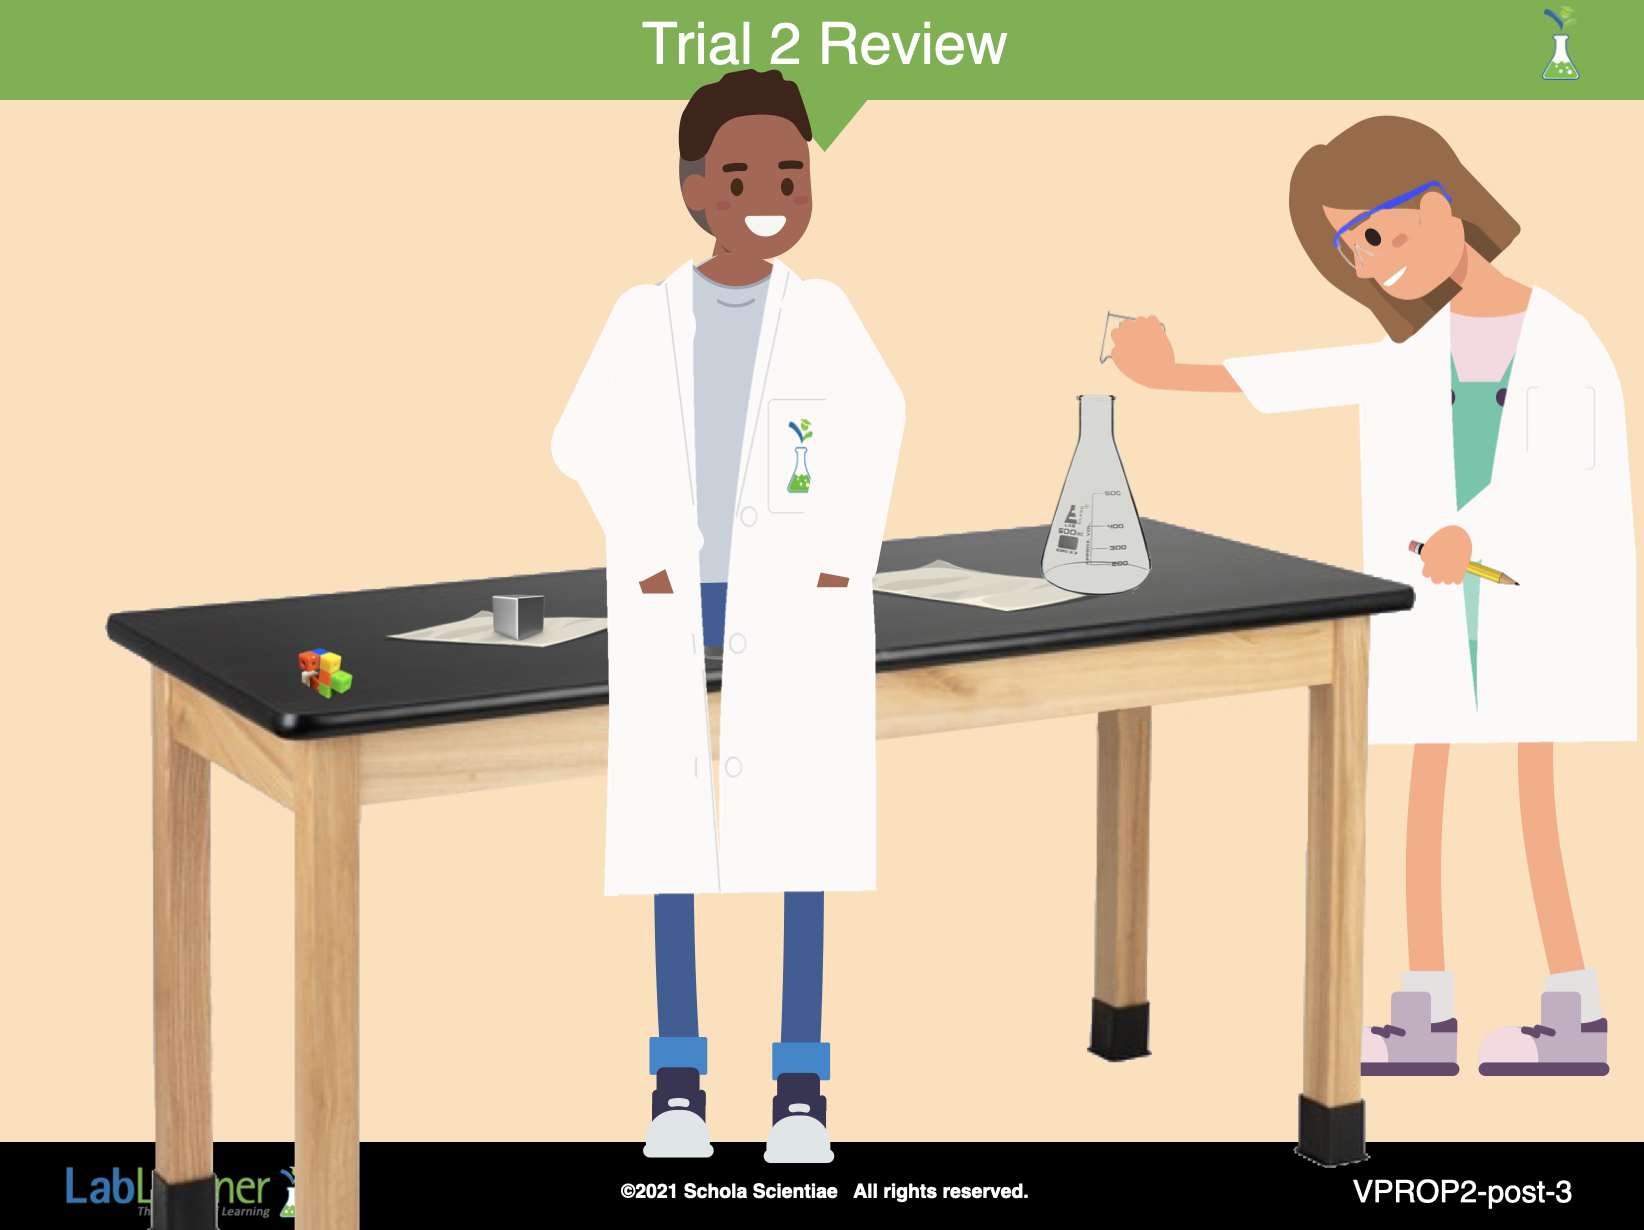
SLIDE VPROP2-post-3
C. Review Trial 2.
1. Ask students: What is the term for making a guess based on what you already know? Estimate.
2. Ask students: What was your estimate for Problem 4a? How many 100 ml beakers did you measure to fit into the 500 ml flask? Did you estimate correctly? Students should indicate how many beakers they estimated and measured. If the numbers are the same, the estimate was correct. If the numbers are different the estimate was not correct.
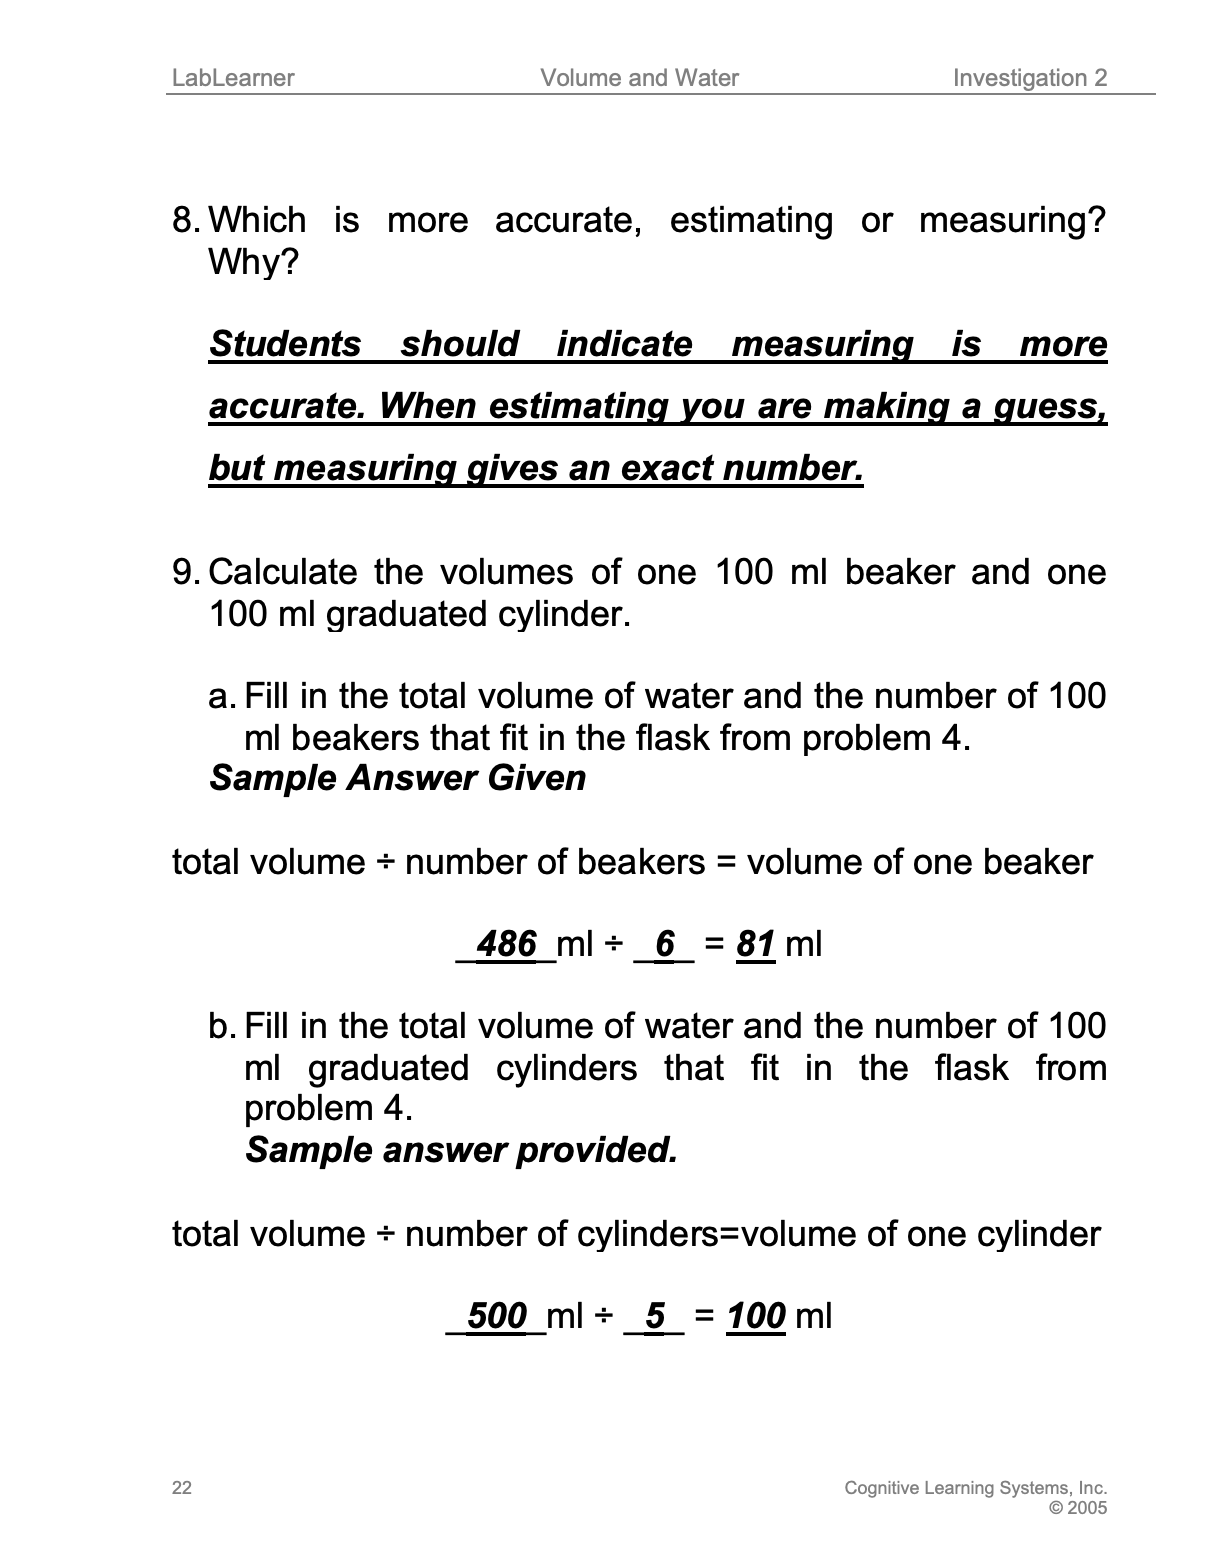
3. Ask students: Which is more accurate, estimating or measuring? Why? Student answers may vary. Students should indicate measuring is more accurate. When you estimate you don’t always get the right answer, but when you measure you will get a correct answer.
Tell students to record their answers in Problem 8 of their Student Data Record.
D. Direct students to calculate the volume of water in one 100 ml beaker and one 100 ml graduated cylinder.
1. Direct students to write down the volume of water they recorded in Problem 4e of their Student Data Record.
2. Tell students: That measurement was the total volume of 6 100 ml beakers. How can we calculate the volume of just one 100 ml beaker with the information we already have? Student answers may vary. Students should indicate that they need to divide to find the answer.
a. Tell students that they need to take the total volume and divide by 6. Students may use calculators if necessary. The number they calculate is the amount of water in one 100 ml beaker.
3. Tell students to write down the volume of water they recorded in Problem 4j into Problem 9b of their Student Data Record.
4. Tell students: That measurement was the total volume of 5 100 ml graduated cylinders. How can we calculate the volume of just one 100 ml graduated cylinder with the information we already have? Student answers may vary. Students should indicate that they need to divide the total volume by 5 to find the answer.
a. Direct students to take the total volume and divide by 5. Students may use calculators if necessary. The number they calculate is the amount of water in one 100 ml graduated cylinder.
5. Discuss with students that scientists use different tools for different purposes. In this Investigation students used a 100 ml graduated beaker, 100 ml graduated cylinder, 500 ml flask, and a 1,000 ml graduated cylinder.
______________________________________________
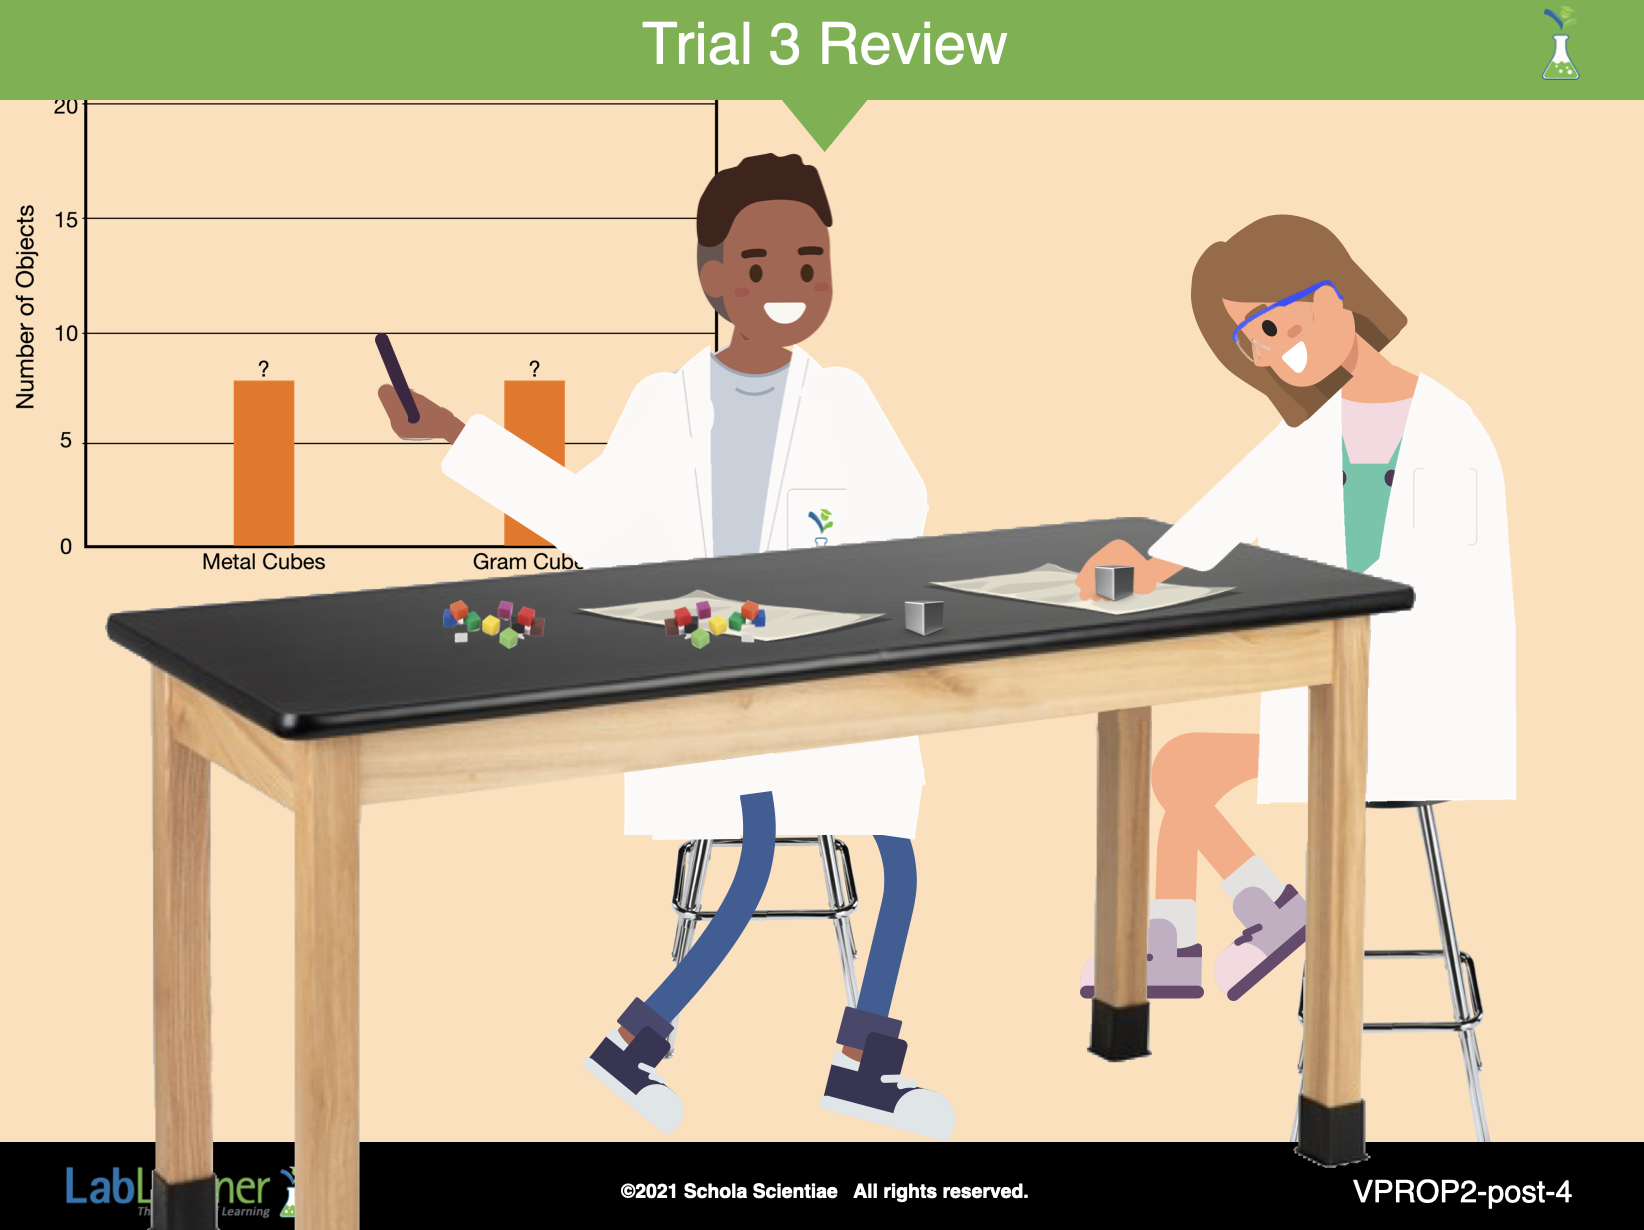
SLIDE VPROP2-post-4
E. Review Trial 3 with students.
1. Ask students: How many metal cubes did you estimate fit into the square in problem 5? Student answers may vary.
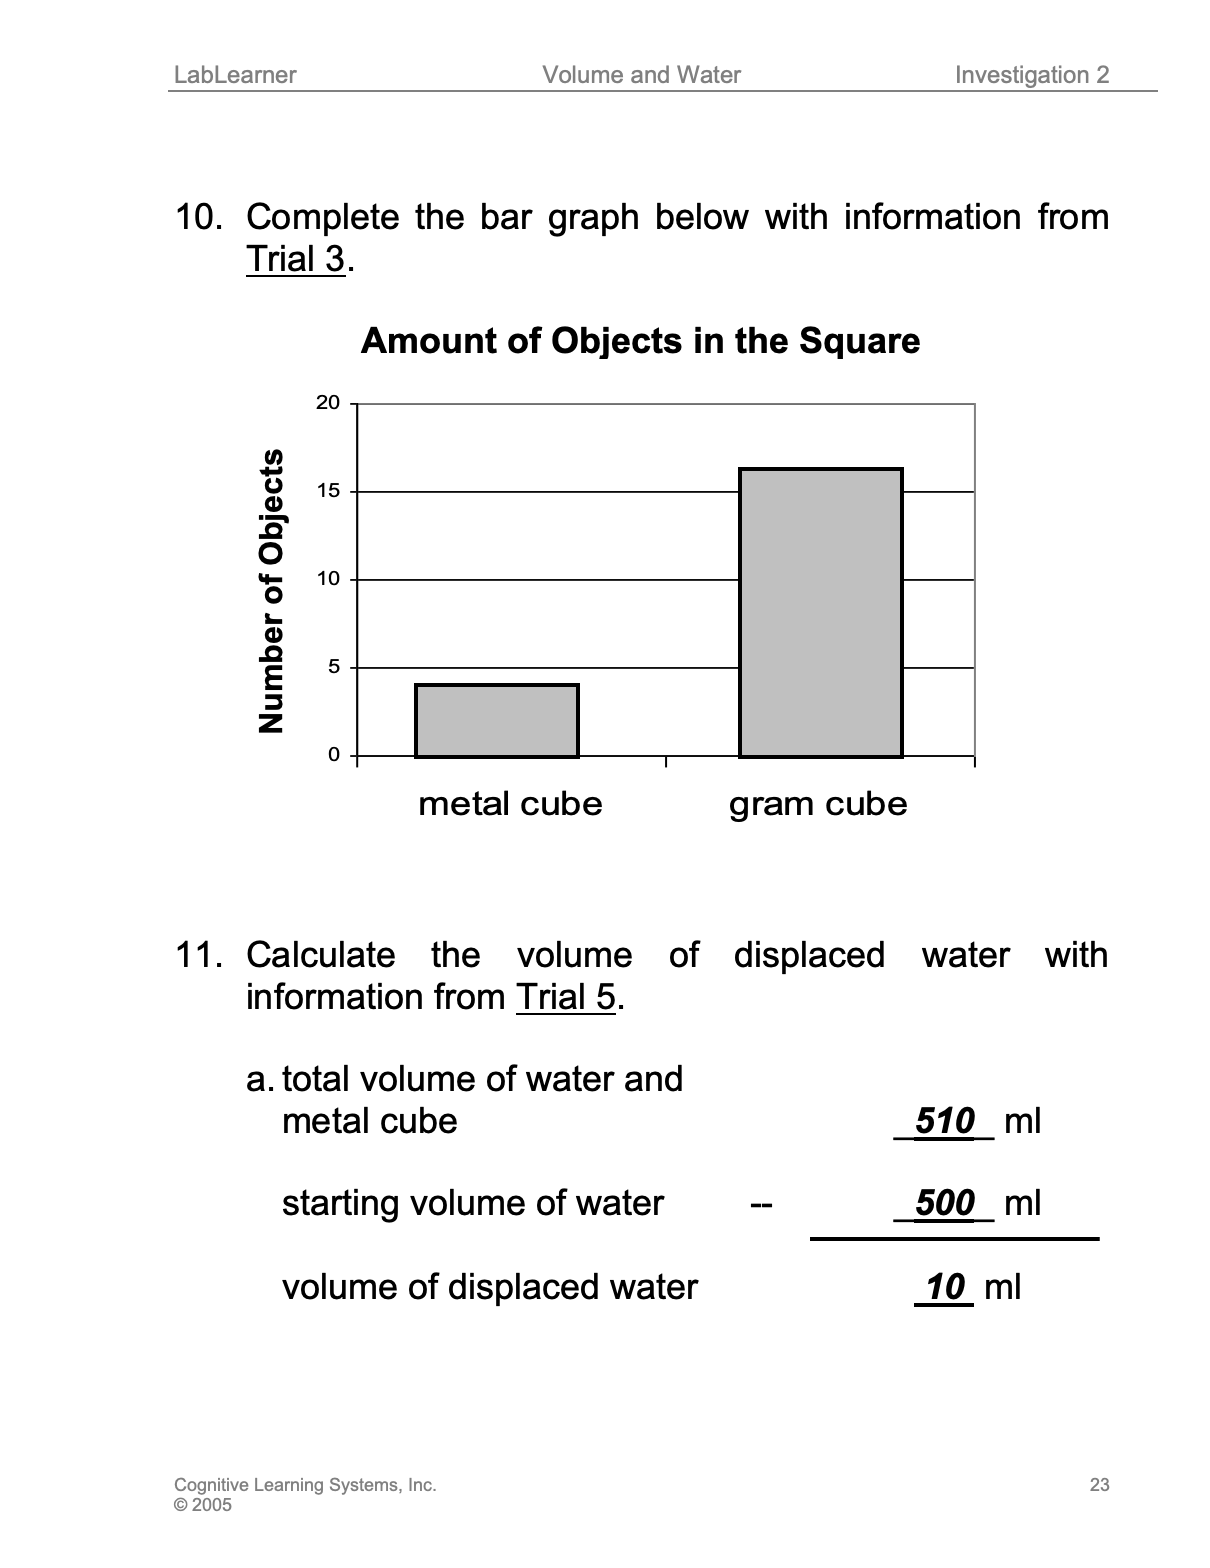
2. Ask students: How many metal cubes did you measure fit into the square? Students should indicate 4 metal cubes fit into the square.
3. Ask students: Was your estimate correct? Was it too high or too low? Student answers may vary.
4. Ask students: How many gram cubes did you estimate fit into the square? Student answers may vary.
5. Ask students: How many gram cubes did you measure fit into the square? Students should indicate 16 gram cube blocks fit into the square.
6. Ask students: Was your estimate correct? Was it too high or too low? Students will indicate yes or no.
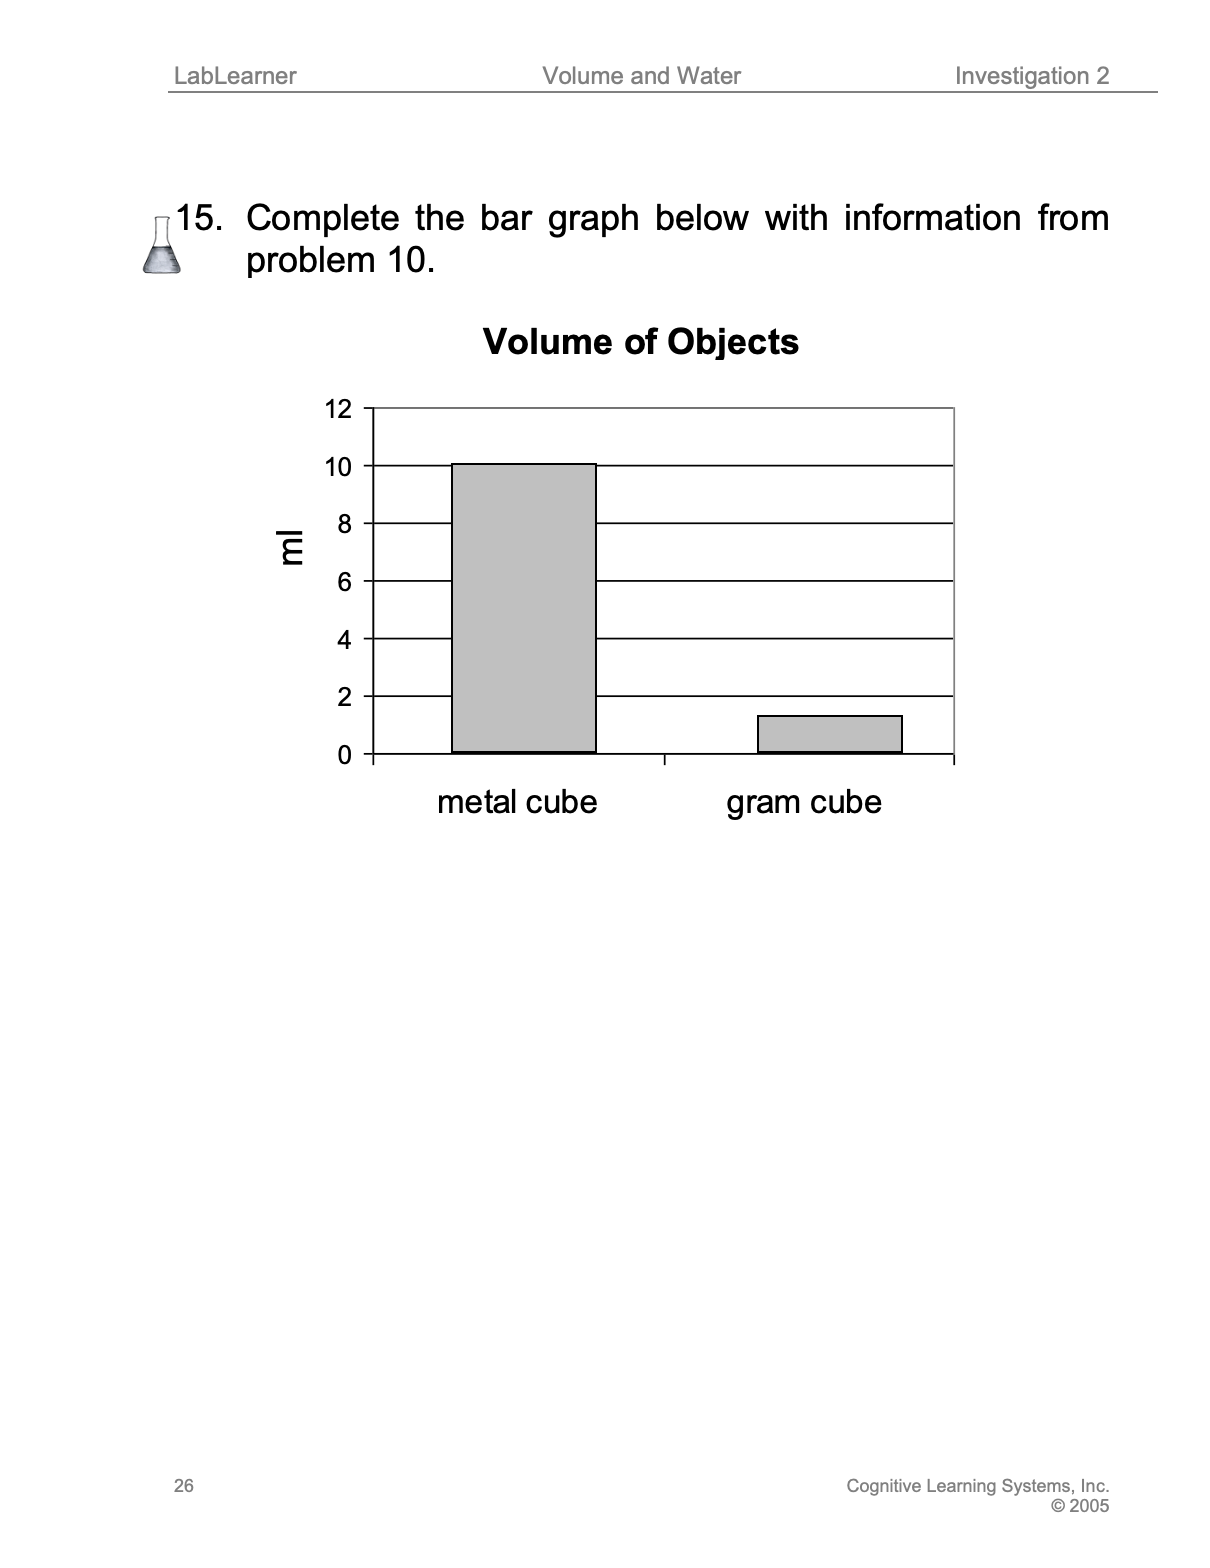
7. Instruct students to complete the bar graph in Problem 10 of their Student Data Record with the amount of metal cubes and gram cubes that filled the square. First, review the steps for the Procedural Toolbox, Creation and Completion of a Bar Graph.
a. Tell students that the Bar Graph is a way of organizing and displaying data.
b. Tell students to look at the labels on the bottom of the graph. This will tell them what each bar will represent.
c. Tell students to look at the labels running up and down the side of the graph. Discuss what the labels represent (number of individual objects that fit into the square).
d. Ask students to draw a bar that represents the number of times the metal cube fit into the square.
e. Ask students to draw a bar that represents the number of times the gram cube fit into the square.
______________________________________________
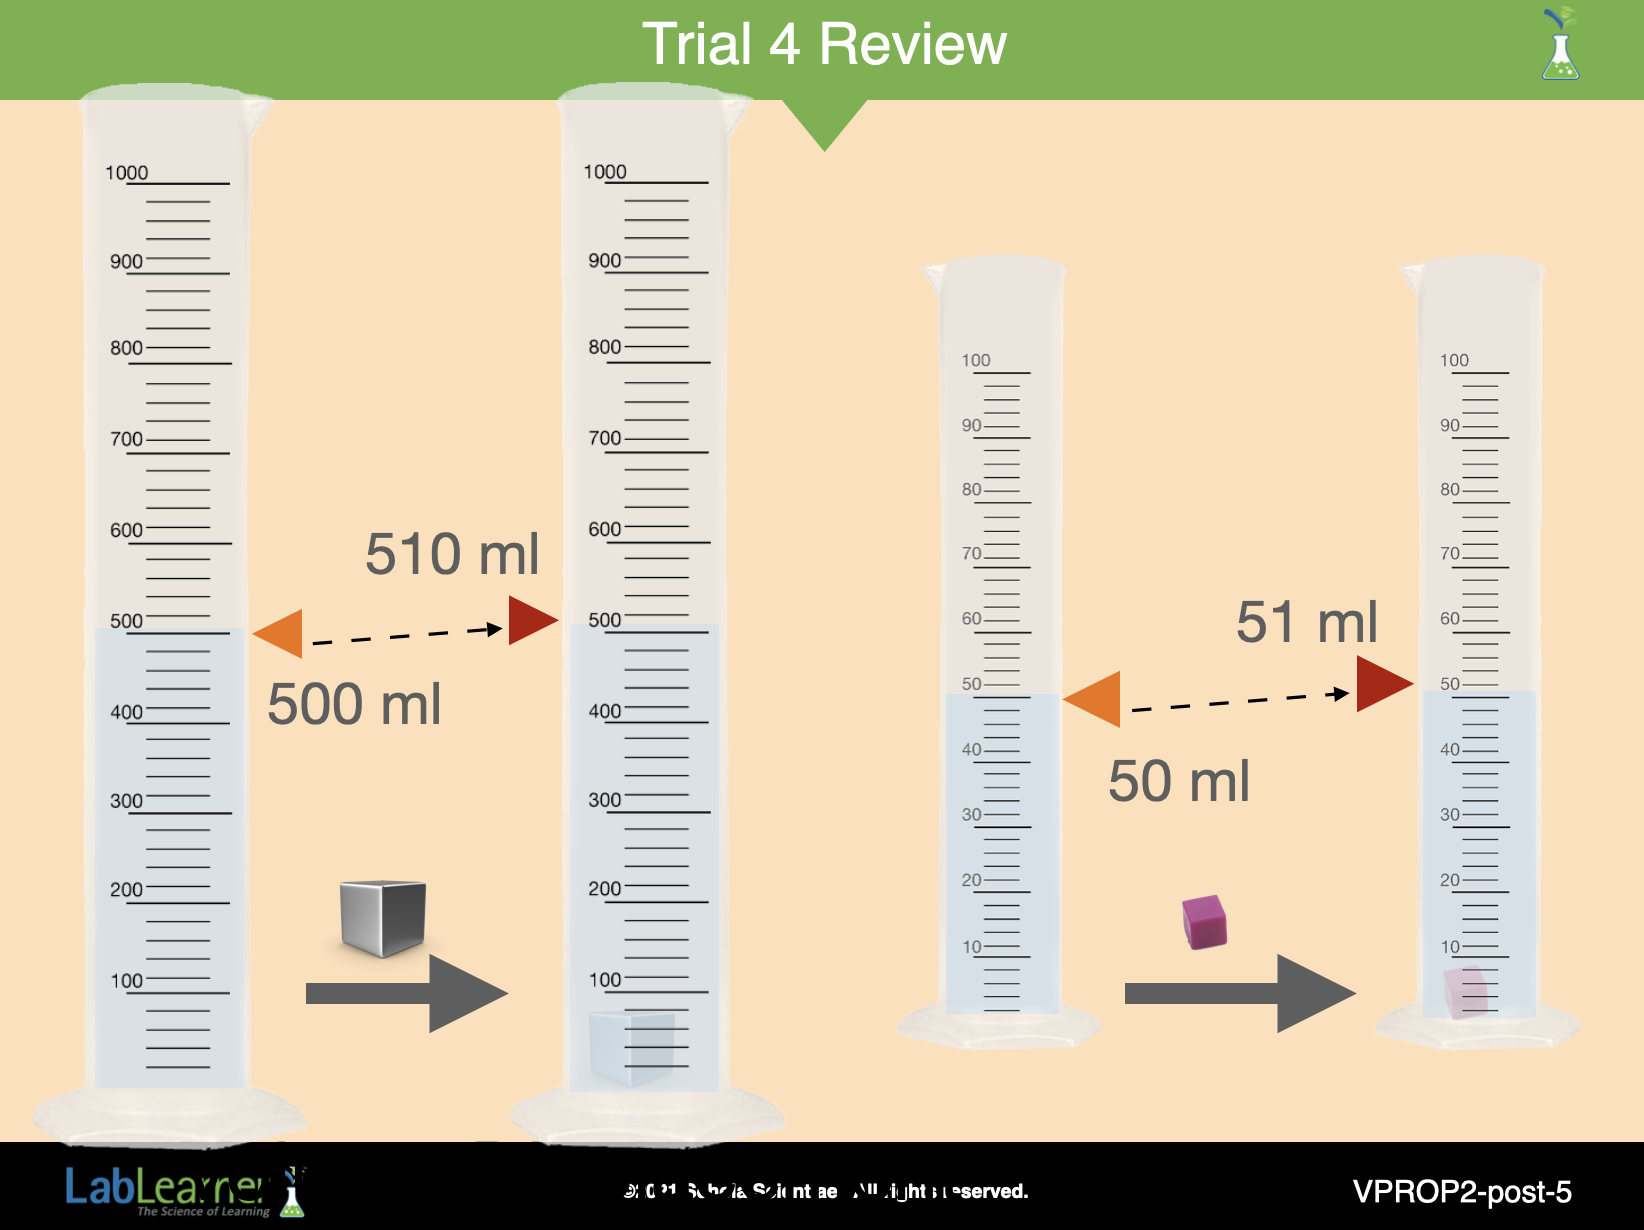
SLIDE VPROP2-post-5
F. Review Trials 4 with students.
1. Ask students: What happened to the volume when you put an object in the water? Students should indicate the volume increased or went up.
2. Ask students: Why did the volume increase? Students should indicate the volume increased because the object takes up space or has volume.
3. Ask students: What was the volume before you put the metal cube in the water? Students should record 500 ml in their Student Data Record.
4. Ask students: What was the total volume with the metal cube? Students should record 510 ml in their Student Data Record.
5. Ask students: How can we calculate the amount of water that was displaced before and after the metal cube was added? Student answers may vary. Students should indicate that they can find the difference by subtracting the starting volume from the total volume. Students may use Problem 11a to determine the volume of water that was displaced.
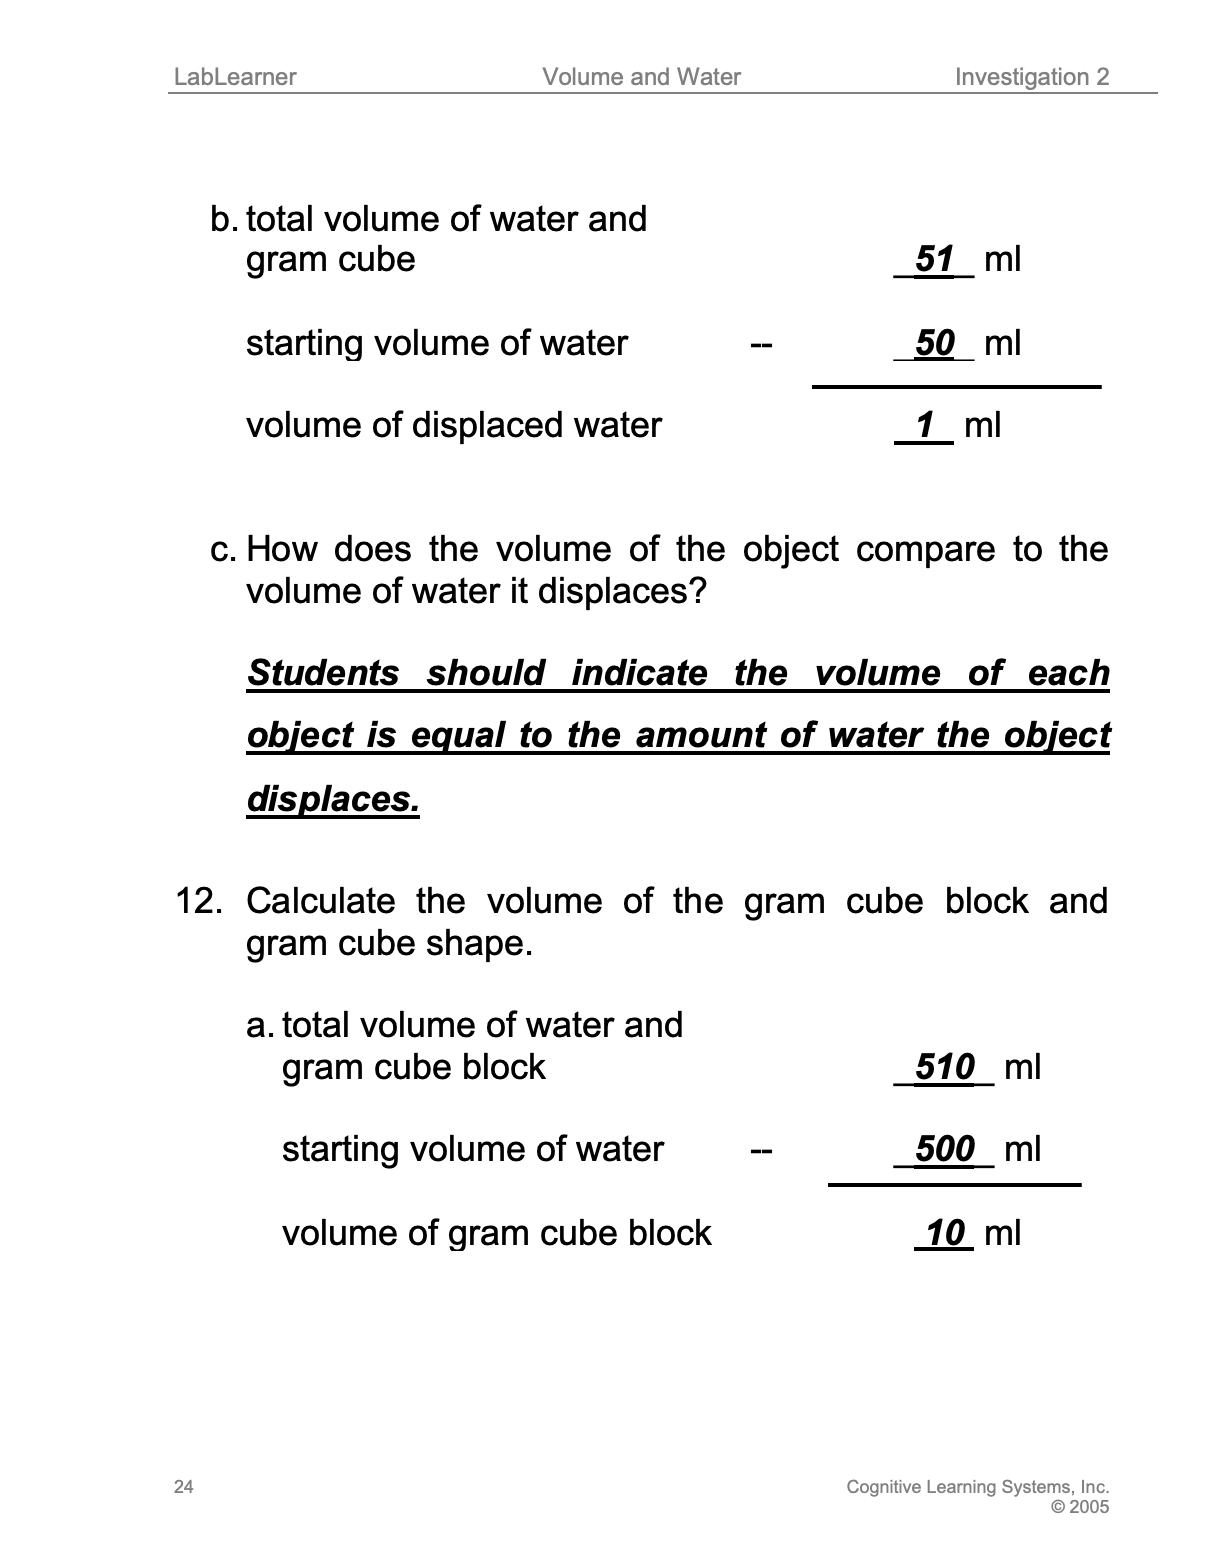
6. Ask students: What was the volume before you put the gram cube in the water? What was the total volume with the gram cube? How can we calculate the amount of water that was displaced after the gram cube was added? Students should calculate the displacement the same way they calculated the displacement with the metal cube. Students may use problem 11b to determine the volume of water that was displaced.
7. Tell students: Look at these results. Based on your results, what could you say about the volume of each object? Students should indicate that the volume of each object is the same as or equal to the amount of water that was displaced.
______________________________________________
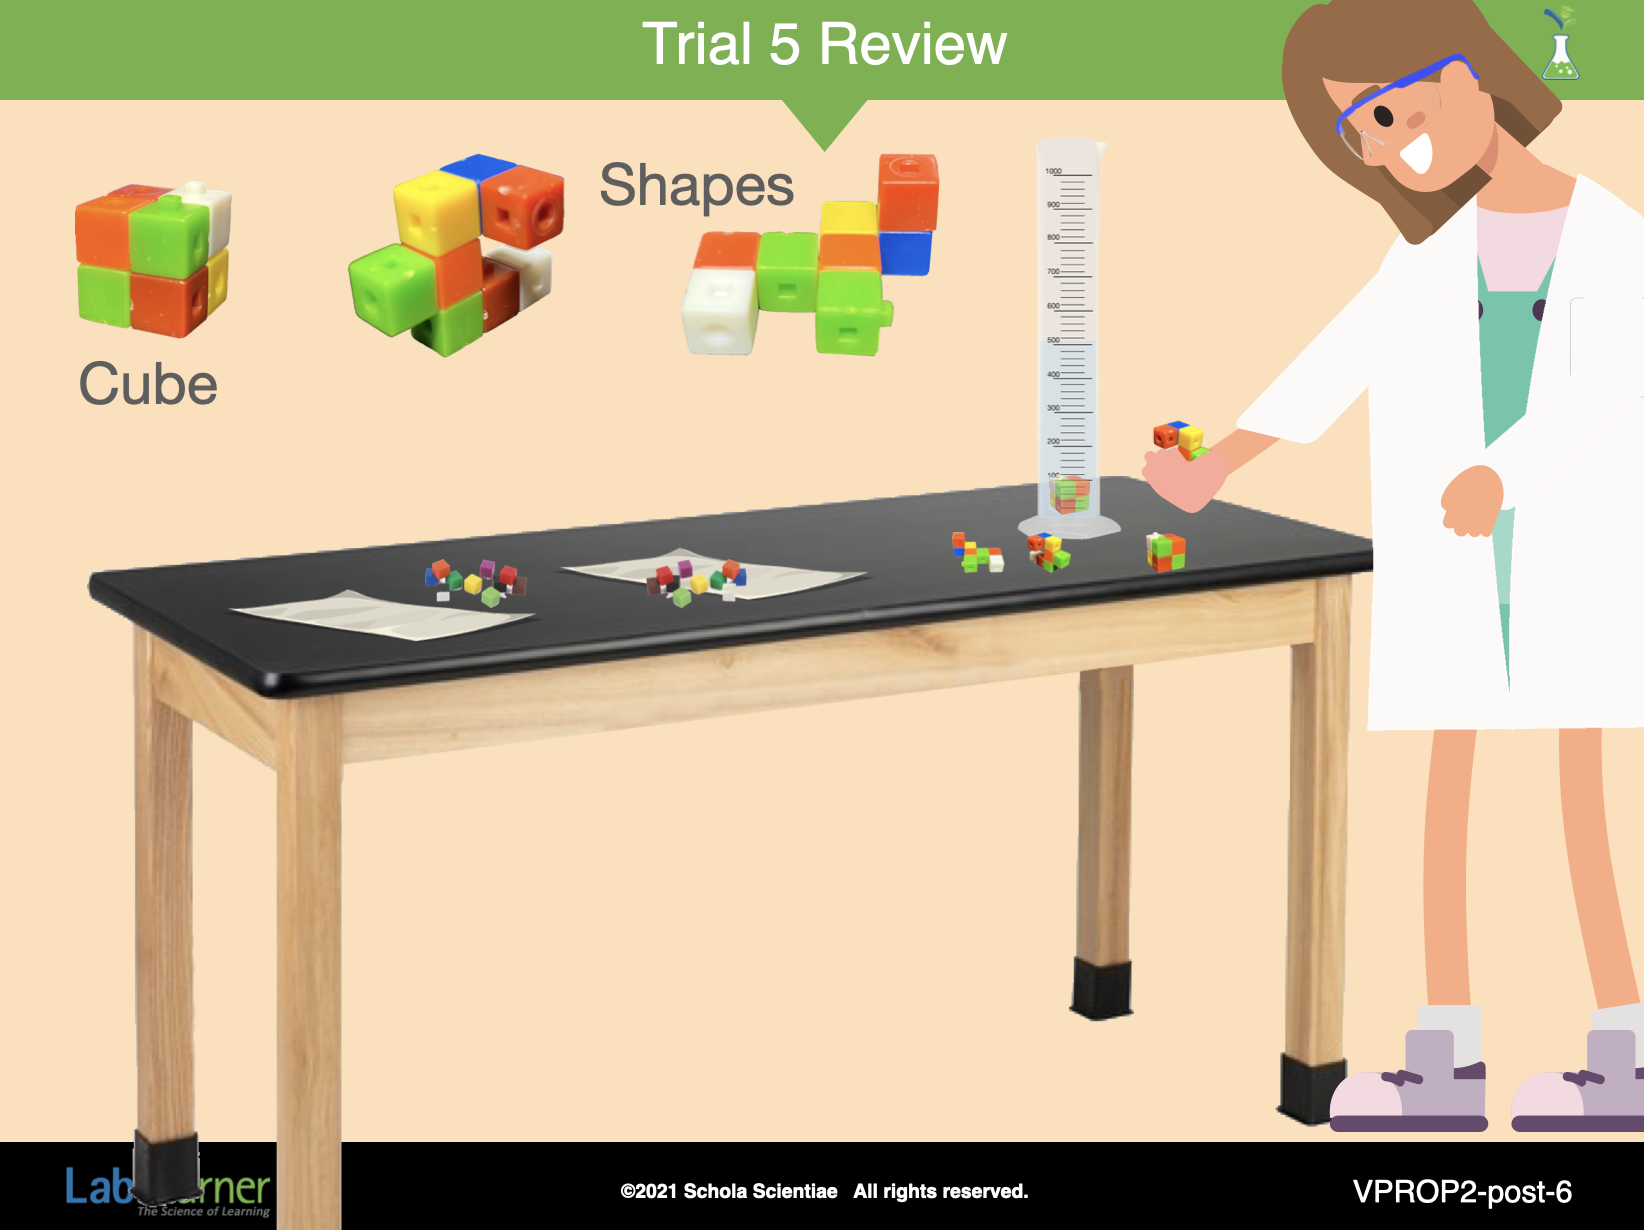
SLIDE VPROP2-post-6
Review Trial 5 with students.
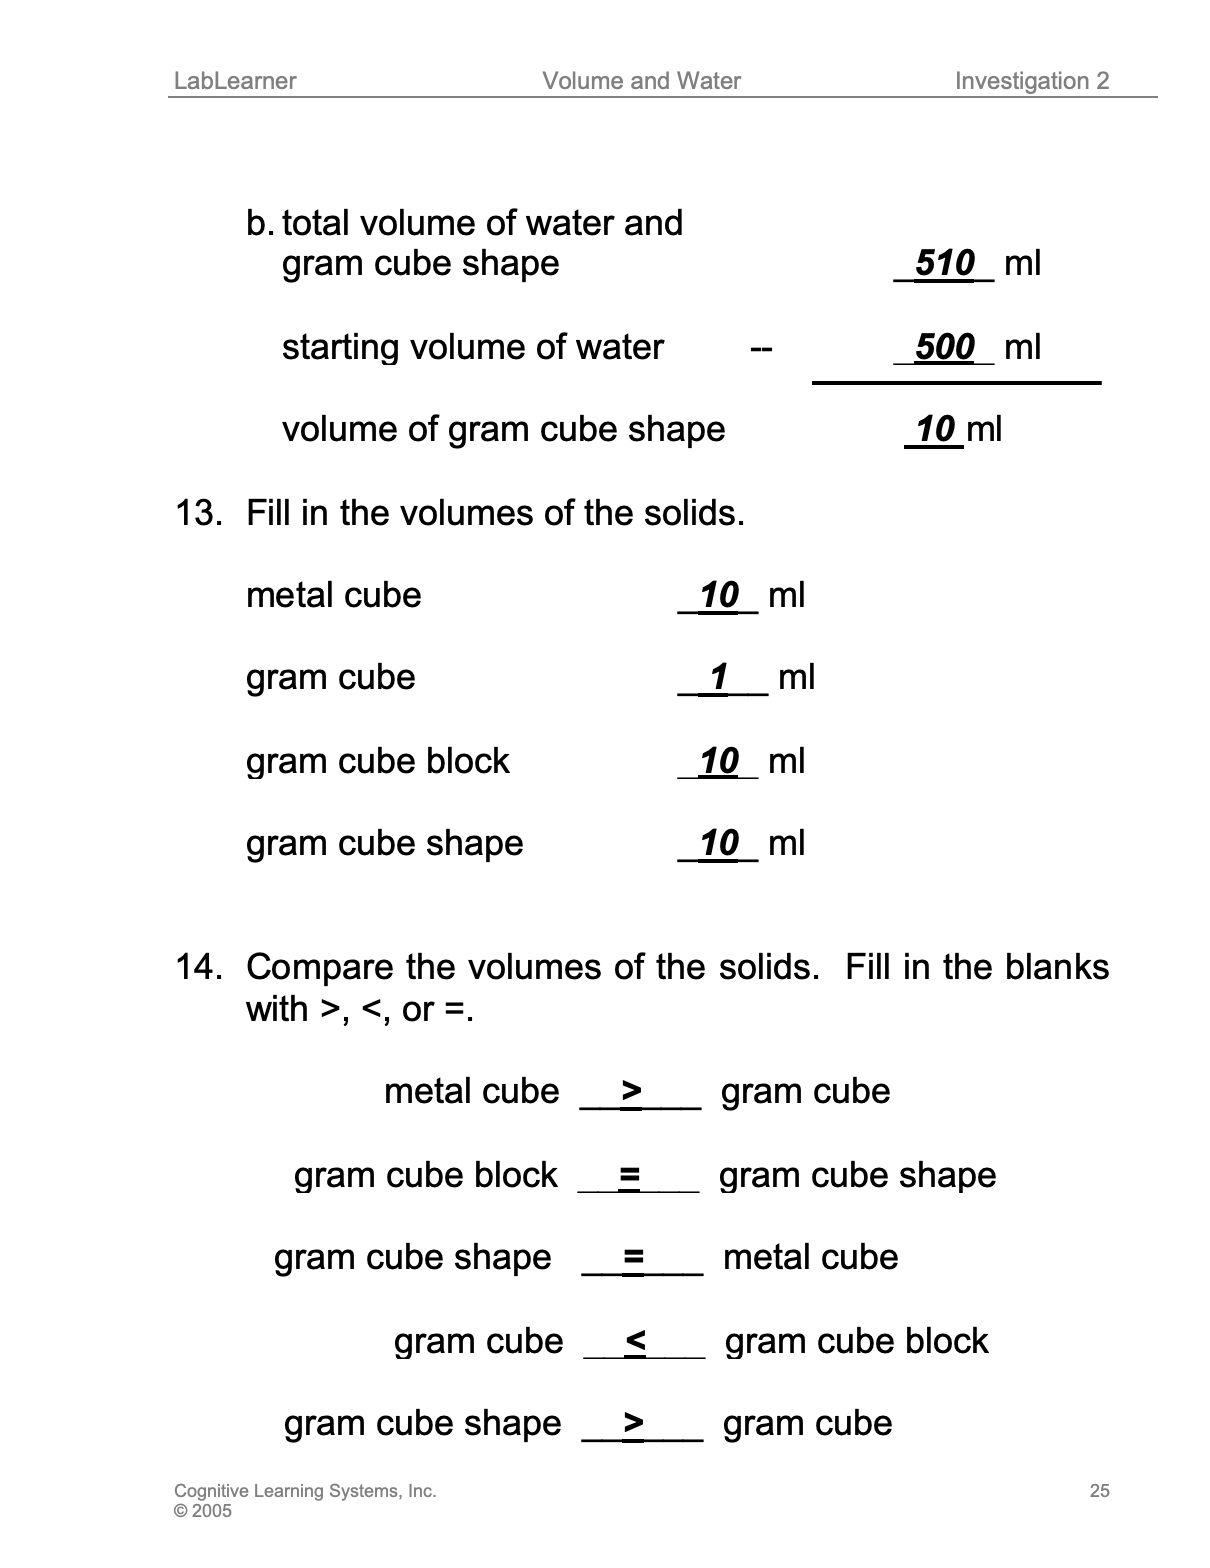
8. To further demonstrate the concept of volume displacement, instruct students to calculate the volume of the gram cube block and gram cube shape using the same method as before.
9. Direct students to complete their consideration of the objects’ volumes and the comparisons of those volumes in Problem 11c of their Student Data Record.
______________________________________________
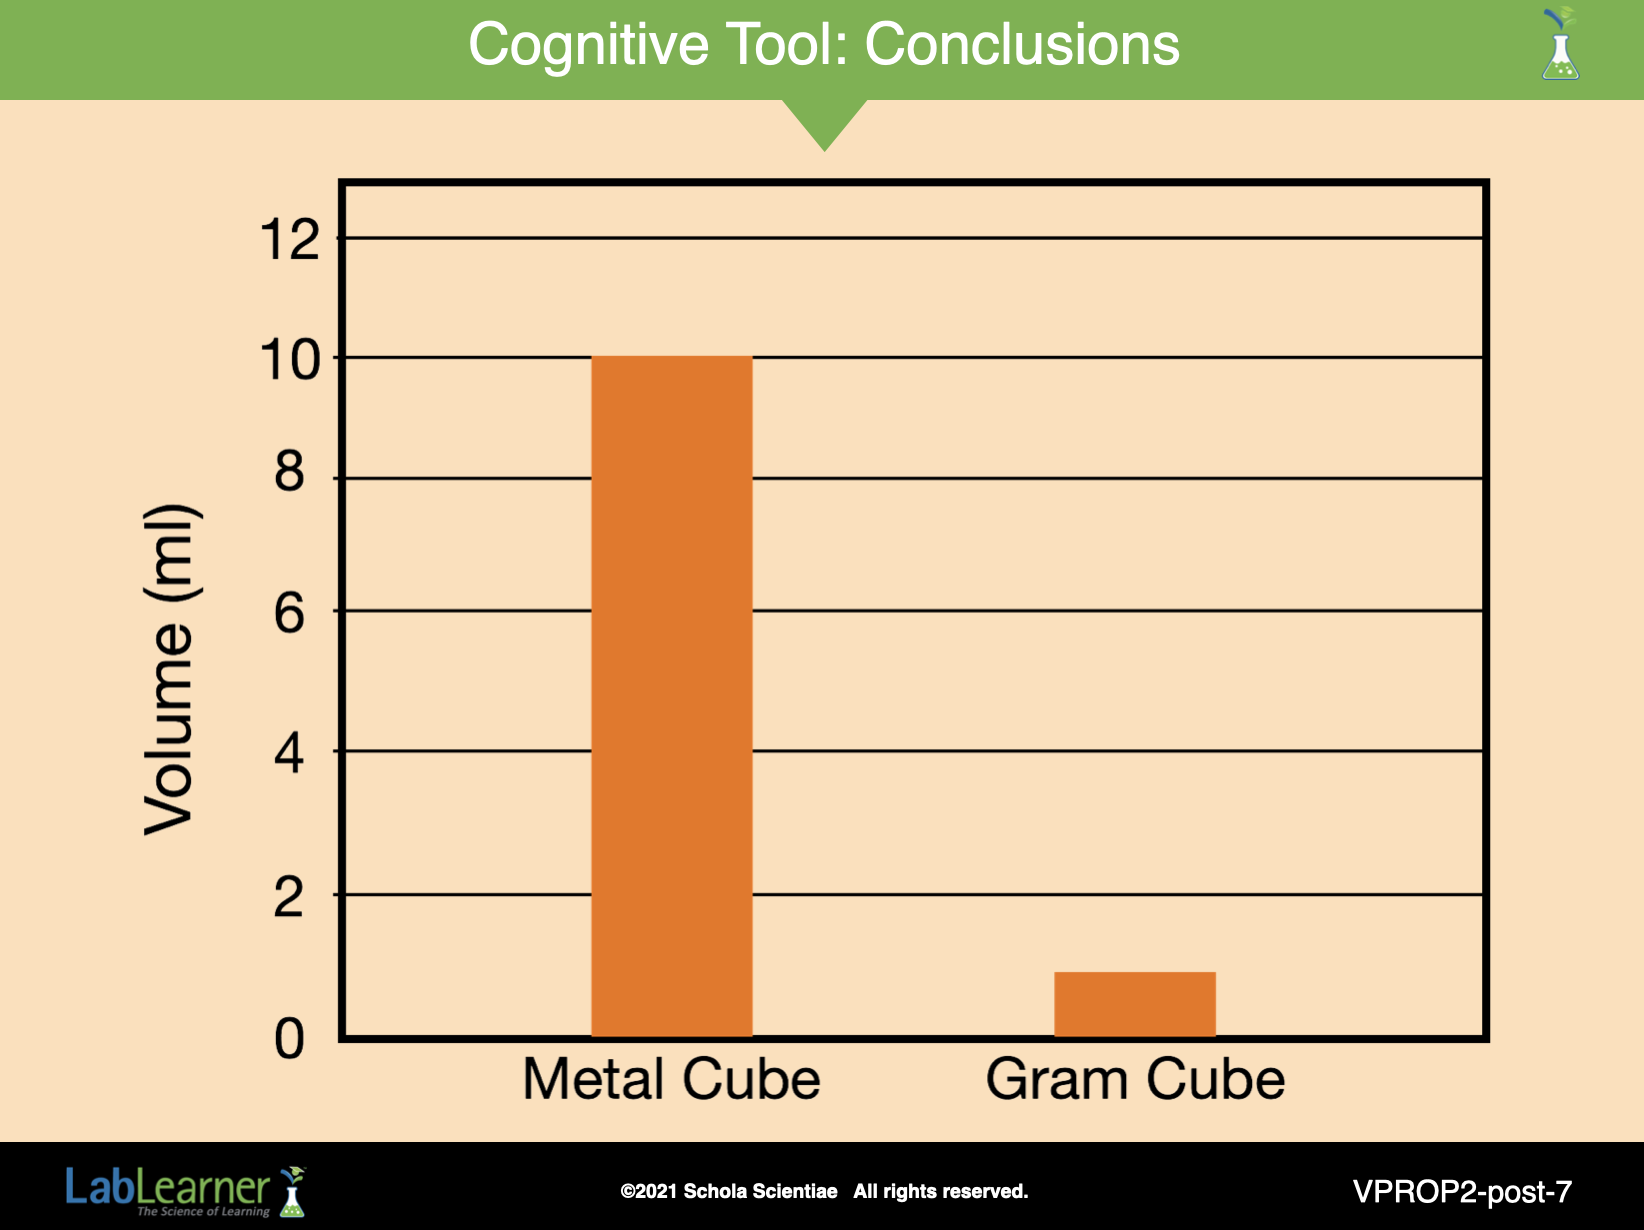
SLIDE VPROP2-post-7
G. Finish the analysis of the investigation by comparing data from different trials.
1. Ask students to work in pairs to answer Problems 13 and 14 of their Student Data Record. As a class, review the answers.
2. Tell students: Let’s find a way to organize our results from the trials with the metal cube and gram cubes. Can you think of a way? Student answers may vary. Students should indicate a bar graph as one way of organizing the information.
3. Instruct students to complete the bar graph in problem 15. If necessary, review the Procedural Toolbox steps listed above for Completion of a Bar Graph.
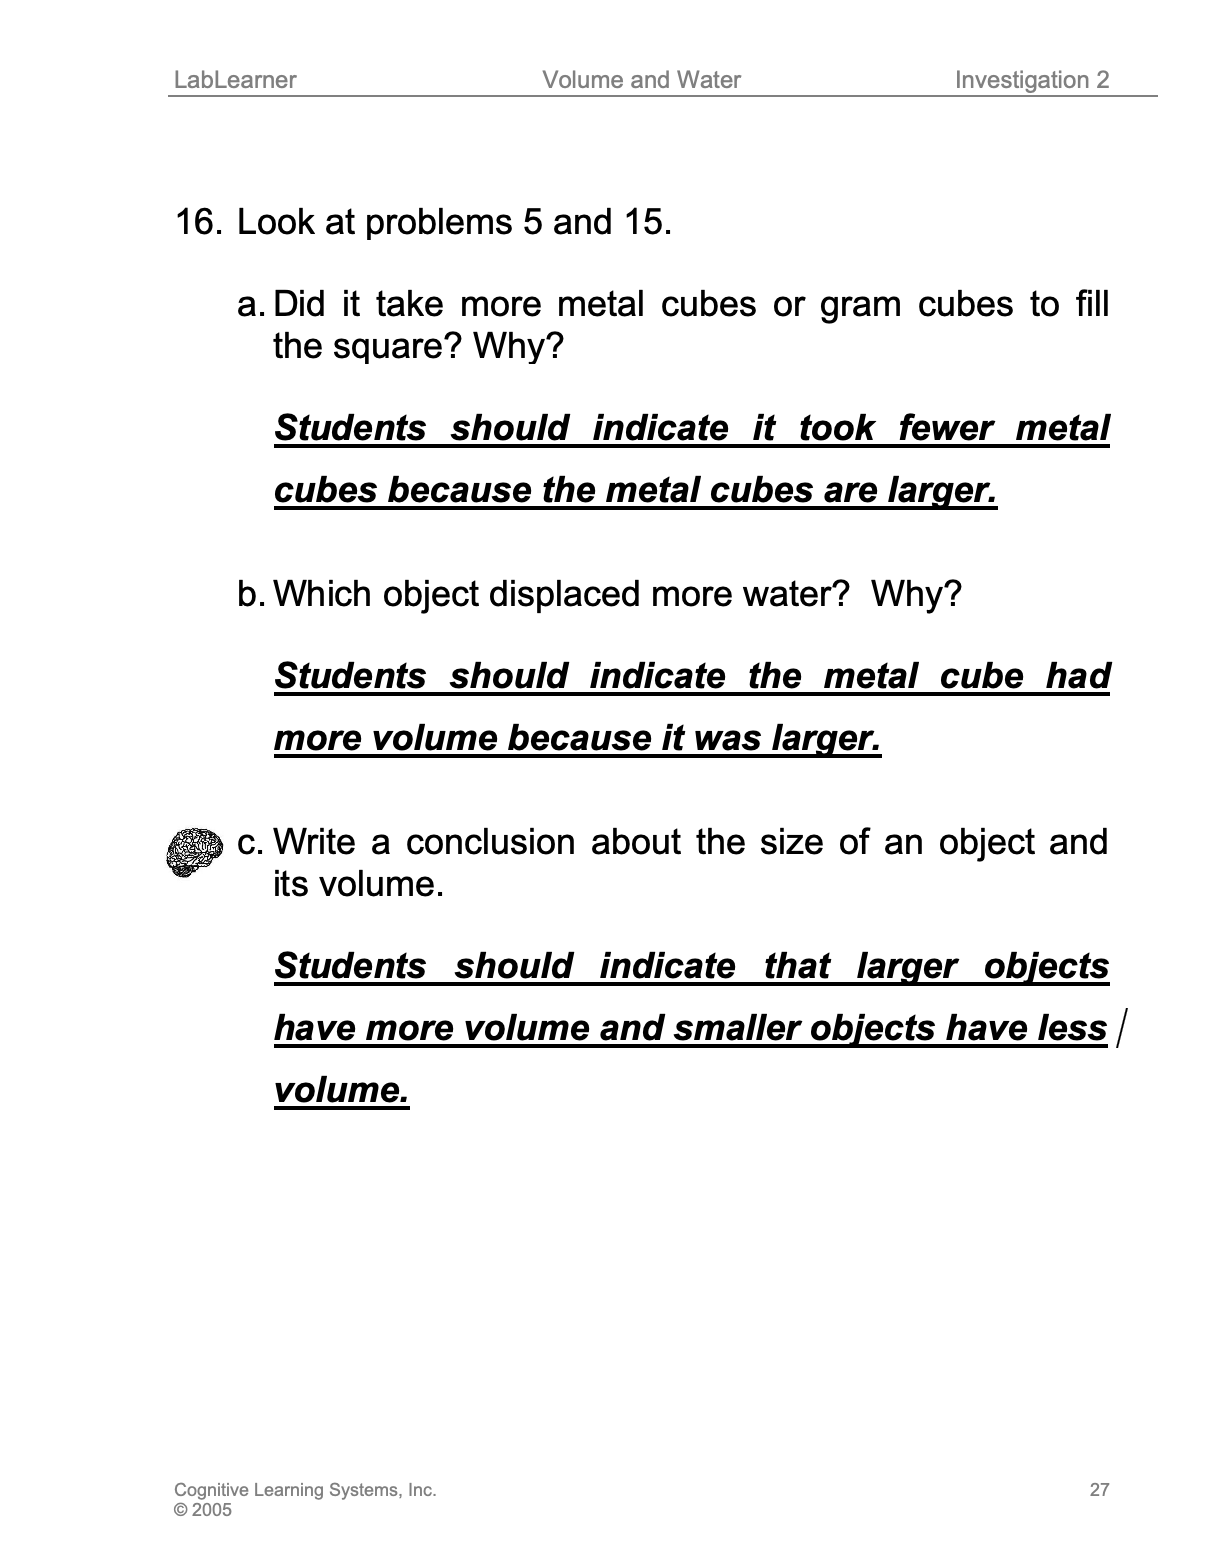
4. Explain that you would like students to think about what they have discussed thus far and to work with the other members of their group to answer the questions. The following questions may be found in Problem 16:
a. Ask students: Did it take more metal cubes or gram cubes to fill the square? Why? It took less of the metal cube to fill the square because it was larger. It took up more space.
b. Ask students: Which object displaced more water? Why? The metal cube displaced more water because it was larger. It had more volume.
c. Tell students: Make a conclusion sentence about the size of an object and its volume. Students should suggest that objects with larger sizes have a larger volume, or objects that take up more space have a larger volume.
______________________________________________
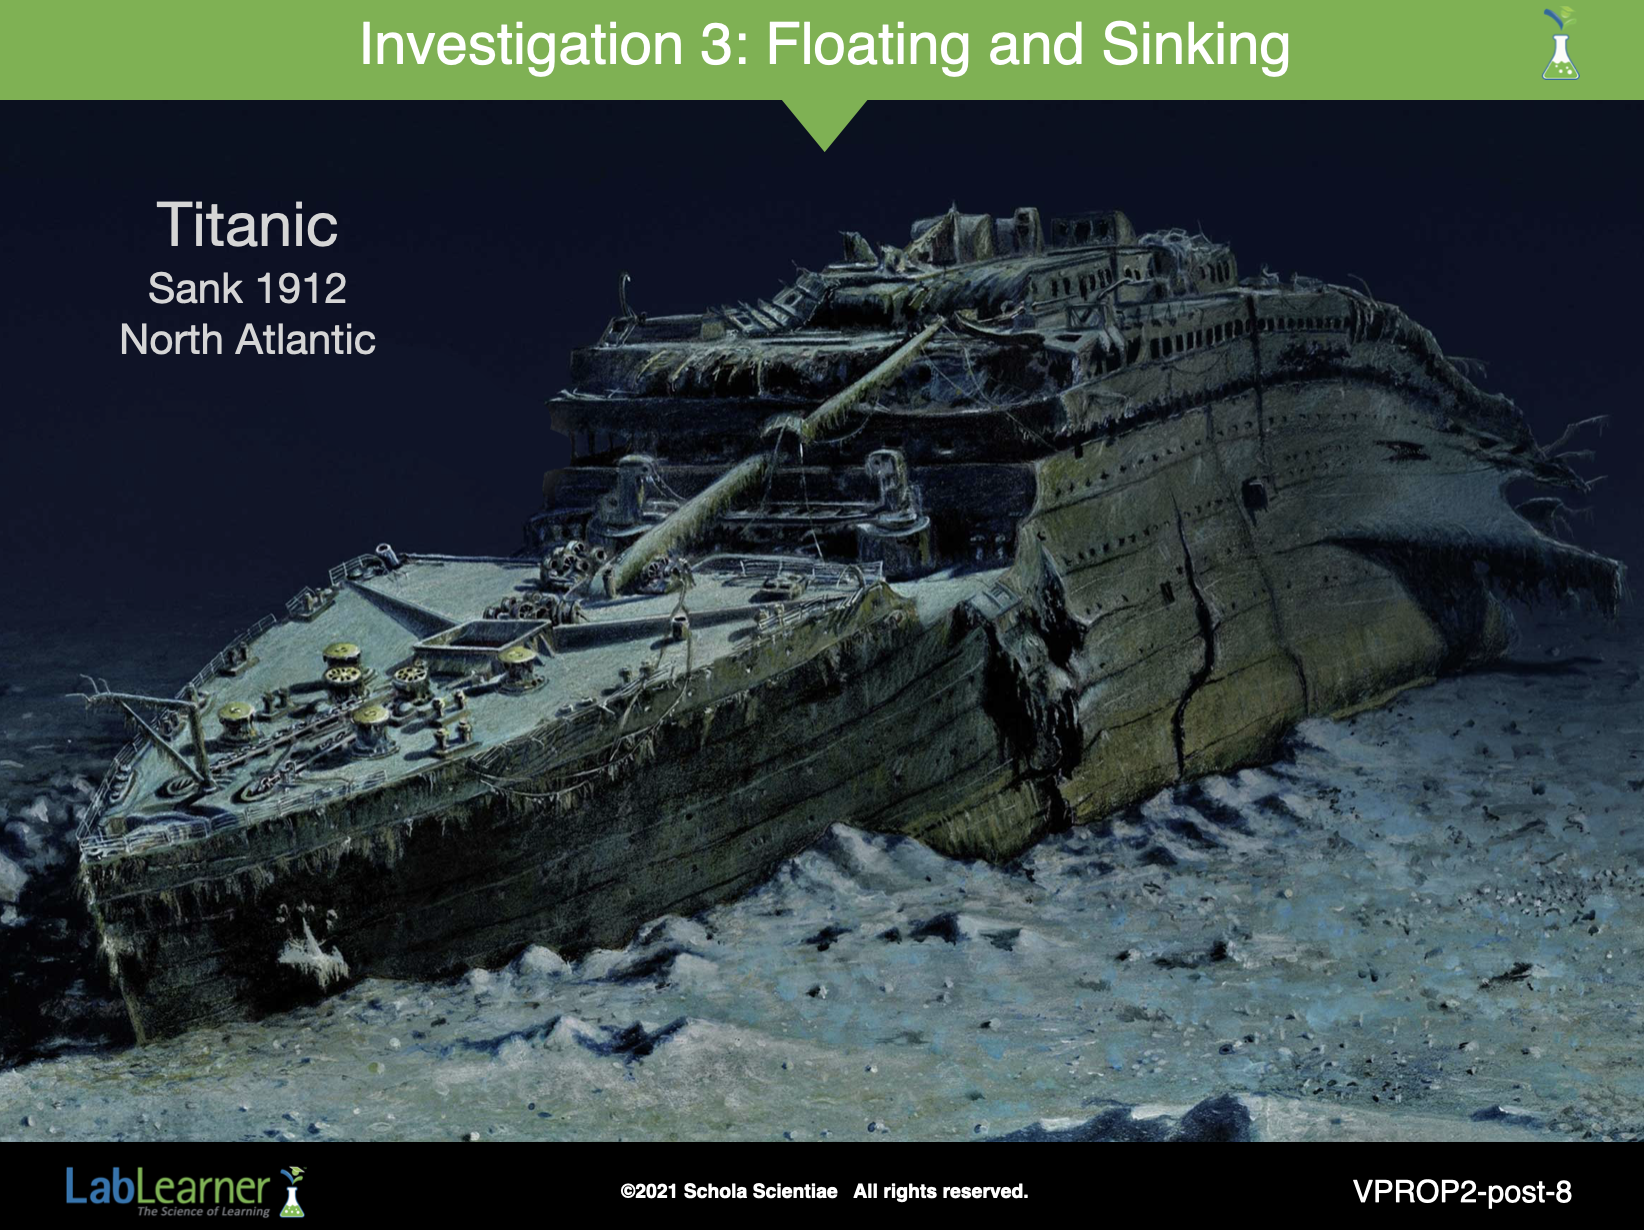
SLIDE VPROP2-post-8
H. To complete this investigation, tell students they will continue to study another aspect of solids in water.
1. Ask students: Did the objects sink or float in the water? Students should indicate that the objects sank.
2. Tell students: In the next Investigation we will explore floating and sinking in water.
Note: The illustration shown on this slide is of the Titanic, which sank in the North Atlantic Ocean in 1912.
KEYS: POSTLAB