Teacher Portal:
Examining Nutrition
Investigation 4 – PostLab
PRINT IT
Use your browser to download a printable PDF as help during the slide presentation and to make additional notes. In your browser, go to File > Print and then choose to save as PDF.
NAVIGATE IT
Once the slide presentation is launched
- use your left and right arrows to advance or go back in the slide presentation, and
- hover your mouse over the left edge of the presentation to get a view of the thumbnails for all the slides so that you can quickly move anywhere in the presentation.
- Click HERE to launch the slide presentation for the CELL.
SHARE IT
SLIDE VNU4-post-1
This is the fourth Investigation in the LabLearner CELL Examining Nutrition. In this Investigation, students focused on the importance of dietary lipids. They also considered the importance of serving size in nutrition.
______________________________________________

SLIDE VNU4-post-2
A. Begin the analysis of the Lab by helping students to remember the experiments they conducted. The following questions may be helpful in prompting student discussion:
1. Ask students: What did you investigate during the Lab? Students should indicate that they investigated the total amount of fat in food items.
2. Ask students: Can you summarize what you did in the experiments? Students should indicate that they measured the grams of fat contained in two food items using shortening to represent the fat.
______________________________________________
SLIDE VNU4-post-3
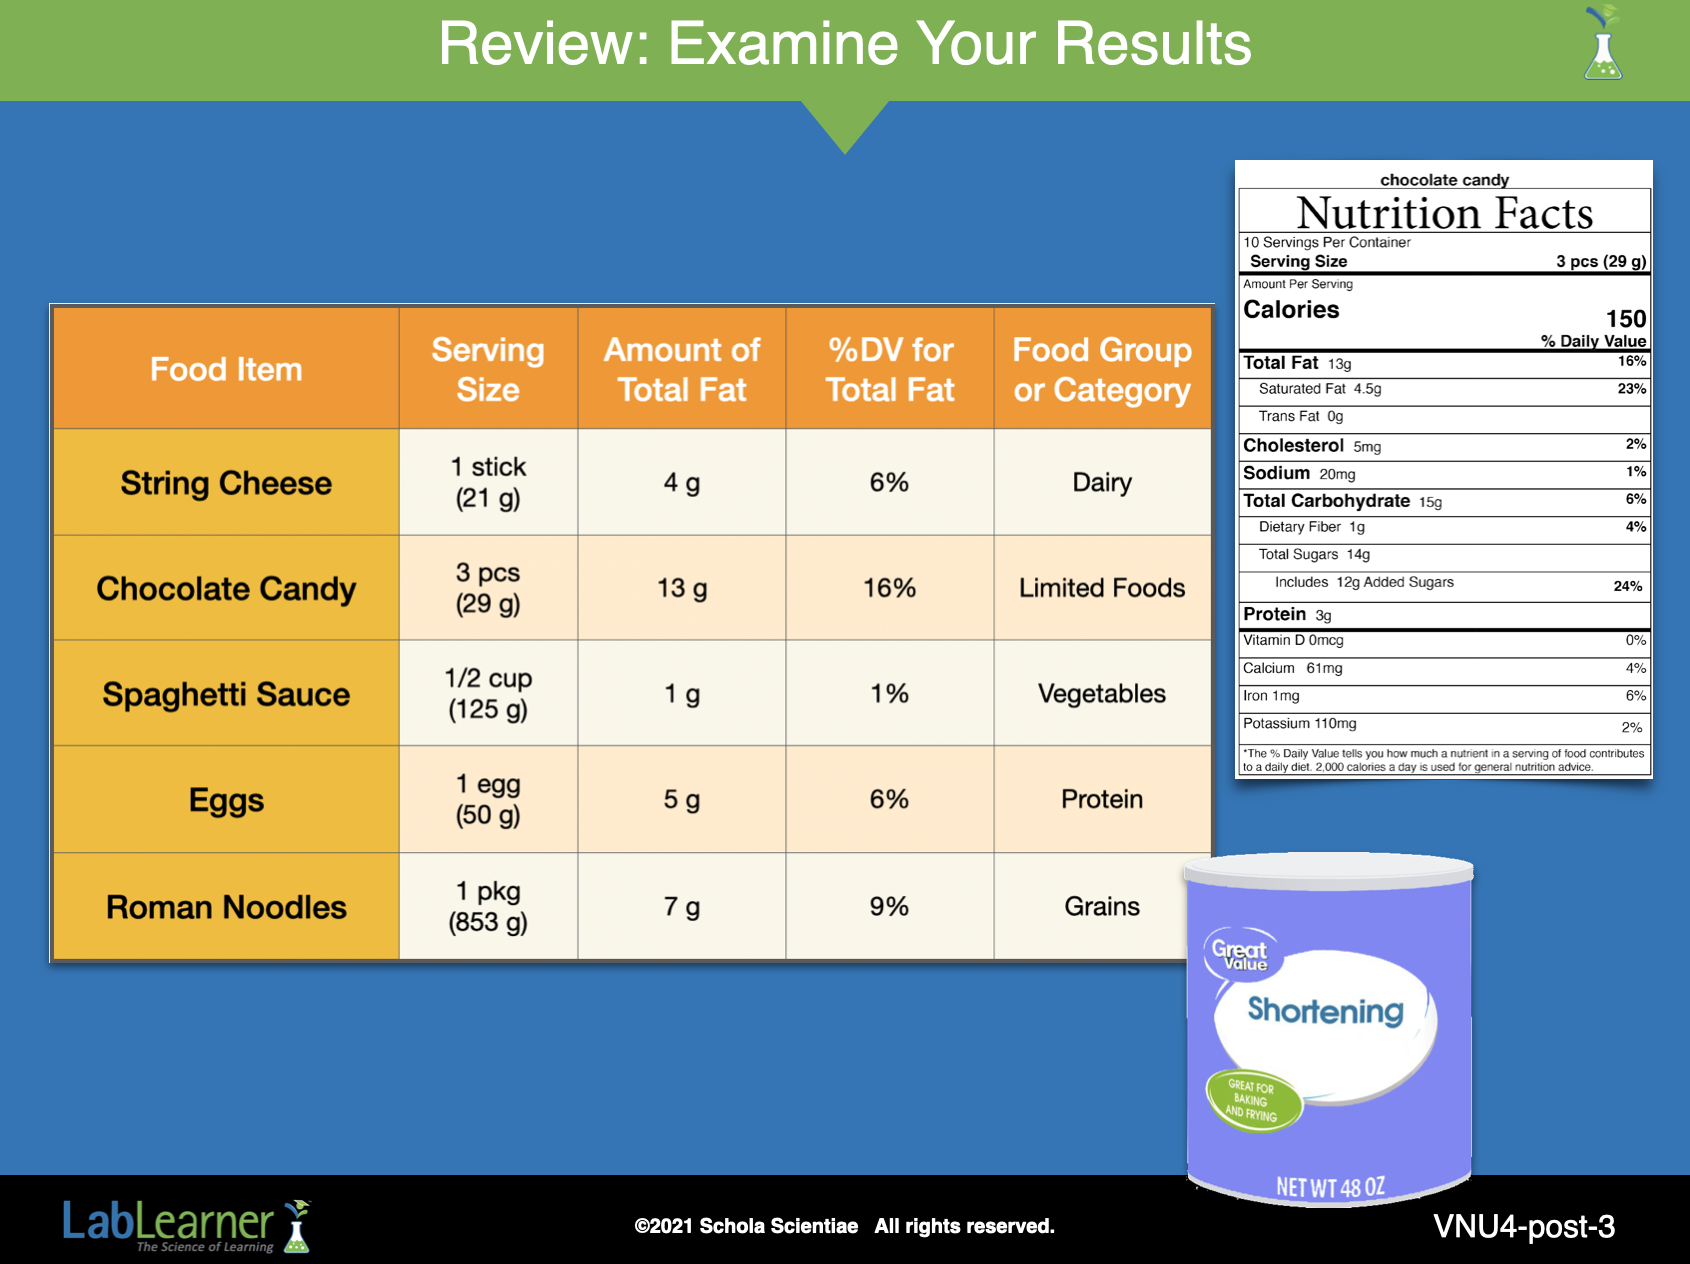
B. Review the experiment and analyze the data contained in the Table in Problem 2a of the Student Data Record to help students understand how the fat content of foods can differ. Use the following instructions and ask students the questions that follow to aid in initiating student discussion. Students may wish to refer to their Student Data Record.
1. Ask students: What did the shortening you measured in the lab represent? The shortening used in the Lab experiment represented the mass of the total fat contained in the food items.
2. Ask students: What types of fats were included on the nutrition label as part of a person’s total fat intake? Saturated fat and trans fat were likely listed. Polyunsaturated fat and monounsaturated fat may also have been listed.
3. Encourage students to locate their nutrition labels in the Student Data Record. Tell them to observe the section for fats on the label.
Ask students: Do the fats listed in the section add up to the Total Fats listed on the label? Can you explain why? The fats do not add up to the Total Fats on the nutrition label. There are other types of fat besides what is listed on the label.
4. Ask students: Did the experiment focus on the different types of fat or the total amount of fat in the food items? The experiment focused on the total amount of fat in food items.
5. Ask students: Did you predict that your food item had more or less fat than it actually contained? Student answers will vary.
6. Ask students: How does the fat content of the two items you investigated compare to the other groups’ items? Student answers will vary.
a. Instruct students to locate the Table in Problem 4 of their Student Data Record. Students should notice that they have information for two of the five items, but are missing information for the other three food items.
b. Direct each group to share the two food items they investigated and the information about serving size, fat amount, %DV for the fat, and food group or category to which each food belongs with the class. Students should record the data in their Table in Problem 2a as it is presented.
______________________________________________
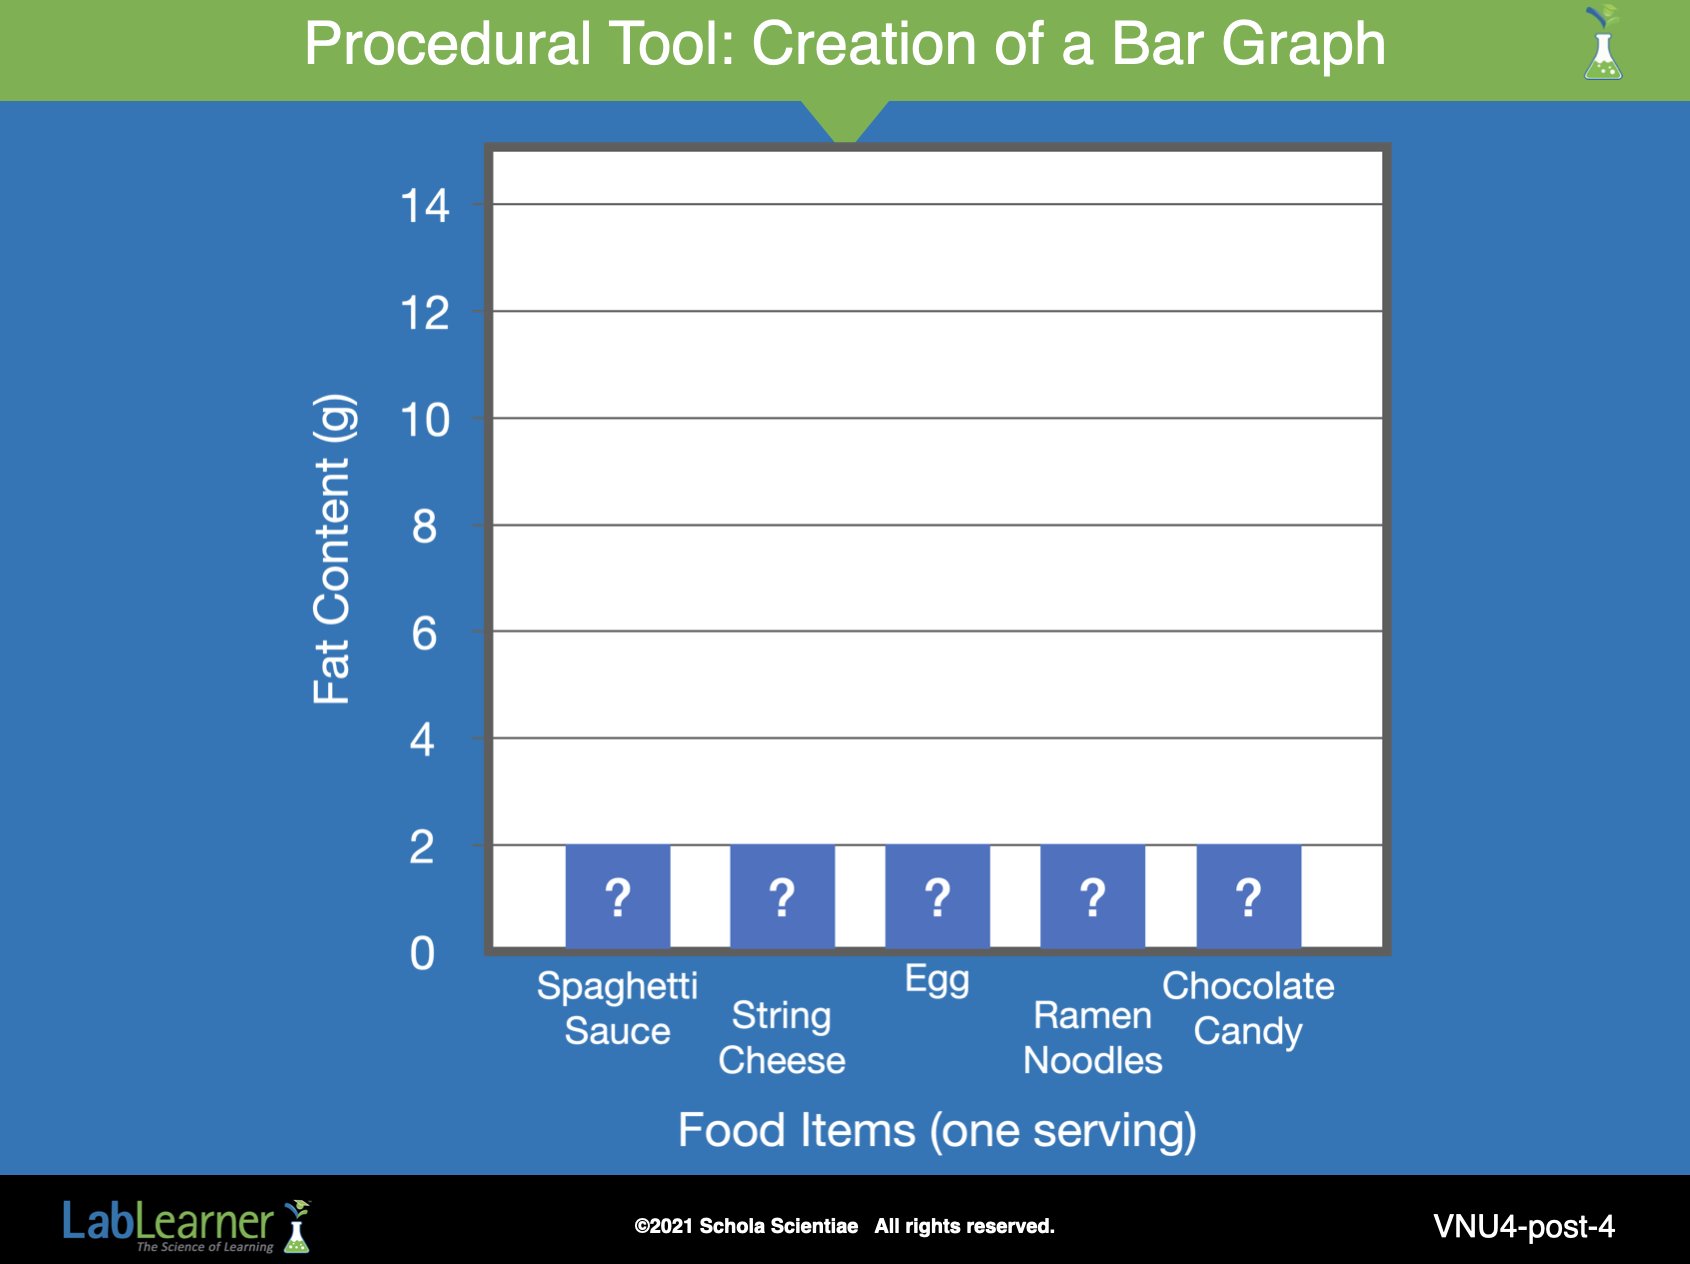
SLIDE VNU4-post-4
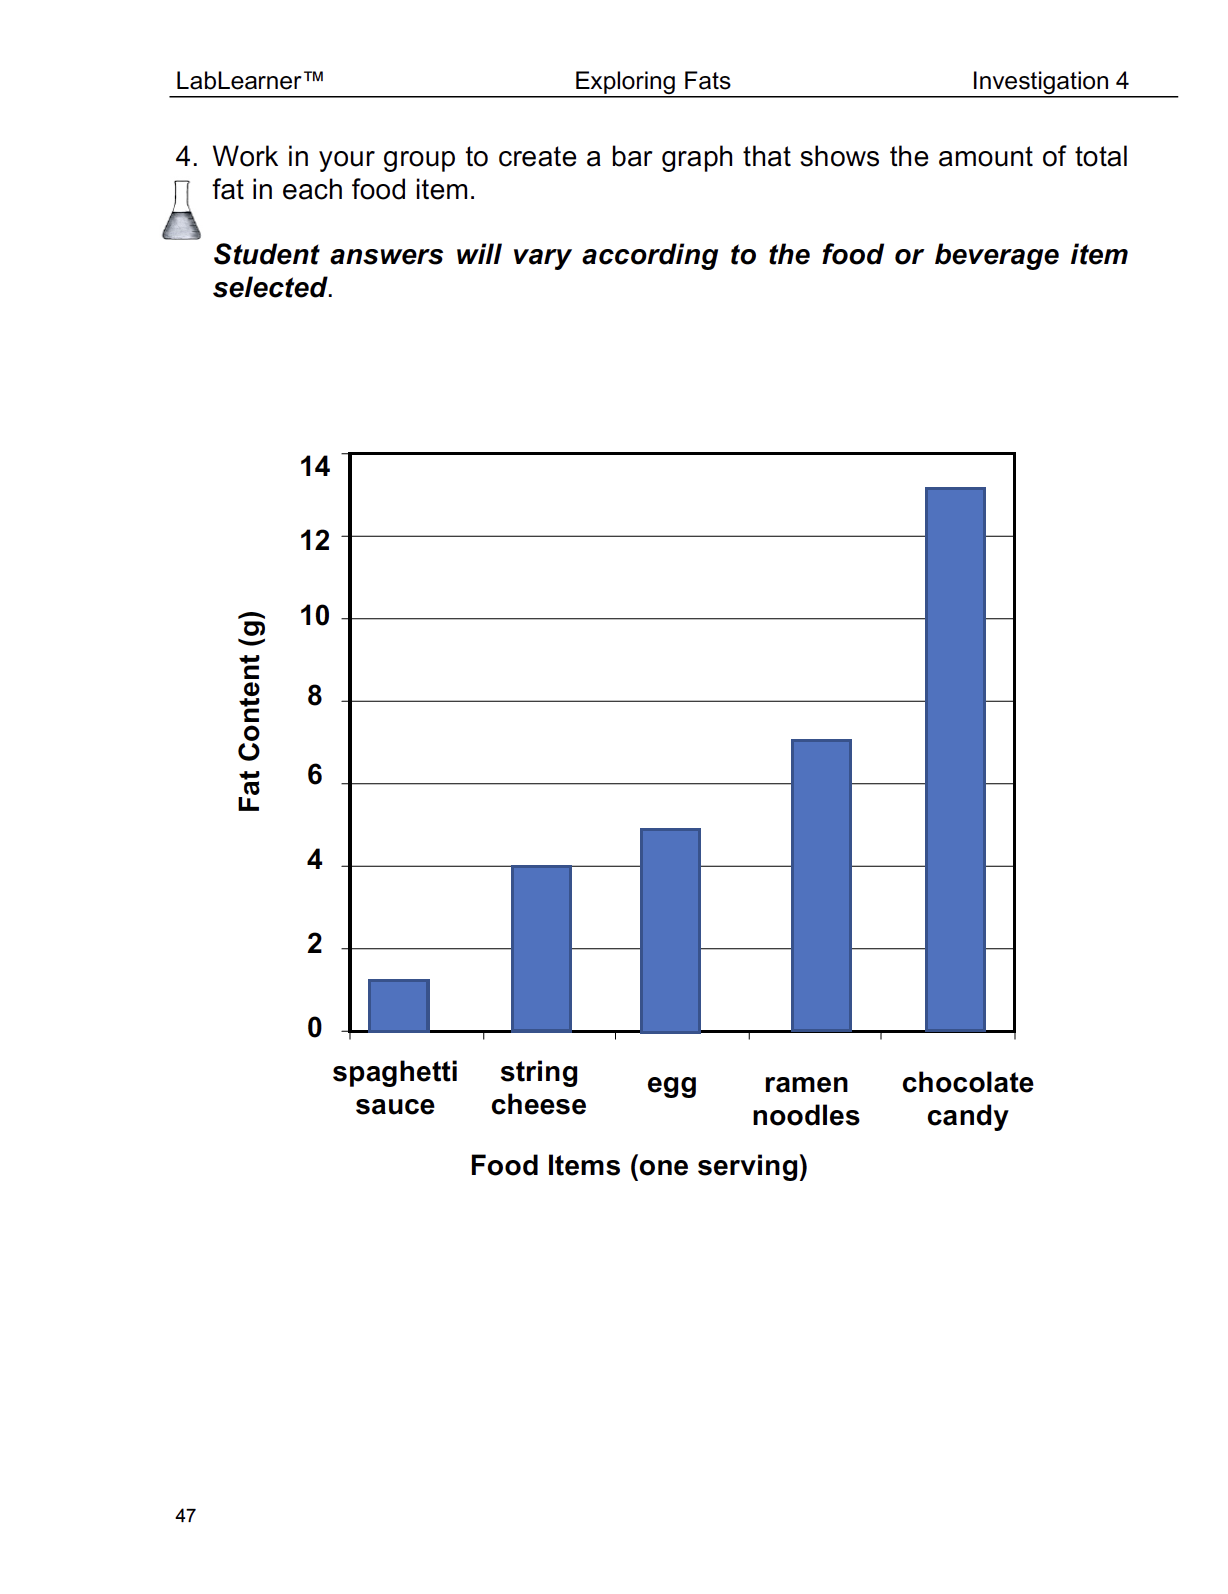
C. Ask students: How could you arrange the data to show the difference in the fat content of the five food items? Student answers may vary.
- Guide students toward realizing that they can use a bar graph to show this information.
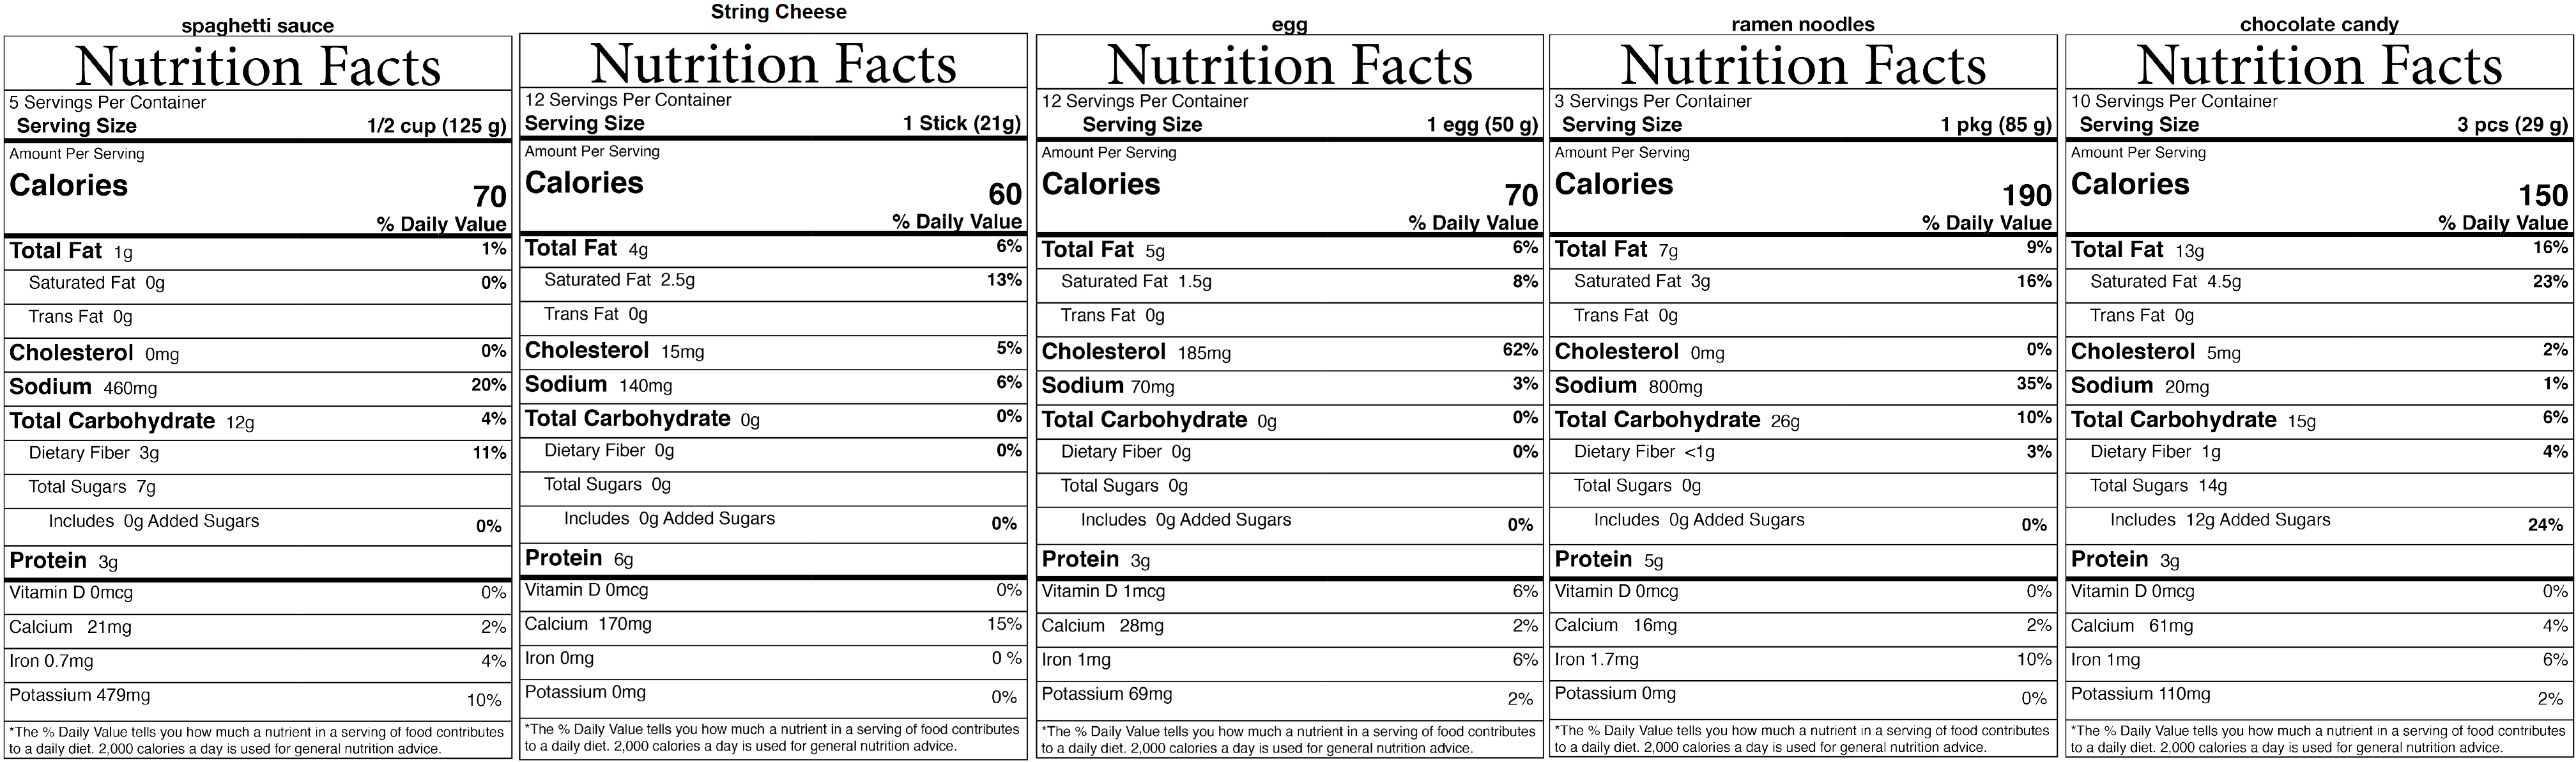
Note to Teacher: The answers and data that follow come from the nutrition labels from the Investigation Four Supplement Pages (shown below). Students’ answers may differ slightly if other foods were used during the Lab.
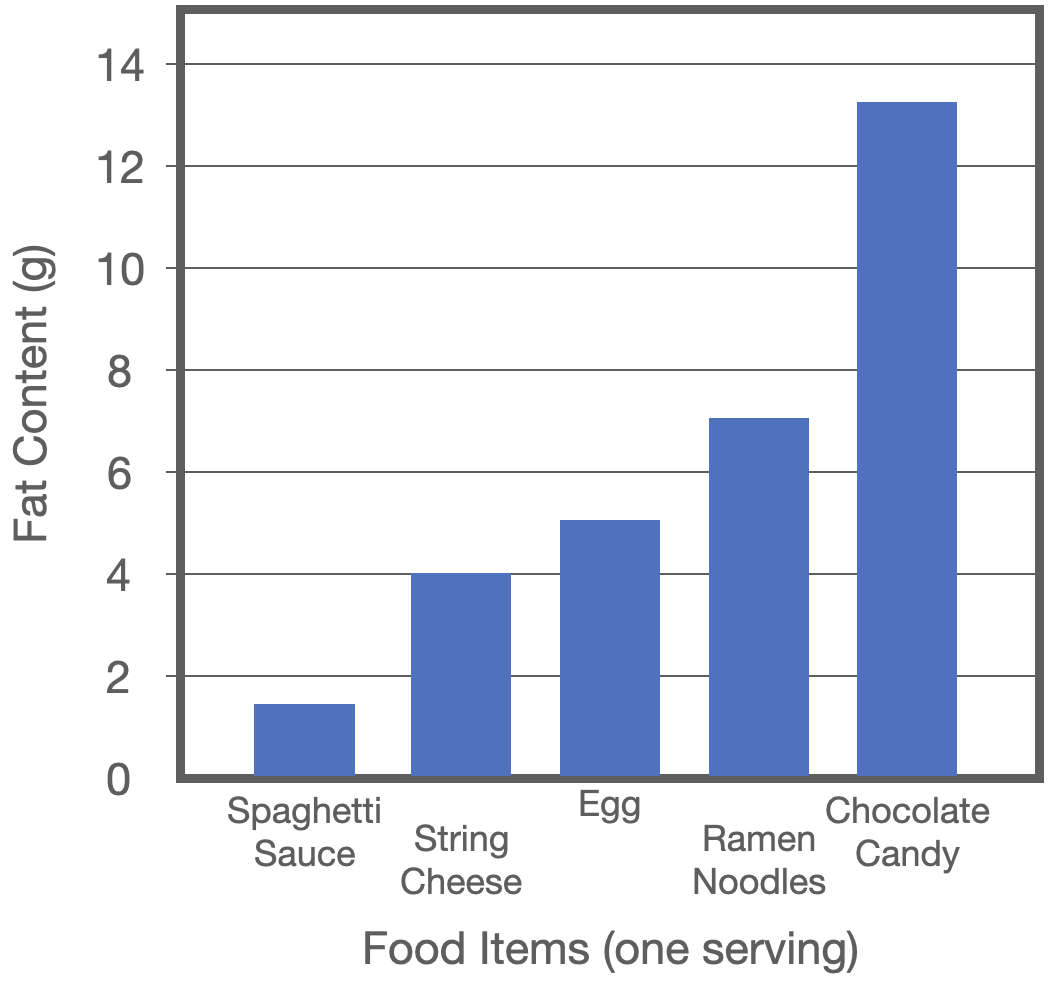
Note to Teacher: The completed Bar Graph below is NOT included in the Student Portal:
1. Organize students into five groups. Ask them to locate Problem 4 of their Student Data Record.
2. Creation and Completion of a Bar Graph is a tool from the Procedural Toolbox that students will likely have seen modeled in previous CELLs. However, this activity may be the first time students have been asked to use this tool independently. Students may refer to their Procedural Toolbox as they create their graph, but it may be necessary to remind students of what they should consider when creating their bar graph. The following information is a list of the steps students should consider:
a. Locate the x-axis and a y-axis. The x-axis is the horizontal axis. The y-axis is the vertical axis.
b. Evaluate your data. Determine which variable you will plot along the x-axis and which variable you will plot along the y-axis.
c. In experiments, there is a variable changed by the person doing the experiment and a controlled variable that is measured by the person doing the experiment. Typically, scientists place the variable they control on the x-axis.
d. Think about what you controlled in this Trial.
e. Typically, scientists place the variable they measure on the y axis. Think about what you measured in this trial.
f. Label your axes.
g. Determine the beginning and ending numbers you will plot on the x-axis and y-axis. The beginning and ending numbers should be selected so that you can plot all of your points on the graph.
h. Determine the scale for each axis. A scale is the difference between numbers. For example, you may wish to include all numbers between your beginning and ending numbers. You could also create a scale that only uses numbers that are multiples of each other.
i. Graph the data.
______________________________________________
SLIDE VNU4-post-5
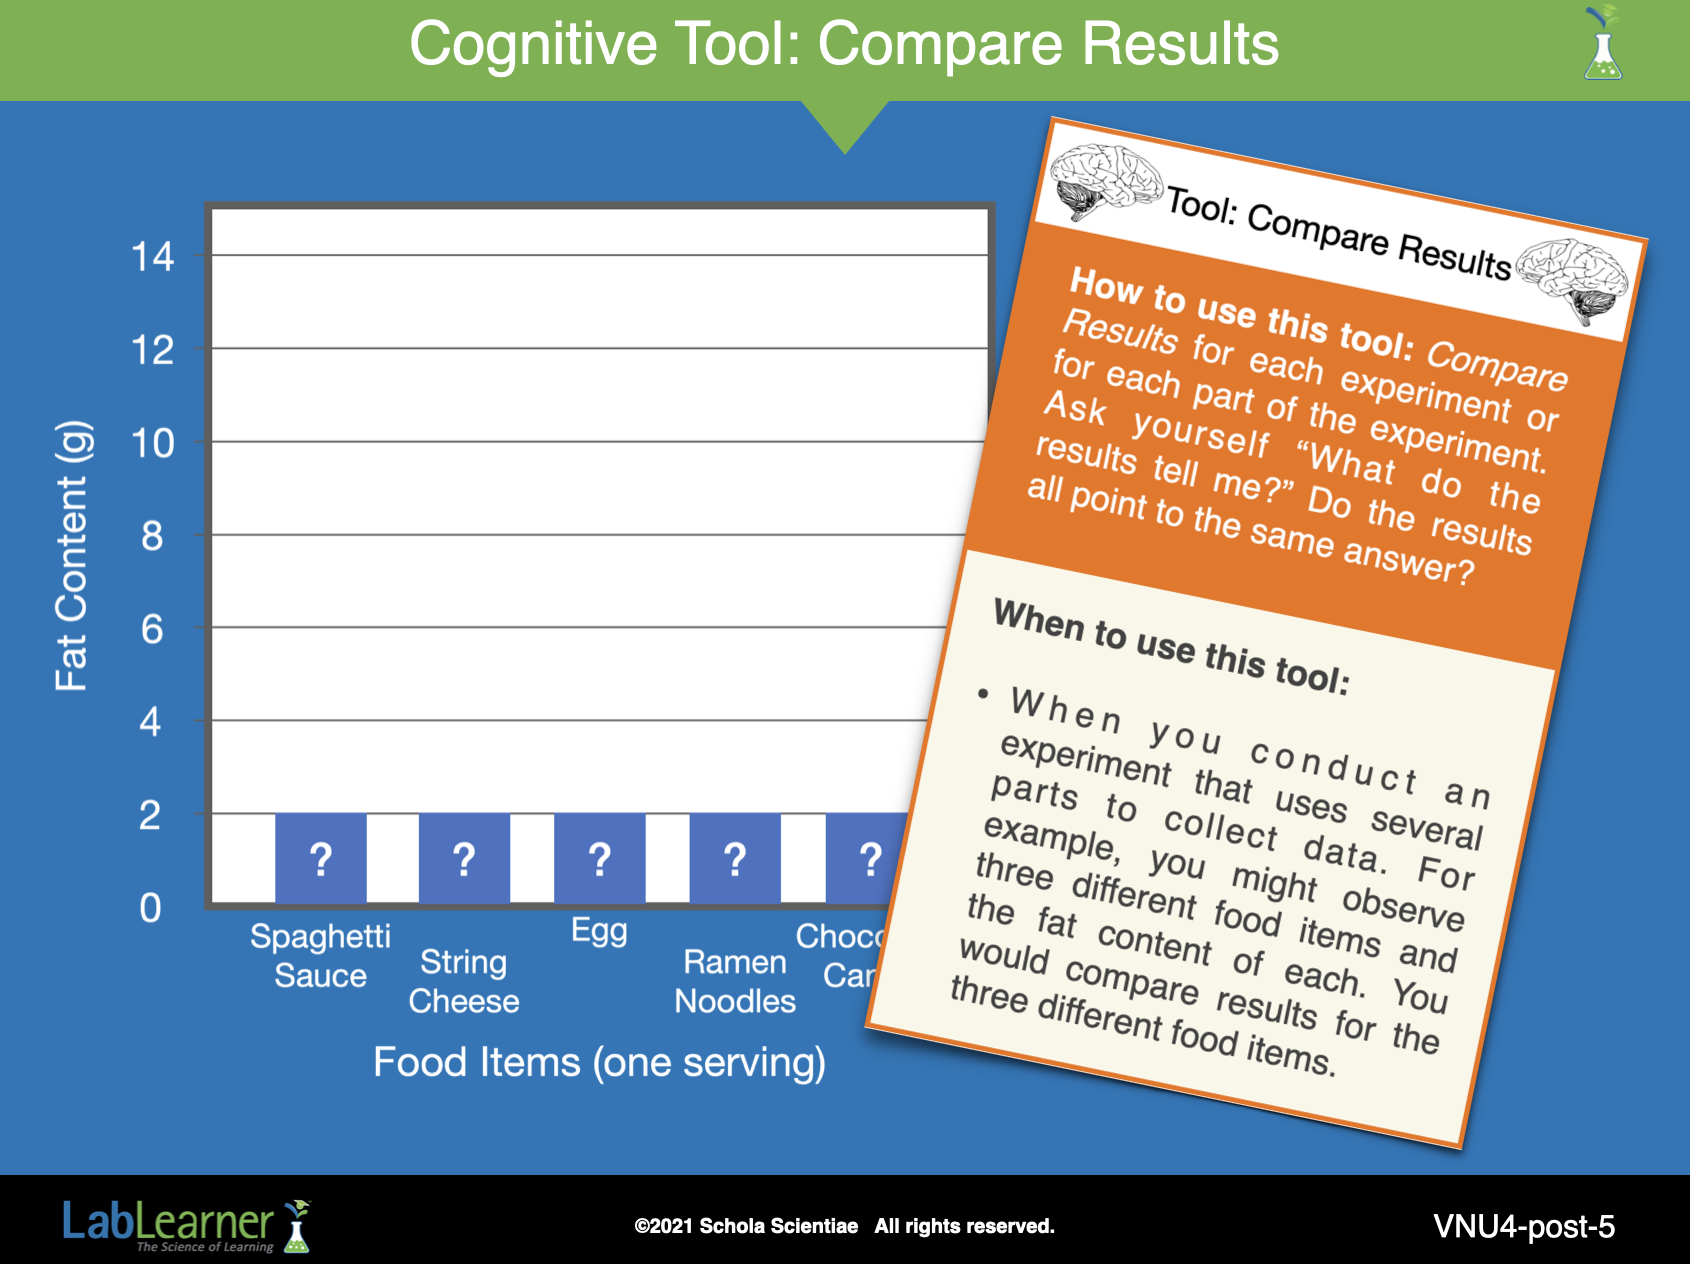
It is important for students to understand that they should carefully inspect the results when presented as a Bar Graph, as well as when presented as a Table. Model how to Compare Results when looking at a bar graph. Lead students through the process.
a. Explain that they can compare the results from their experiments by looking at the Bar Graph.
b. Direct students to first look at the x-axis. This shows the food items that are being described.
c. Ask them to look at the y-axis. This shows the fat content of each food in grams.
d. Explain to students that they can now choose what they want to compare. For example, they may choose to compare the fat content of spaghetti sauce with the fat content of string cheese.
e. Ask students: How do they compare? Students should indicate that the spaghetti sauce has 1 gram of fat, but string cheese has four.
f. To complete the process of comparing results, invite students to make a comparison between two food items of their choice.
3. Use the following questions to discuss the results shown in their completed Bar Graphs. Note: The answers and data that follow once again come from the nutrition labels from the Investigation Four Supplement Pages included on the previous slide. Students’ answers may differ slightly if other foods were used during the Lab.
a. Ask students: Which food item contained the most fat per serving? Which contained the least fat per serving? Students should indicate that the chocolate candy contained the most fat per serving and the spaghetti sauce contained the least fat per serving.
b. Ask students: Could you show the %DV of fat for each item with your bar graph? If time permits, allow students time to work in their groups to examine how they could accomplish this. Student answers may vary. The %DV for each item could be recorded at the top of the bar graph.
______________________________________________
SLIDE VNU4-post-6
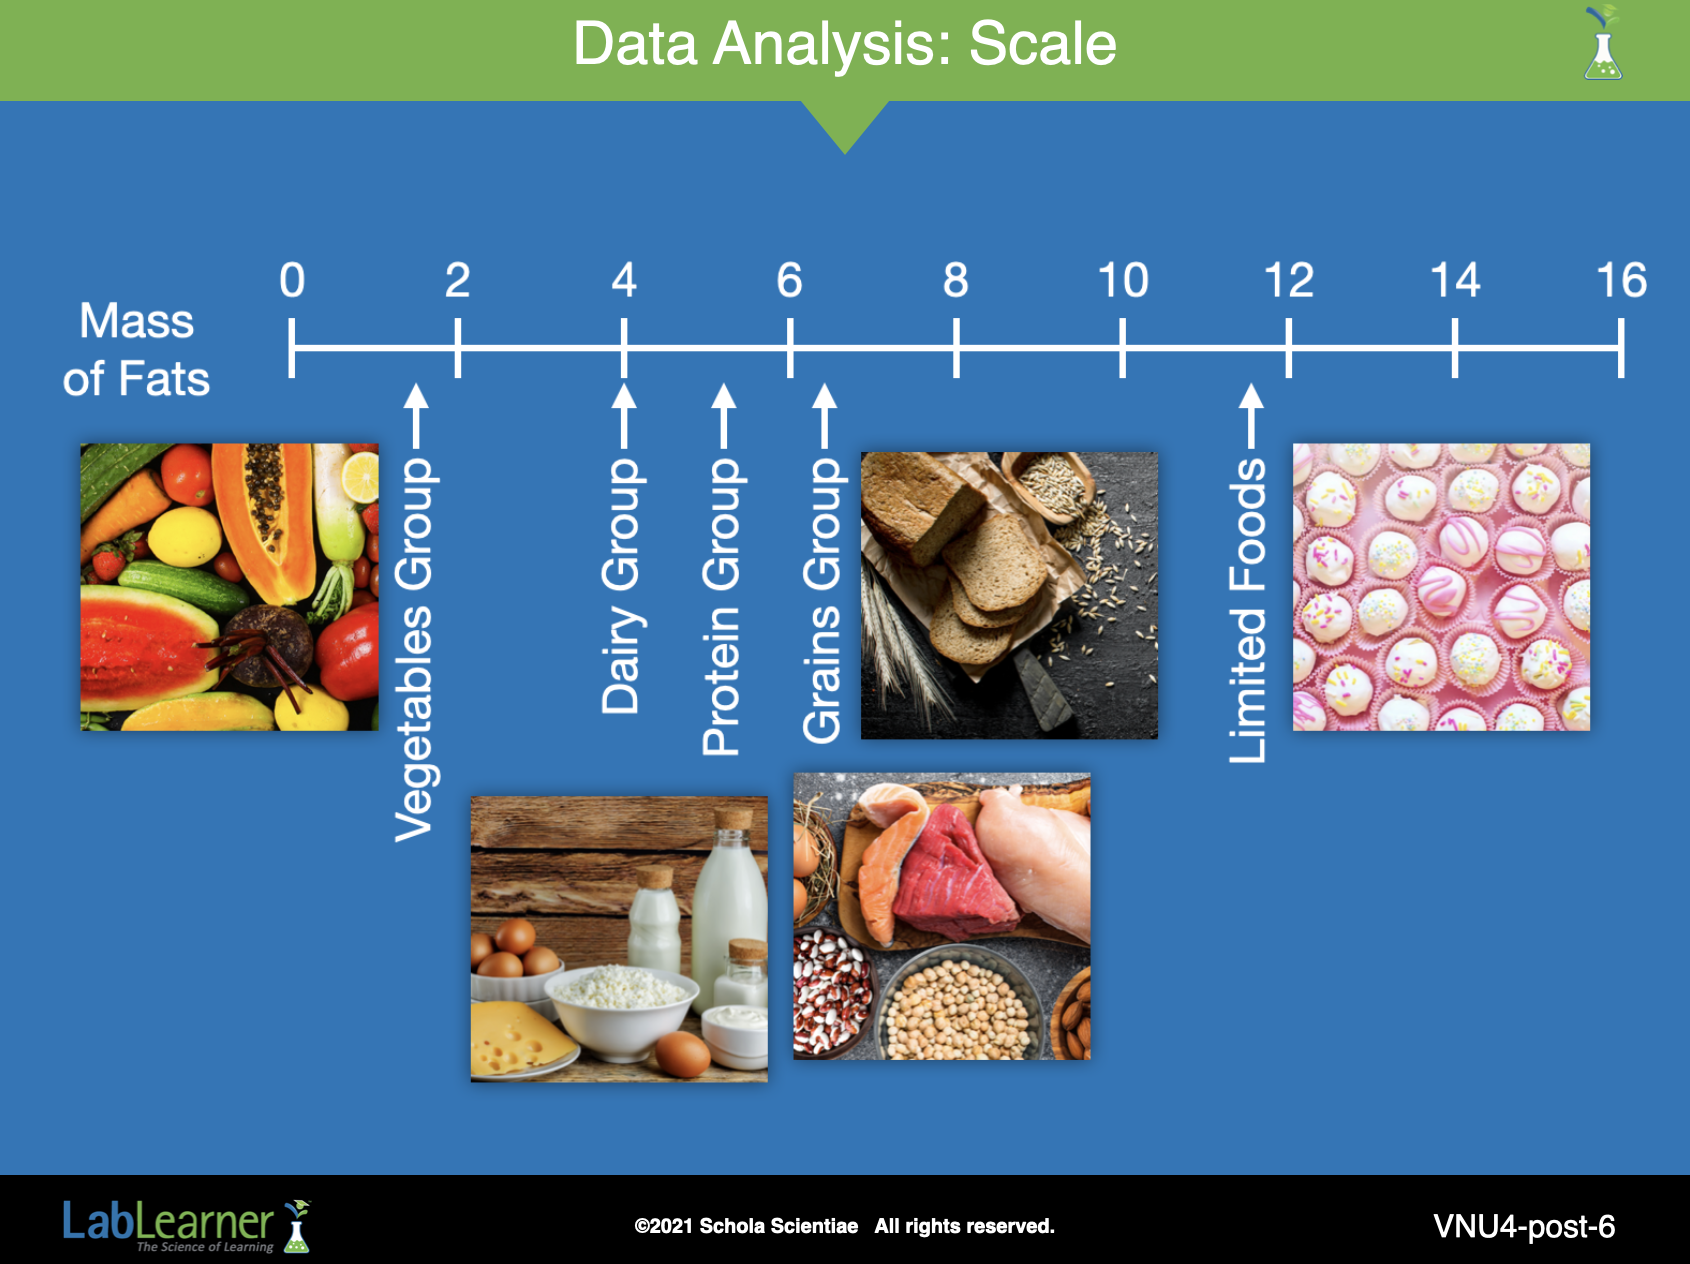
c. Can you make any conclusions about which food groups or categories contain the most fat from your graph? How else might you show the differences in the fat content of the food groups or categories represented in your experiment?
- Explain that one way to illustrate the trend is with a scale. Look at the example on the slide. The example need not be exact in spacing. It is only to be used to give students a visual representation of the data from the table.
- Ask a student volunteer from each group to insert the data from their experiment on the scale. Permit students to choose to either write or draw their representations.
- Ask students: Does the scale help you draw a conclusion? What is your conclusion? Students should indicate that the items they investigated from the vegetables, dairy, and protein groups had less fat per serving than the grains group and limited foods category.
d. Ask students: Do you think that the foods you investigated contain the same amount of fat as all of the foods in that food group or category? Could the information from your experiment be used to draw conclusions that would be true for all foods in a food group or category? What would you suggest doing in order to draw some general conclusions? Student answers may vary. Students should suggest that drawing a conclusion about every food in a food group or category just from the one food item they tested in the Lab may not be a wise decision. Students should suggest that in order to draw more sound conclusions, they should test more food items from each food group or category in order to determine whether the trend they observed above is true.
e. Explain to students that when scientists tested many, many items in each food group or category, they found that:
- foods in the vegetables and fruits groups typically have less fat than the other groups.
- the limited foods category and oil group typically have more fat than other food groups or categories.
- for foods in the dairy, protein, and grains groups the amount of fat varies depending on the item.
______________________________________________
SLIDE VNU4-post-7
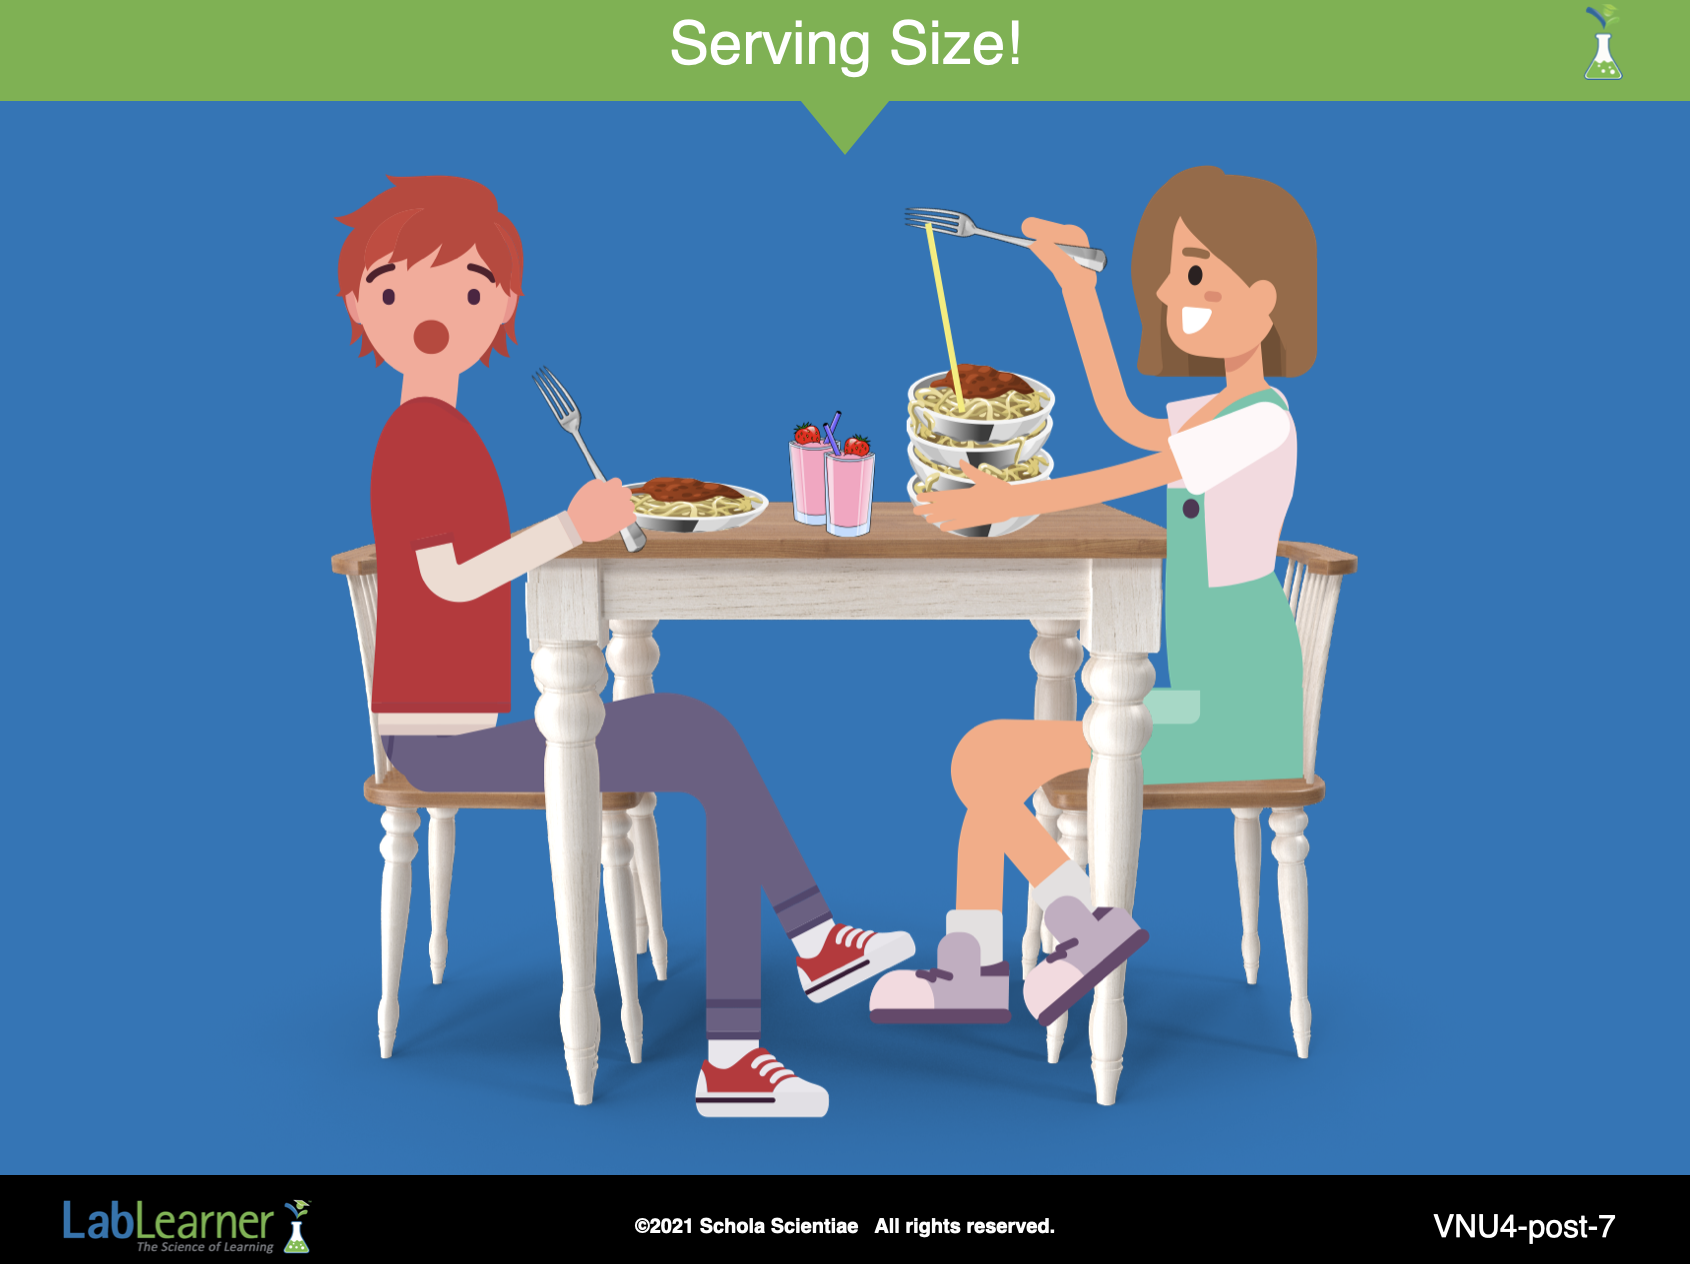
D. Encourage students to apply the information they have learned thus far about serving size, fat content, and %DV to the food items that they investigated in Lab.
1. Ask students: Is there anything you observed about the serving size of each food item? Students should indicate that each of the serving sizes for the five food items was different.
2. Ask students: How would your fat intake change if you were to eat about the same amount of each food as the spaghetti sauce as compared to only a single serving of the other four foods? The size of one serving of spaghetti sauce is 125 g and contains 1 g of fat. Consuming 125 g of the other four foods would increase the amount of servings that were eaten, which would increase the amount of fat consumed. For example, 125 g of eggs would be equal to 2.5 servings or 2.5 eggs because one egg is about 50 g. Eating 2.5 eggs would increase fat intake to 12.5 g.
3. Ask students: Why do you think it is important to be aware of both the amount of fat per serving of food and the size of the servings? Students should indicate that one serving of a food can be small in size but high in fat. Consuming more than one serving of a particular food high in fat could quickly increase the daily intake of fats to well over 100% of the Daily Value that is recommended.
4. Ask students: Let’s take an example. Jonah chose to eat two sticks of string cheese for lunch and Marissa chose to each one box of ramen noodles. Jonah told Marissa he ate less fat than she did. Is Jonah correct? Why or why not? Jonah is not correct. One serving of string cheese has 4 g of fat. Two servings would be 4 + 4 = 8 g of fat. One serving of the ramen noodles has 7 g of fat. Therefore, Jonah ate more fat than Marissa ate.
______________________________________________
SLIDE VNU4-post-8
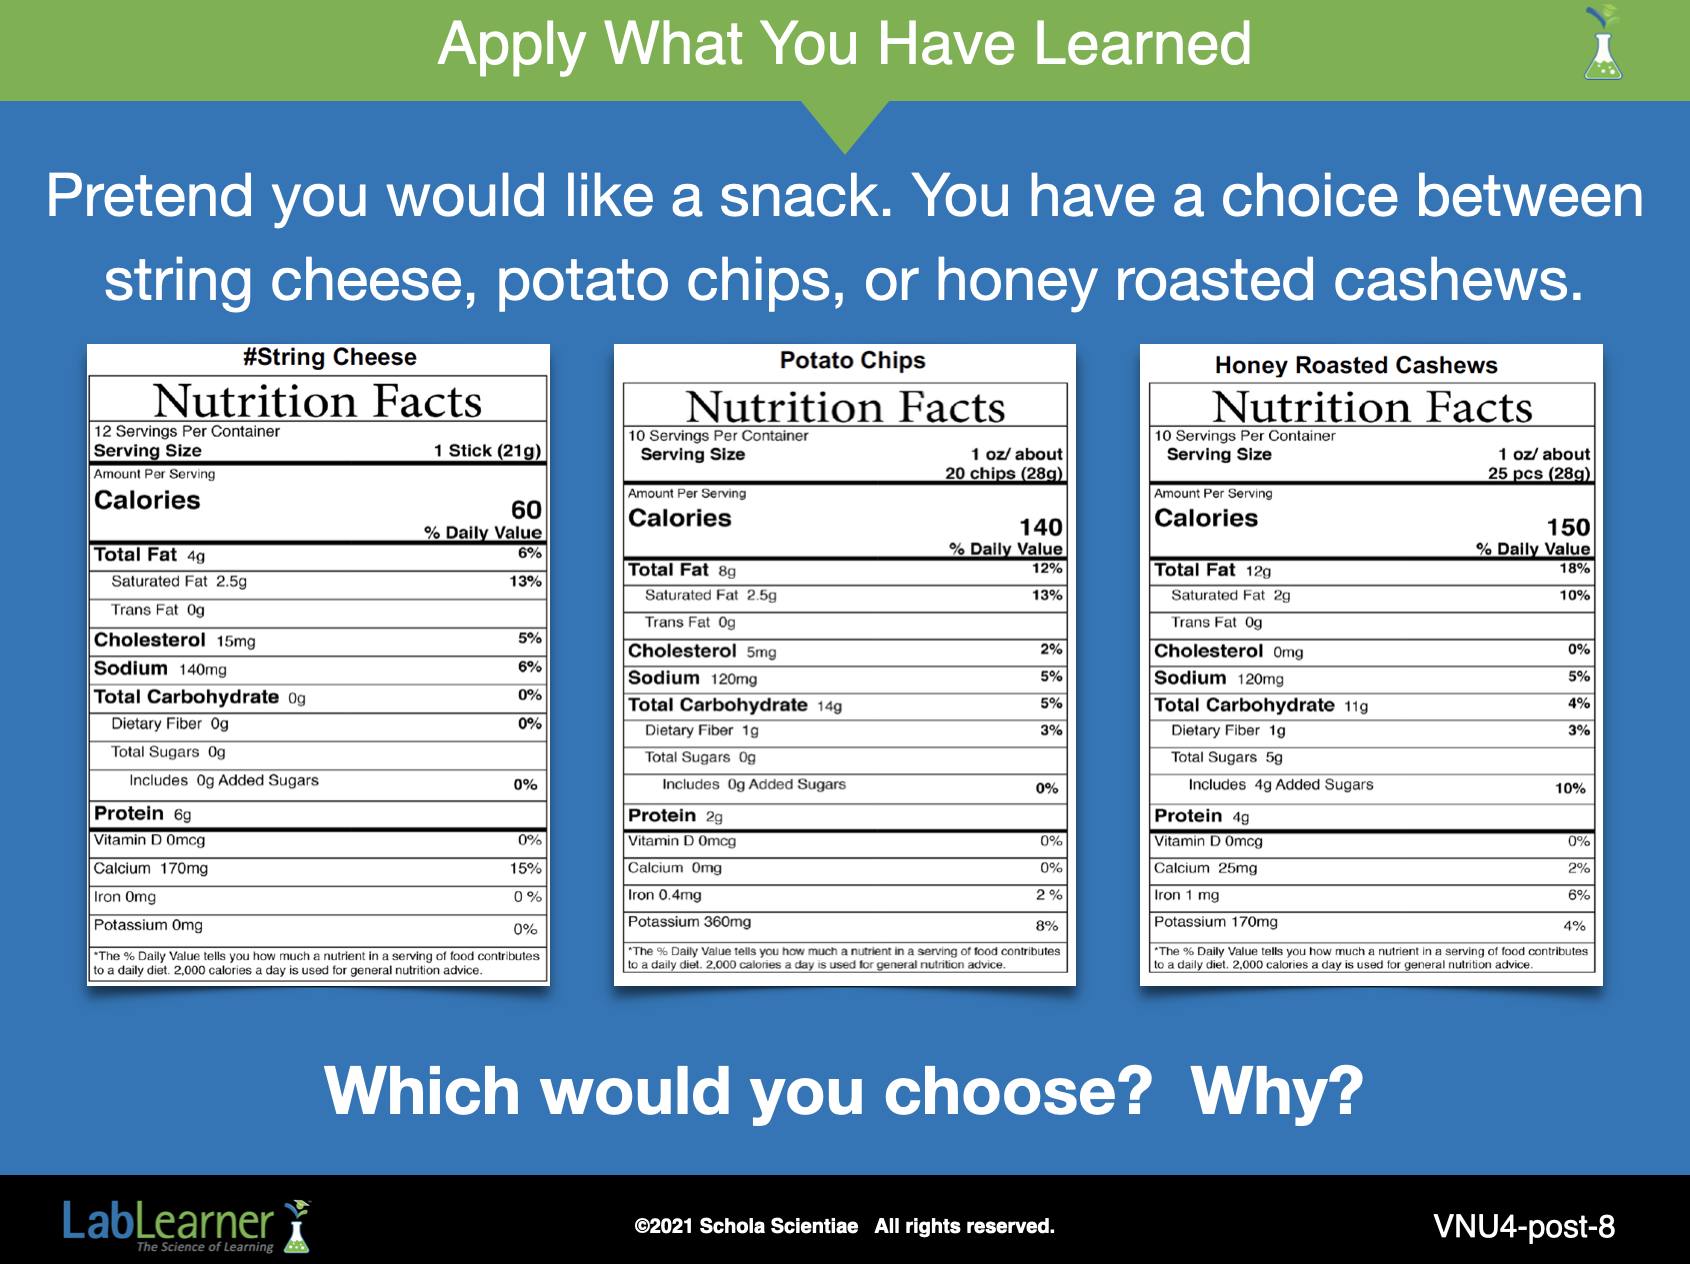
E. Conduct an activity to help students understand how to compare the nutritional value of the foods they eat. Students should work independently during this exercise. Use the information and questions that follow to lead students through the activity.
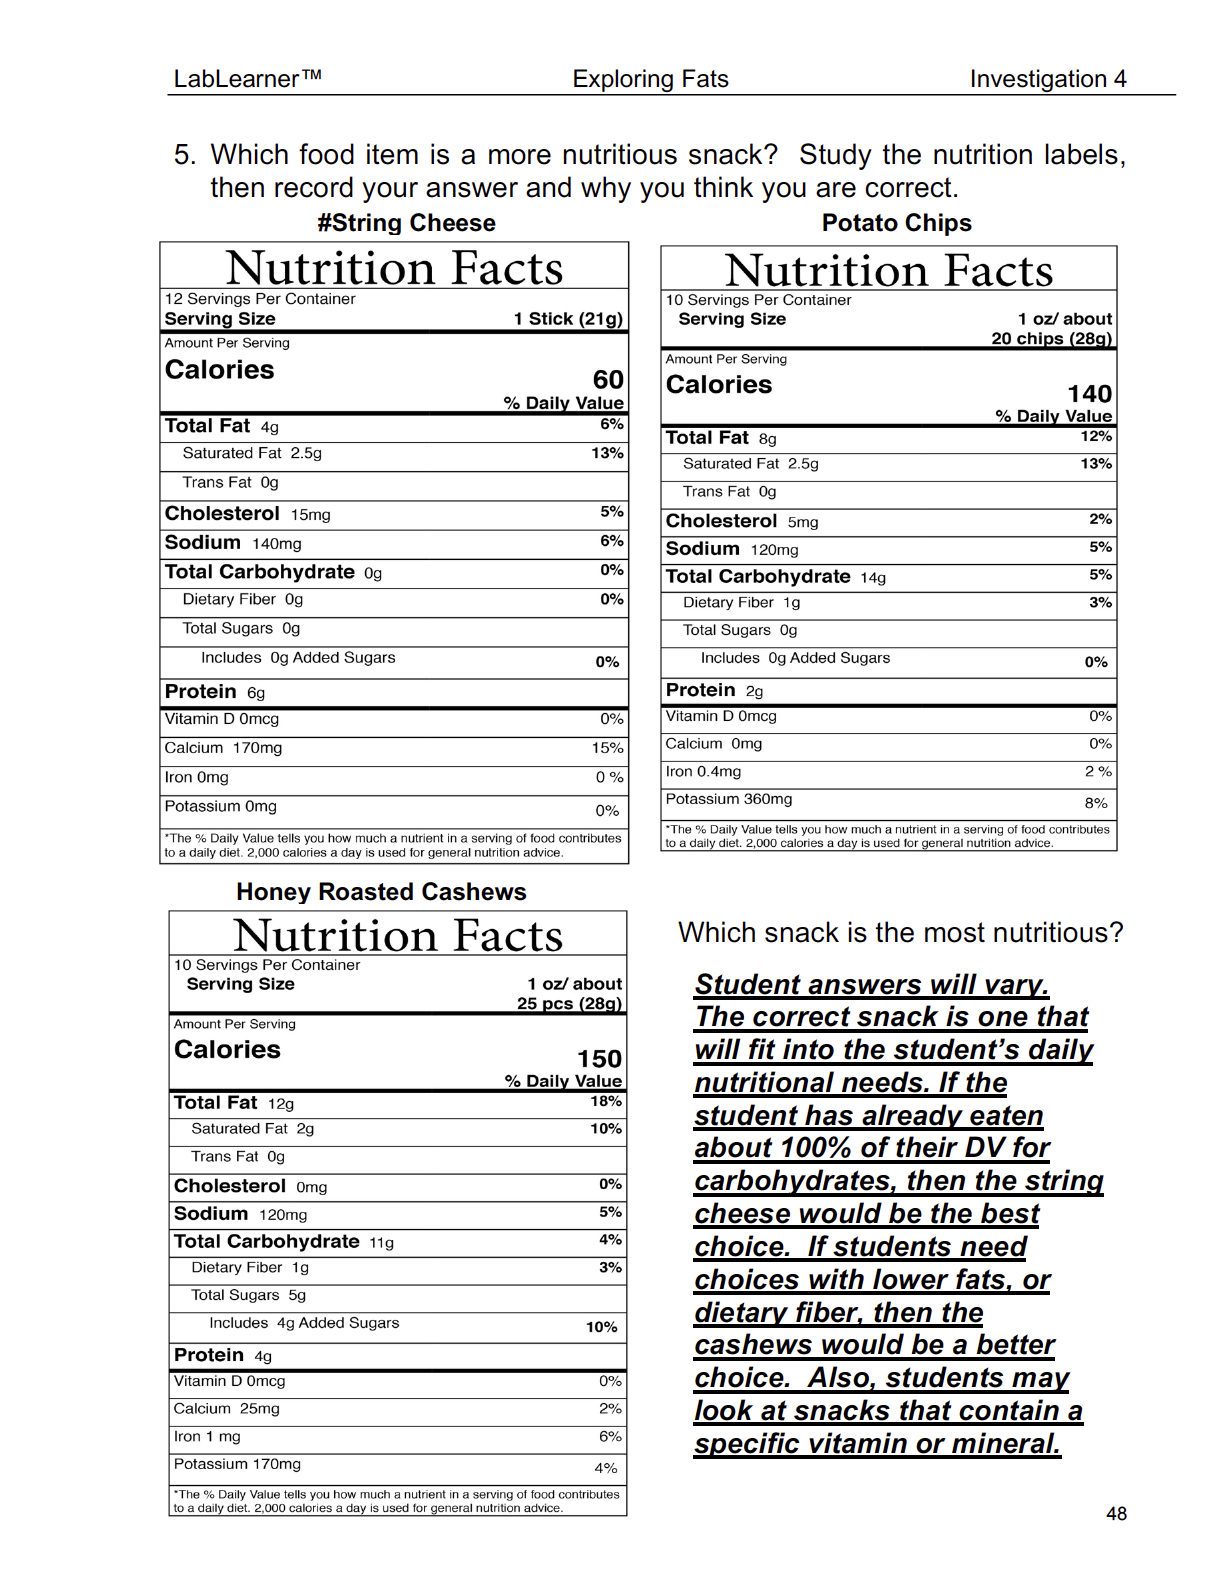
1. Tell students to pretend they would like a snack. They have a choice between string cheese, potato chips, or honey roasted cashews.
Ask students: Which would you choose? Why? Student answers will vary.
2. Direct students to Problem 5 of their Student Data Record.
3. Instruct students to study the nutrition labels of the three snacks. Explain that they are to make a decision about which of the three snacks they believe is the most nutritious. Students should be able to support their decision by identifying the factors that pointed them to this conclusion.
4. Encourage students to record their decision and supporting information in Problem 5 of their Scientist Data Record.
5. When students have accomplished this task, ask for volunteers to share their decisions and what led them to their conclusion.
6. Ask students: What can you conclude about how to make nutritious food choices? Students should conclude that they should consider MyPlate in order to meet the daily recommended requirements of food for each food group or category. They should also compare the nutrition labels of the food they eat to determine the %DV of nutrients in food and the serving size of a food. All three of these pieces of information are needed to make good decisions about nutritious food choices.
______________________________________________
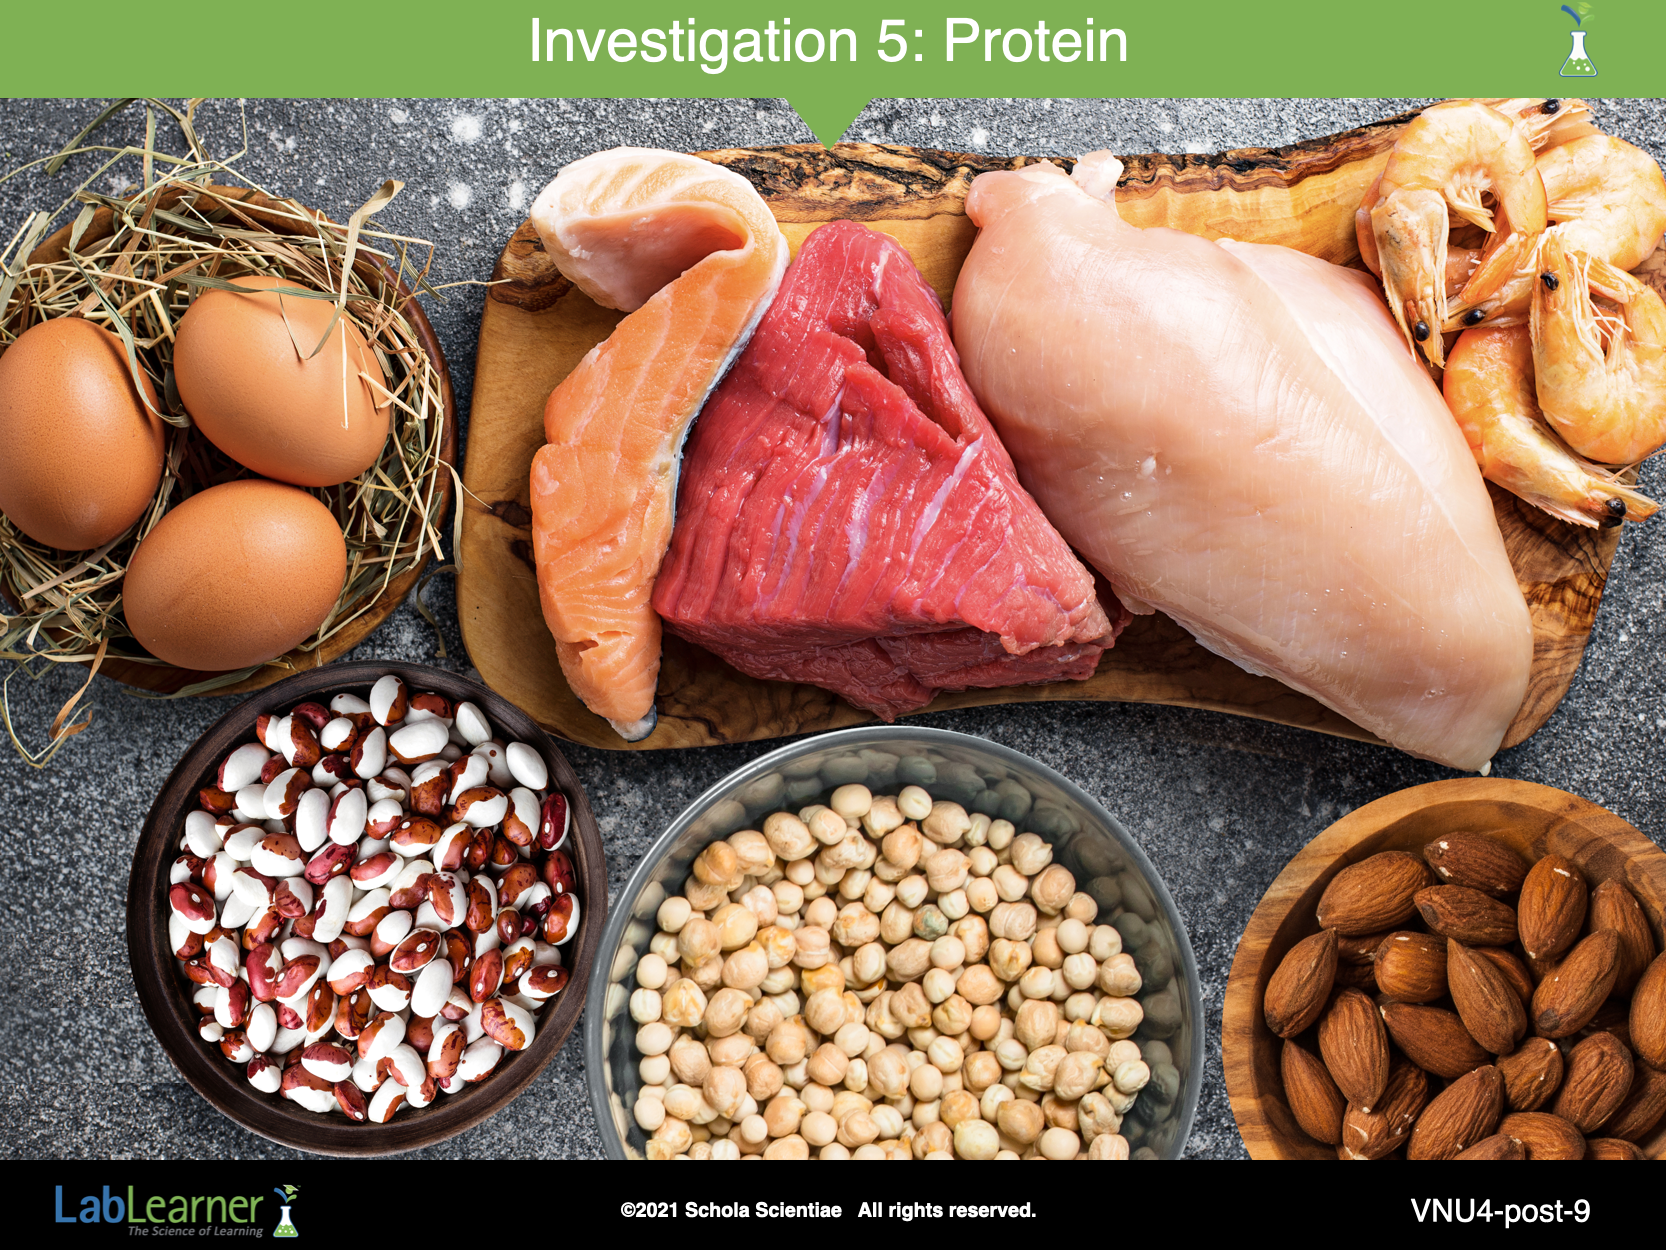
SLIDE VNU4-post-9
F. To complete this Investigation, help students recall the types of nutrients that can be found in foods.
1. Ask students: Which nutrients have we studied thus far? Students should indicate that they have studied carbohydrates and fats.
2. Tell students that they will explore another type of nutrient, proteins, in the next Investigation. Ask students to think about the following questions as they conduct their exploration:
• How much protein is in the foods I eat?
• Is protein found in all the food groups or categories?
KEYS: POSTLAB