Teacher Portal:
Examining Nutrition
Investigation 3 – PostLab
PRINT IT
Use your browser to download a printable PDF as help during the slide presentation and to make additional notes. In your browser, go to File > Print and then choose to save as PDF.
NAVIGATE IT
Once the slide presentation is launched
- use your left and right arrows to advance or go back in the slide presentation, and
- hover your mouse over the left edge of the presentation to get a view of the thumbnails for all the slides so that you can quickly move anywhere in the presentation.
- Click HERE to launch the slide presentation for the CELL.
SHARE IT

SLIDE VNU3-post-1
In this third Investigation of the LabLearner CELL Exploring Nutrition, students will continue their study of nutrition by focusing on carbohydrates.
______________________________________________

SLIDE VNU3-post-2
A. Begin the analysis of the Lab by asking students to summarize the experiments they conducted in the lab and the purpose of those experiments. The following questions may be helpful in prompting student discussion:
1. Ask students: What did you explore during the Lab experiments? Students should indicate that they determined the total amount of carbohydrates and the amount of one type of carbohydrate, sugar, in one of five foods and beverages.
2. Ask students: Can you summarize the types of experiments you performed? Students should indicate that they used table sugar to represent the total carbohydrates in the food item in the first Trial and sugar in the food item in the second Trial. In the first Trial, they measured the mass of total carbohydrates in the food item, and in the second Trial, they measured the grams of sugar contained in the food item. Students also compared the total amount of carbohydrates in the five food items.
B. Continue the analysis of the experiment by helping students draw conclusions about the total amount of carbohydrates in the five food items. Use the following instructions, ask students the questions that follow to aid in initiating student discussion. Students may need to refer to their Student Data Record.
1. Ask students: What did the sugar you measured in the first Trial represent? Students should indicate that the measured sugar represented the total mass of carbohydrates the food item contained.
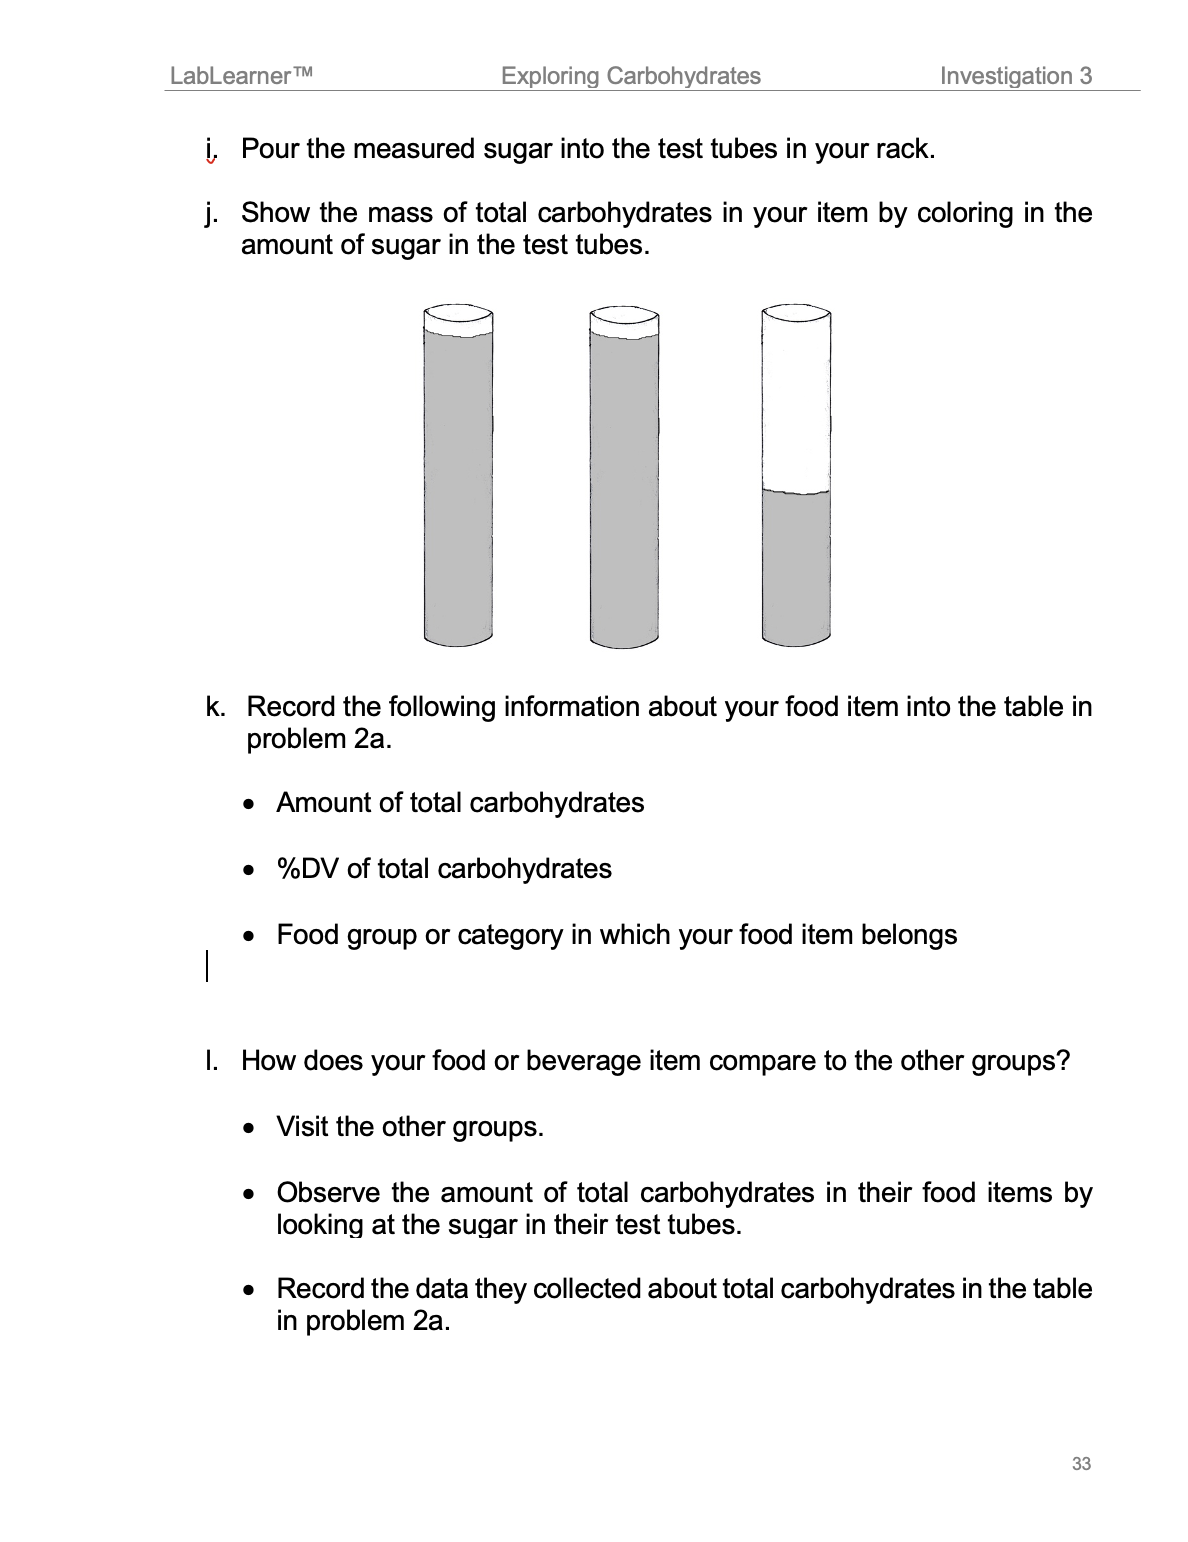
2. Ask students: Why do you think you were instructed to pour the sugar into the test tubes? Students should indicate that placing measured sugar in the test tubes provided an easy way for them to visually compare the amount of carbohydrates contained in each of the five items.
3. Ask students: Did you predict that your food item contained more or less carbohydrates than it actually did? Student answers will vary.
4. Ask students: Did all of the items investigated in the Lab contain the same amount of total carbohydrates? How do you know? Students should indicate that this information can be found in the Table in Problem 2a of their Student Data Record.
______________________________________________
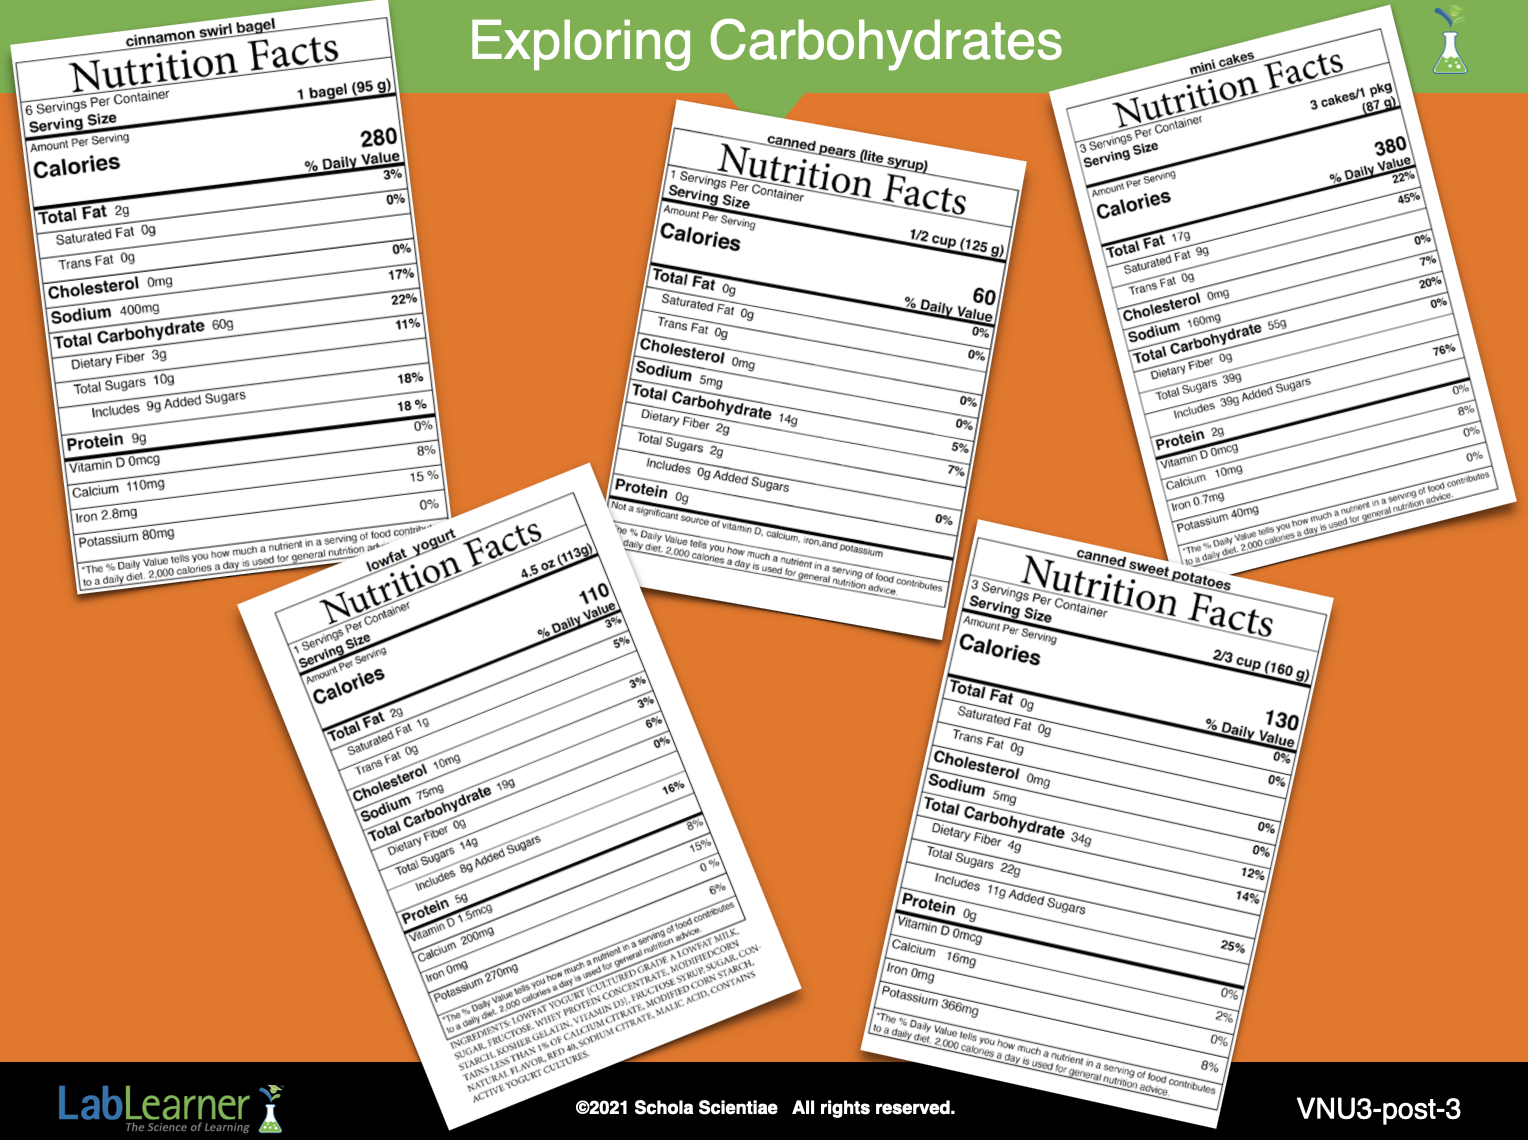
SLIDE VNU3-post-3
5. Ask students: How could you show which of the five food items contained the greatest and the least amount of total carbohydrates per serving of food? Student answers may vary.
a. Assign student groups to work together to create a simple diagram that shows this information. Encourage them to record their results in Problem 4 of their Student Data Record.
b. After they complete the task, instruct student groups to draw their diagrams on the board.
c. Allow each group to present their diagram to the class and present its design.
d. After the groups have presented their design, discuss each group’s diagram as a class and which of the five food items contained the greatest and least amount of total carbohydrates per serving.
e. Ask students: In which food groups or categories are carbohydrates found? Are they found in only one food group or category? Are they found in all food groups or categories? What data do you have that supports your answer?
The answers and data that follow come from the nutrition labels from the Investigation Three Supplement Pages. Students’ answers may differ slightly if other foods were used during the Lab.
Students should indicate that in their experiment, they found that all of the foods contained carbohydrates.
Note to Teacher: The food items students investigated belonged to the following food groups or categories: the dairy, fruits, vegetables, and grains groups and the limited foods category. Thus, almost all of the food groups and categories they investigated contained foods with carbohydrates. The data to support this answer is found in the table in Problem 2a of students’ Scientist Data Record and in the nutrition labels, they examined in the Lab. Although students did not investigate foods from the protein or oil groups many foods within these groups contain carbohydrates.
f. Ask student: Do you think that the protein and oil groups contain carbohydrates? Students should indicate that they would need to research whether foods in the protein and oil groups have carbohydrates.
g. Affirm students’ suggestion that more research would be required to answer the question and then explain that carbohydrates are found within foods in all of the food groups and categories.
______________________________________________
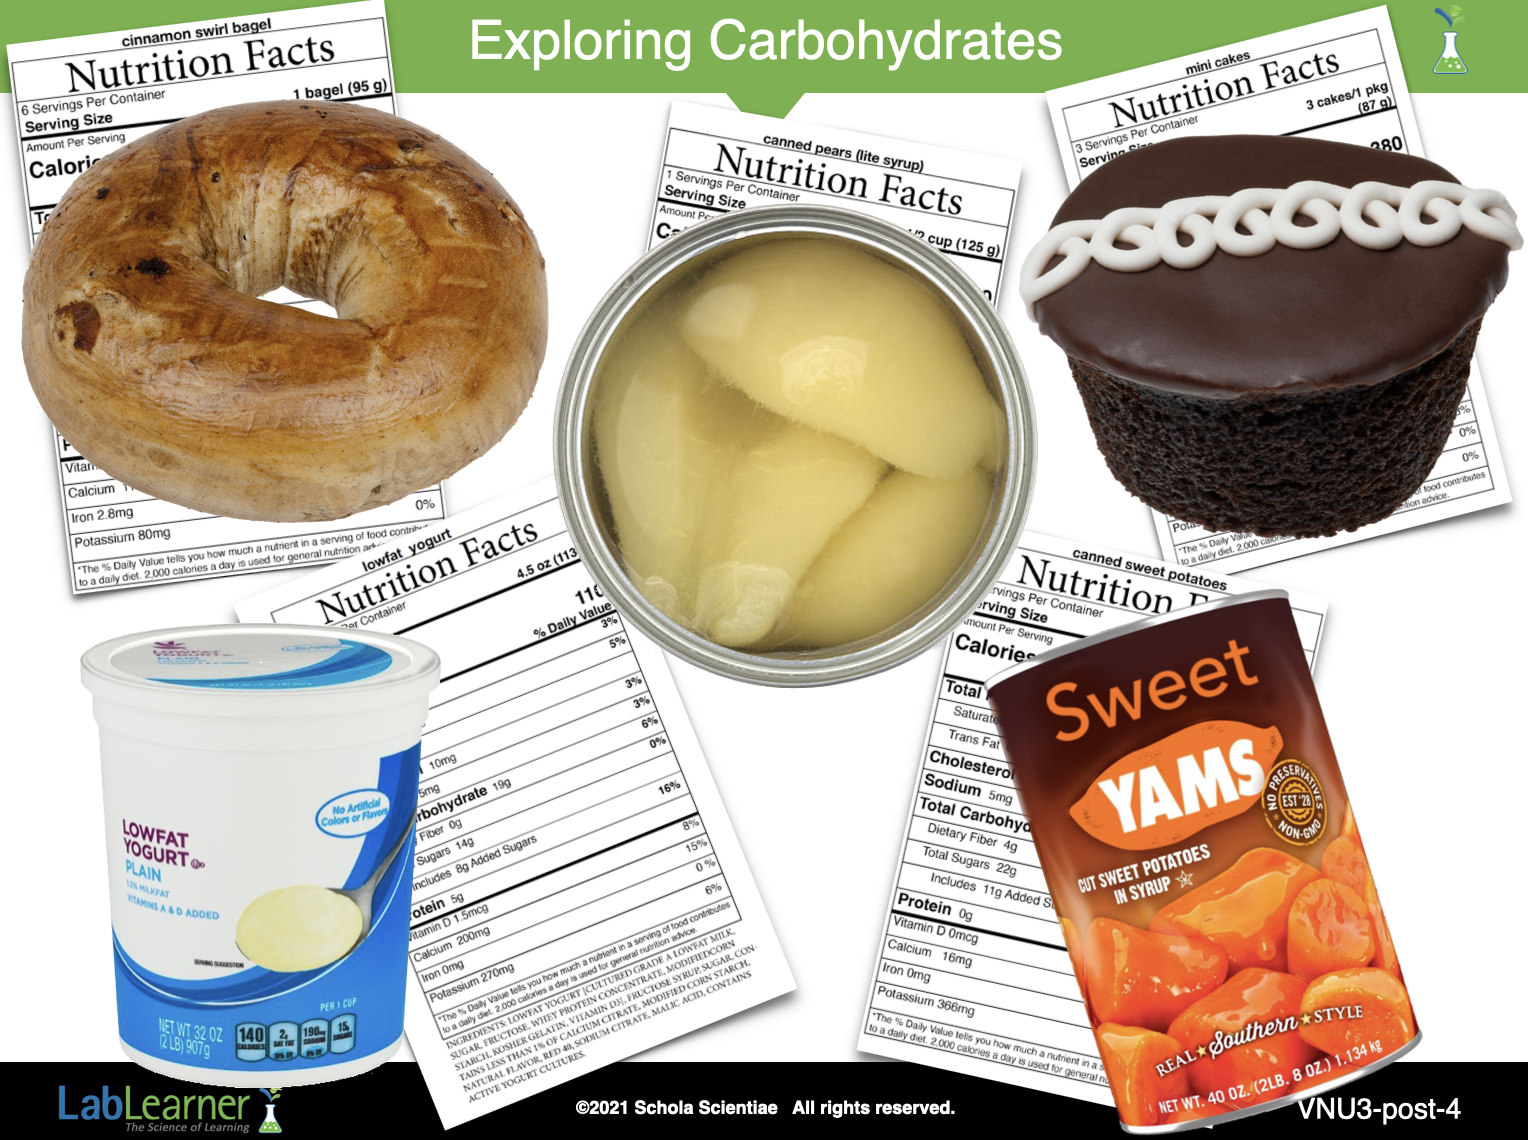
SLIDE VNU3-post-4
C. Continue the analysis of the experiment by helping students draw conclusions about the amount of sugar in the five food items.
1. Ask students: How could you organize the class data about the amount of sugar and added sugar found in the five food items?
a. Provide students some time to suggest various possibilities.
b. After discussing some of the students’ ideas, tell students that there is a way to display their data so they can look at all of the results at the same time. They can visually organize their data by completing a Data Table. Completion of a Data Table is a tool from the Procedural Toolbox that students will likely have seen modeled in previous CELLs.
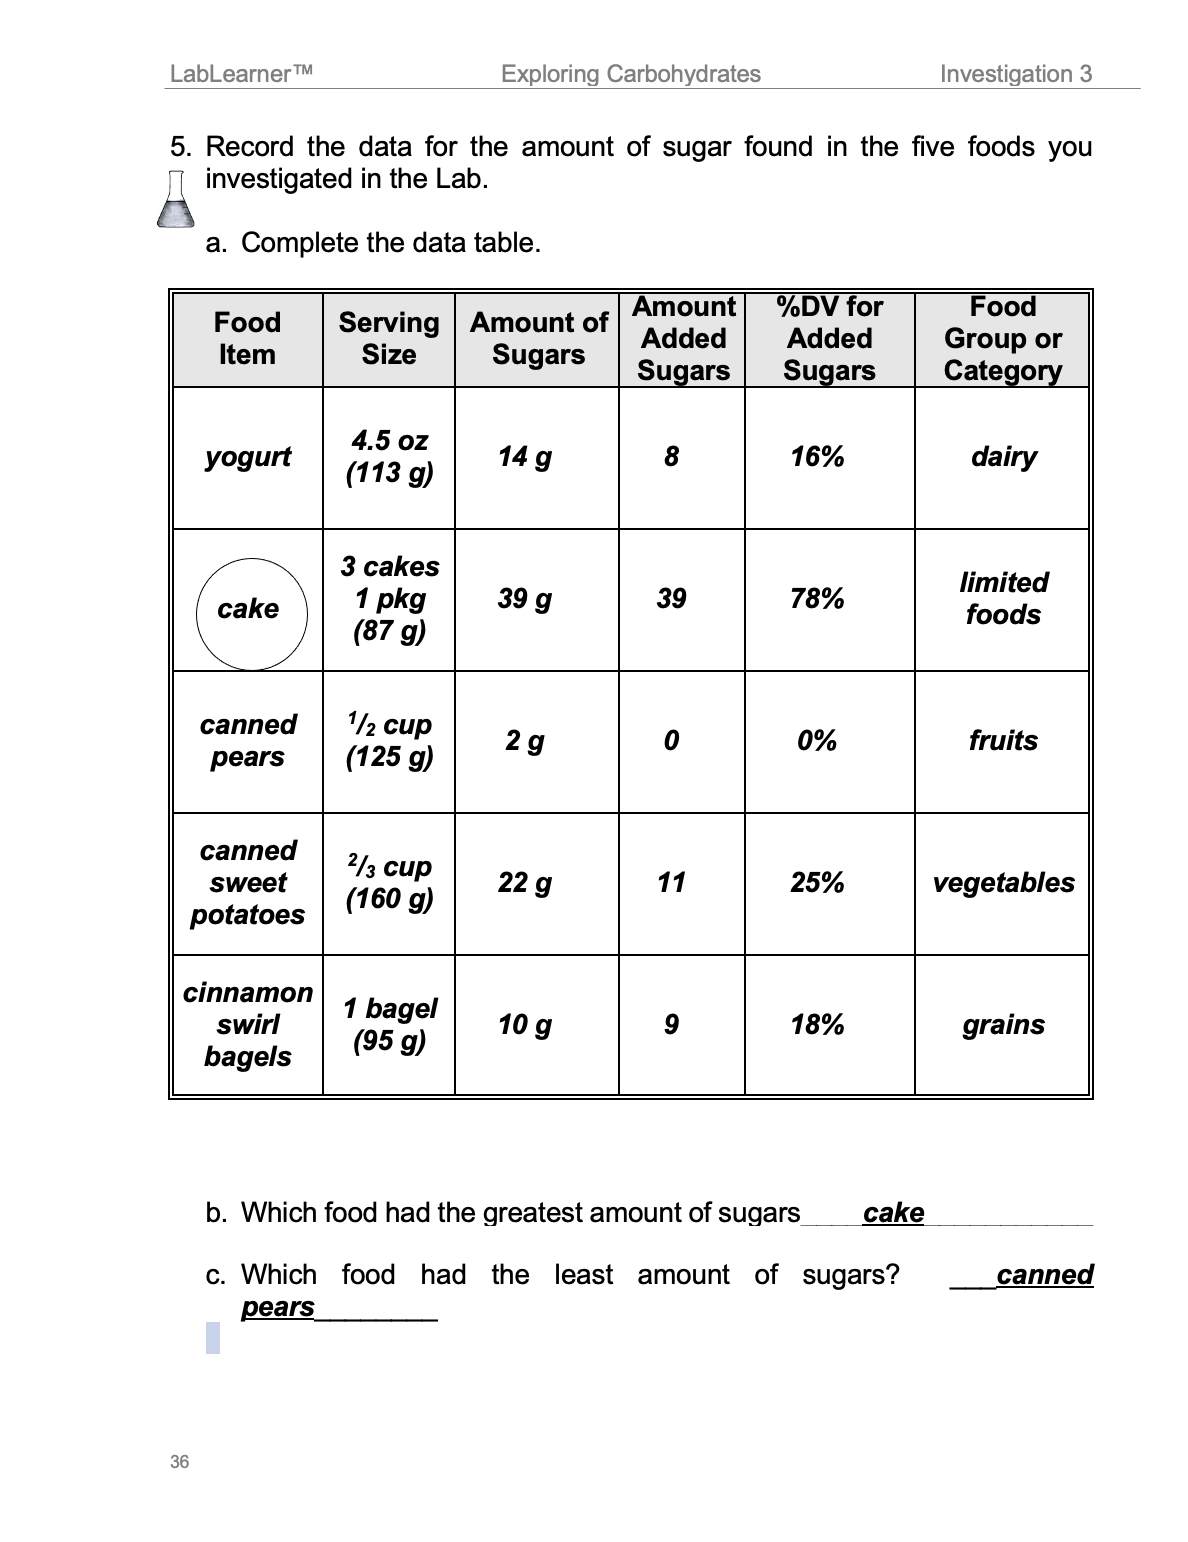
2. Divide the class into groups so that each student in the group has data for a different food or beverage item from the Lab. Instruct students to locate the blank table in Problem 5a of their Student Data Record and to complete the table based on the results from Trial 2 of the experiment. Encourage students to summarize the Table by answering Problems 5b and 5c in their Student Data Record.
3. Allow sufficient time to complete this activity. When complete, bring the groups back together as a class and review the data in the Table together.
______________________________________________
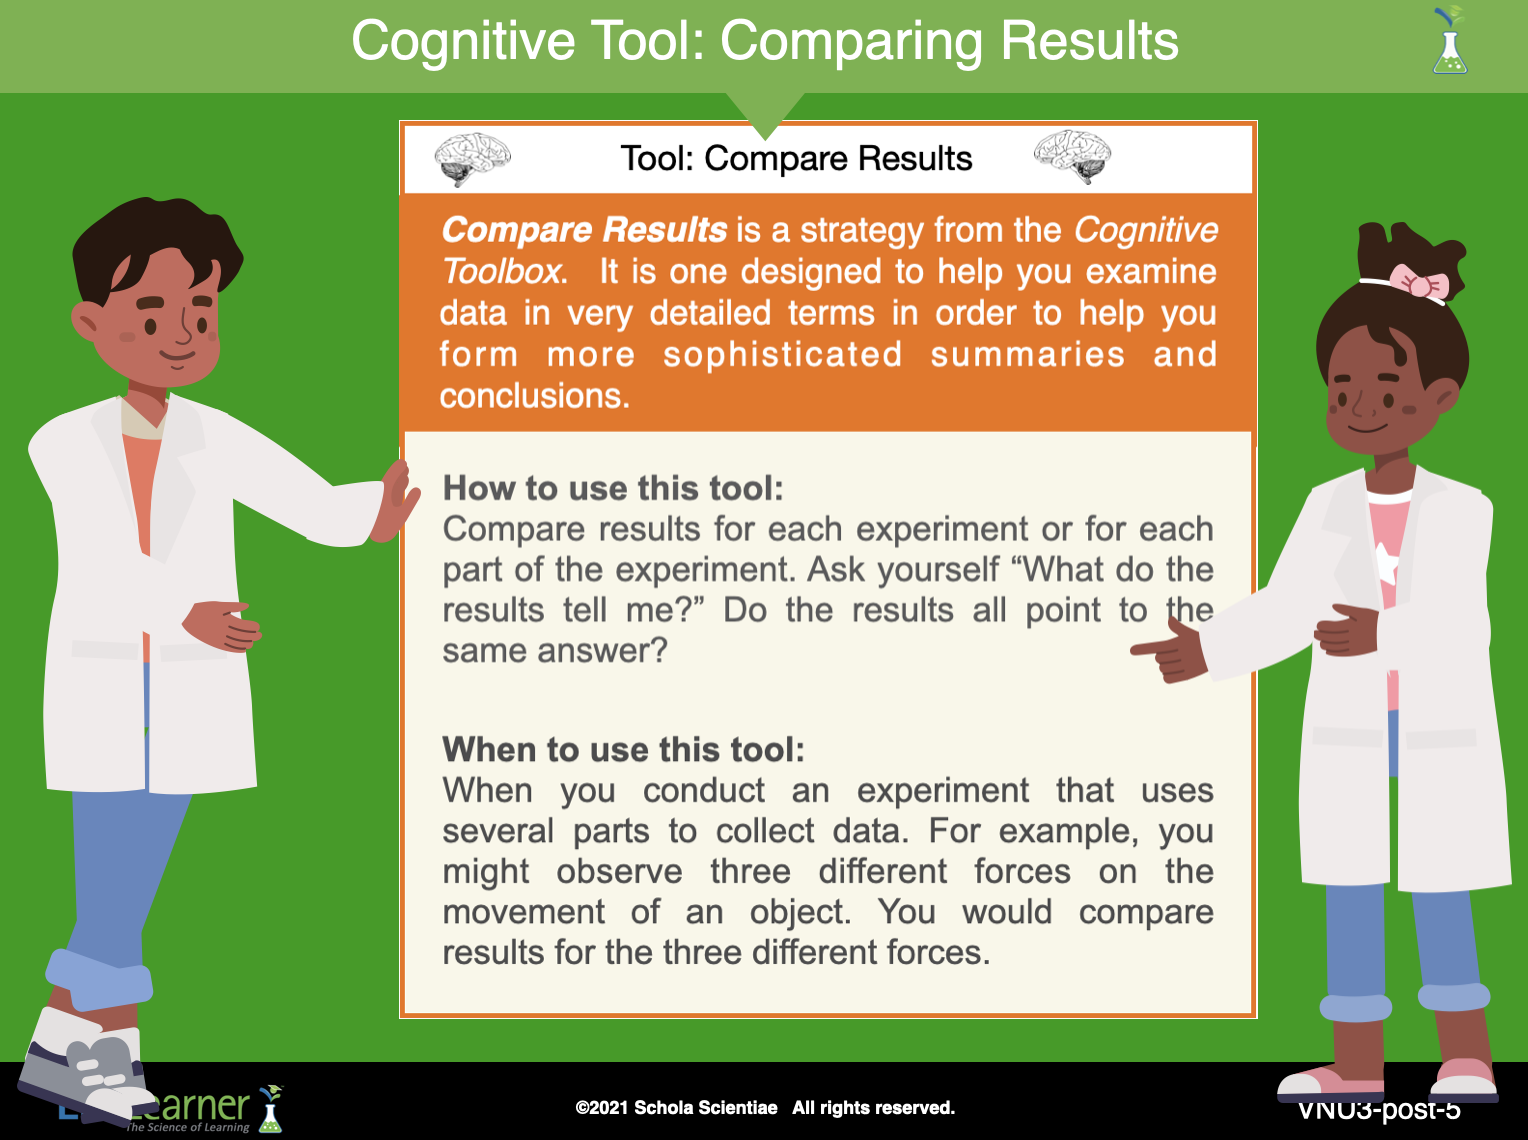
SLIDE VNU3-post-5
4. Ask students: What did you do in the previous Investigation once the Table had been completed? Students may recall that they used the Cognitive Tool called Compare Results.
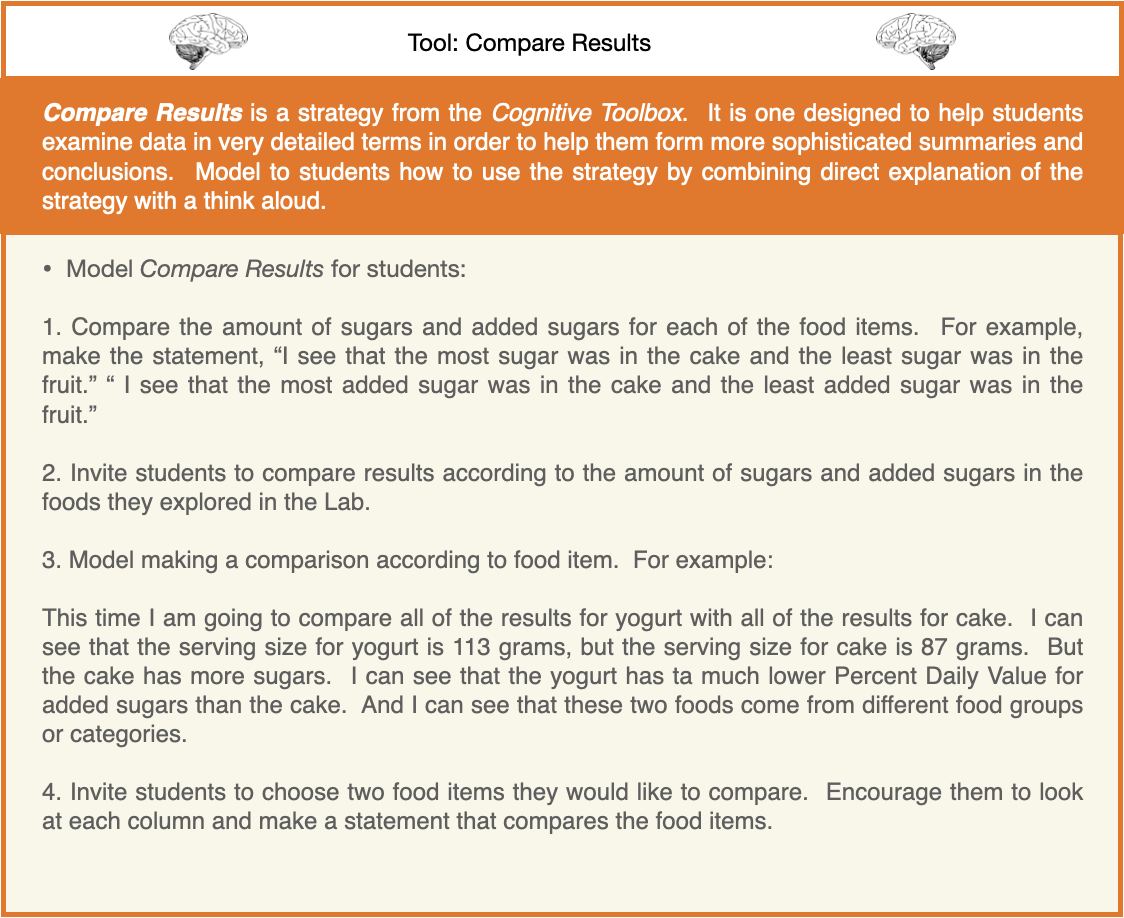
a. Ask students: Which food had the greatest amount of sugars and added sugar? Students should indicate that the cake had the greatest amount of sugars and added sugars.
b. Ask students: Which food had the least amount of sugars and added sugar? Students should indicate that the pears had the least amount of sugar and added sugars.
______________________________________________
SLIDE VNU3-post-6
D. Encourage students to look at the table in Problem 5a of their Student Data Record. Ask students the following questions to relate consuming a healthy balance of nutrients each day to serving sizes:
1. Ask students: Are the serving sizes the same for each food item? Students should indicate that the serving size is different.
2. Ask students: Is there a way you could compare the amount of sugar that is in equal amounts of each food item? How? Student answers may vary. Students may suggest that the mass of the serving size of the food item could be used.
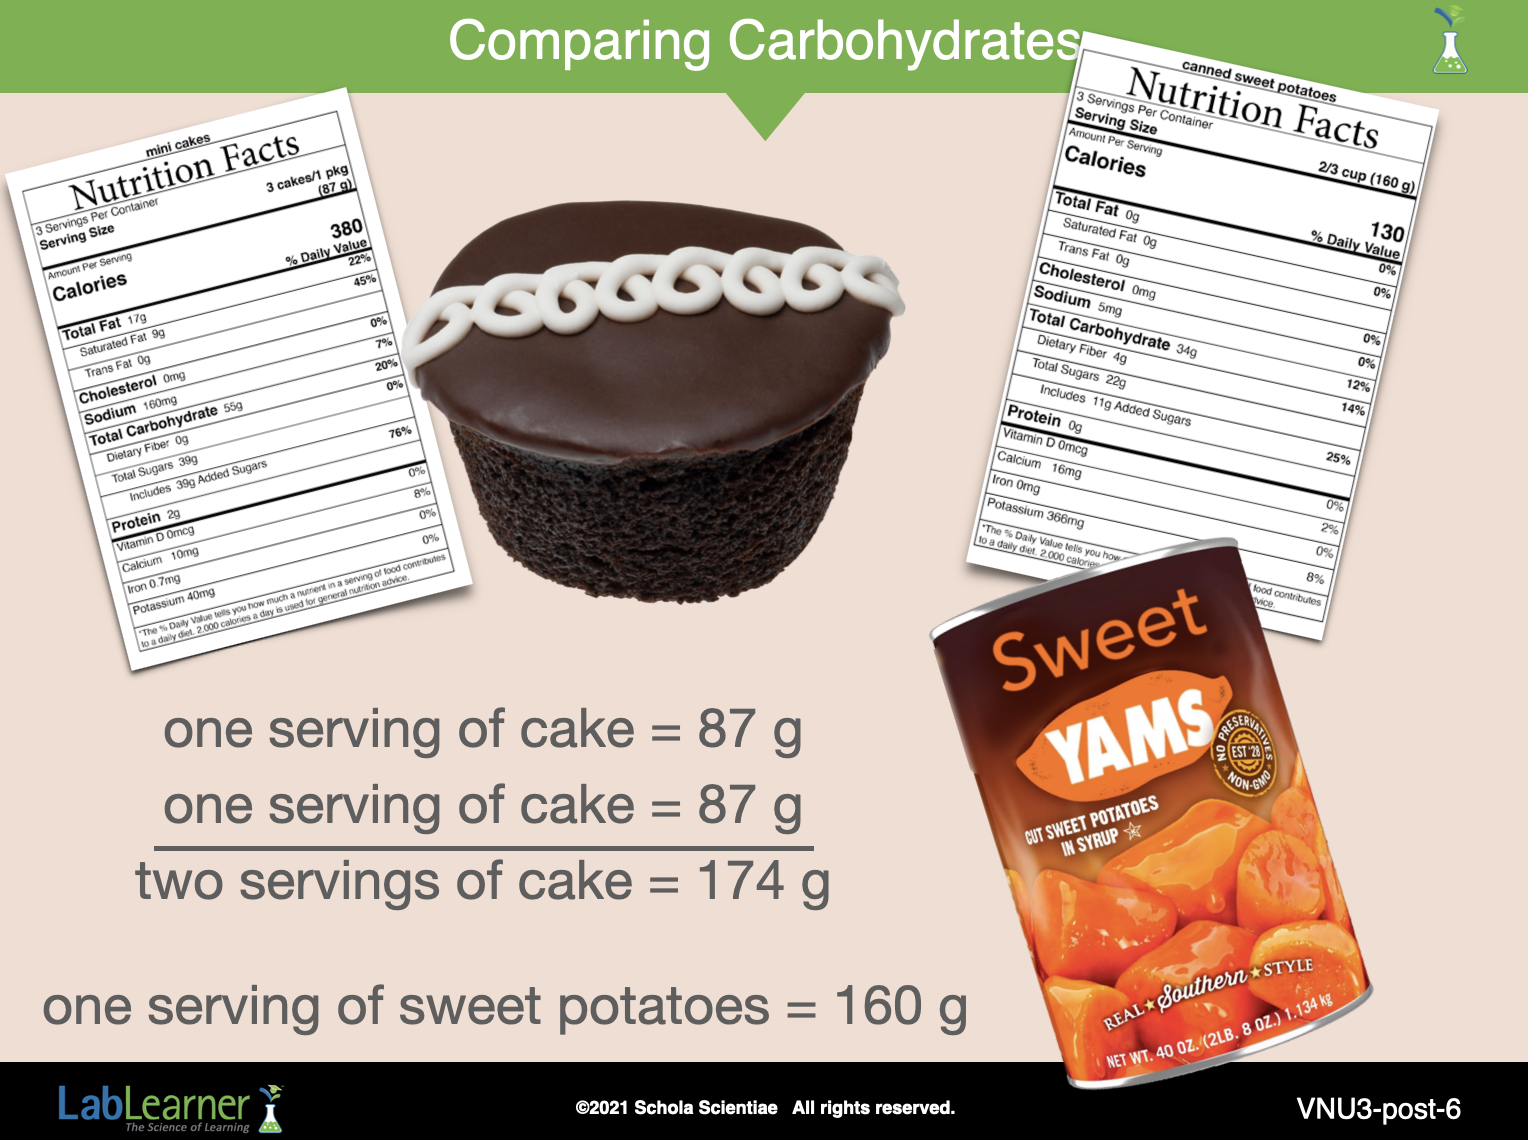
3. Help students apply this concept by using either the example of the sweet potatoes or the cake from the nutrition labels.
4. Ask students: How much sugar would you consume if you ate one serving of cake and one serving of sweet potatoes? One serving of cake has 39 g of sugar, while one serving of sweet potatoes has 22 g of sugar.
5. Encourage students to look closely at the nutrition labels and observe that one serving of sweet potatoes is similar to two servings of cake because one serving of sweet potatoes is 160 g and two servings of cake are 87 grams. Refer to the equation on the slide:
one serving of cake = 87 g
one serving of cake = 87g
two servings of cake = 174 g
one serving of sweet potatoes = 160 g
6. About how many grams of sugar would you eat if you ate the same number of grams of cake as what is in one serving of sweet potatoes? Students should indicate that they would eat three and a half as much as what is in two servings of cake, or about 78 g of sugar, whereas one serving of sweet potatoes has only 22 g of sugar.
7. How would eating two servings of cake change the %DV of added sugar? Students should suggest that the %DV would double to about 156% of what should be eaten in this food category – limited foods.
8. In your table, you indicated which food item had the greatest amount of sugar and added sugar and the least amount of sugar and added sugar. Think about what was just discussed.
Ask students: Is the amount of sugar in a single serving the only information you need to know in order to compare how much sugar you would consume if given two choices of food? What else would you need to consider? Students should indicate that the amount of sugar in a single serving of food is not the only information that they need to know. They need to also consider the amount of added sugar and the number of servings of food they would choose to eat. Eating more or less than one serving of food changes the amount of sugar that is consumed.
9. Ask students: Do you think you ever eat more than what is listed as one serving on the nutrition label? For example, do you eat more than a serving size of cookies? Drink more than one cup of soda or juice? Student answers may vary.
10. Ask students: How would this affect the amount of total carbohydrates and the total amount of sugar and added sugar you consumed? Students should indicate that if more than a single serving of a food is consumed, their total carbohydrates and sugar intake would increase above that listed for a single serving. This would increase the %DV of the carbohydrates and %DV for added sugar they obtain from the food.
______________________________________________
SLIDE VNU3-post-7
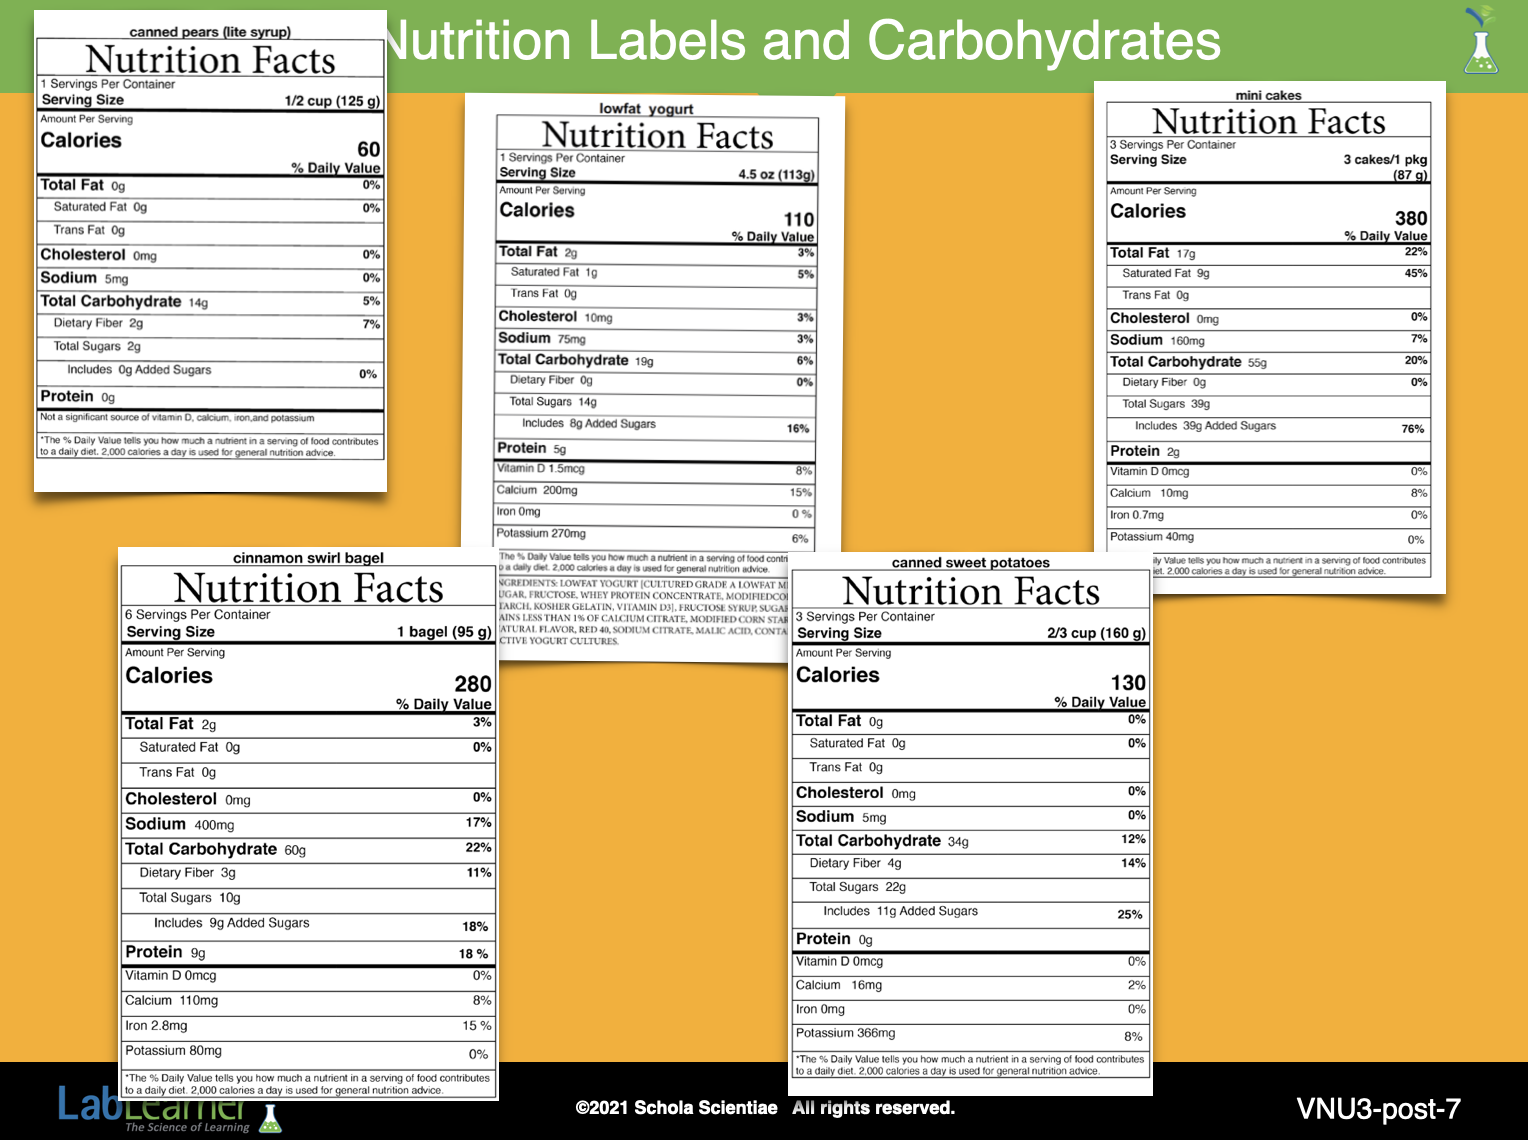
E. Help students to analyze the information listed in the carbohydrate section of the nutrition label. Use the following information and questions to initiate student discussion.
1. Ask students: Did the nutrition label list a %DV for added sugars? Was it listed for any other categories for carbohydrates? Students should indicate that a %DV was not listed for Sugars, but that Added Sugars, Dietary Fiber, and Total Carbohydrates did list a %DV.
2. Explain to students that a %DV is not listed for Sugars because scientists have not made recommendations for the total amount of natural sugars to eat in a day. However, scientists have linked eating an excess of added sugars daily to diseases such as obesity, diabetes and heart disease. For this reason, scientists have added the %DV for Added Sugars to nutrition labels to help people cut back on added sugars in their diet.
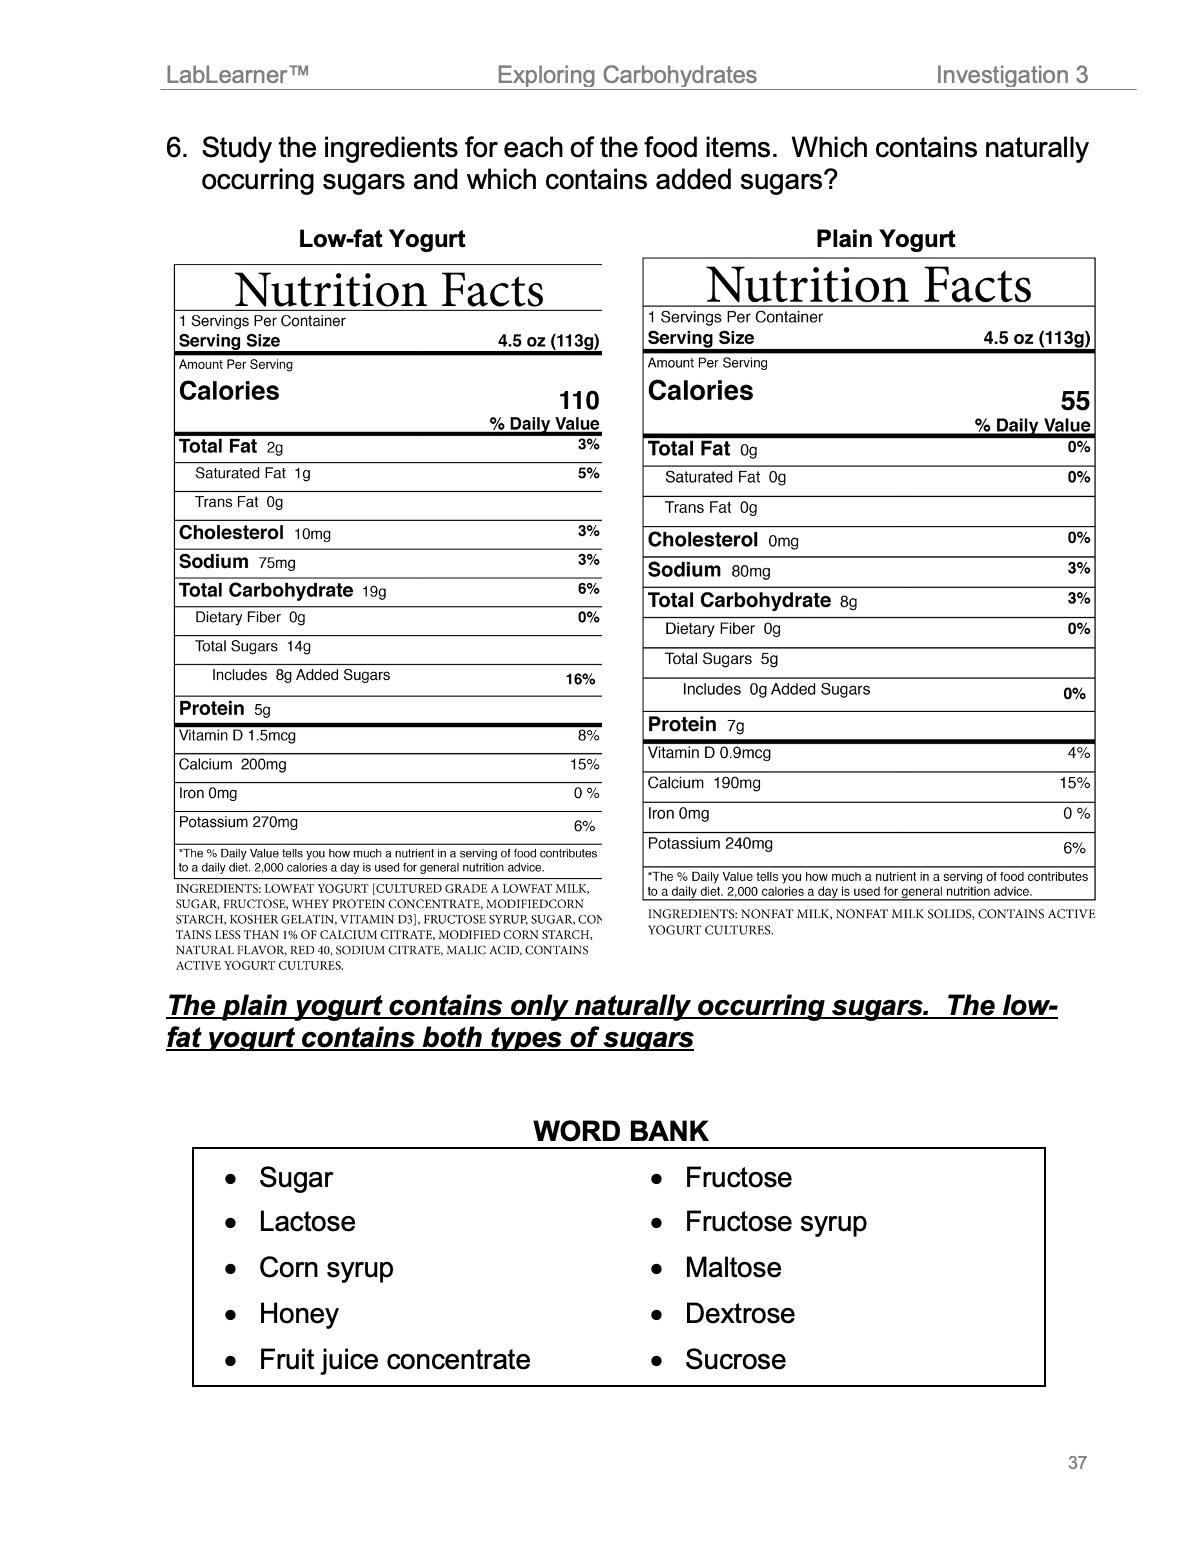
3. Explain to students that the sugars listed on a nutrition label include both the type of sugar found naturally in fruits and milk and the type that is added to a food item. Explain that students can check this by looking at the ingredient list of food items. Sugars that occur naturally in foods are considered healthier than those that are added.
a. Encourage students to locate Problem 6 of their Student Data Record.
b. Tell students that the ingredients of a food item are listed on the nutrition label.
c. Explain to students that they will determine whether the two food items in Problem 6 have naturally occurring sugars or added sugars. Direct students to look for sugars listed in the ingredients list, using the names of different types of added sugars in the word bank. Tell them to circle the names of the added sugars where they find them in the ingredient list.
______________________________________________
SLIDE VNU3-post-8
F. Conclude the discussion of carbohydrates and nutrition labels by encouraging students to observe the additional information about carbohydrates on their nutrition labels.
1. Encourage students to work in pairs to answer the following questions:
a. Besides sugars, what other types of carbohydrates are listed on nutrition labels?
b. Did the different types of carbohydrates on the nutrition labels equal the Total Carbohydrates?
c. What do you think could account for this difference?
2. Provide student pairs several minutes to answer the questions and share their answers. Then discuss students’ findings as a class.
a. Students should have noted that dietary fiber is also listed on nutrition labels. Remind students that most dietary fiber is not absorbed by the digestive system. It passes through the digestive system because people do not have any acids or enzymes that can break it down. As a result, it helps to move other undigested food through the digestive system and out of the body. This function helps to keep the body in good health.
b. Ask students: Do you think there are foods that may contain more fiber than others? Student answers may vary.
Guide students toward realizing that unprocessed foods, such as fruits, vegetables, and grains, contain more fiber than other types.
c. Students should have noted that on most of the labels, the amounts listed for sugars and dietary fiber did not equal the number of total carbohydrates. If necessary, add the categories for one of the nutrition labels on the board. The labels provided at the end of the investigation can be used for this purpose.
d. If students have not suggested that other carbohydrates such as starches may account for the difference between the total carbohydrates and the amounts listed in the dietary fiber and sugar categories.
3. Conclude the Investigation by asking students to think of two questions that Jason could ask Dr. Greene and the answers that Dr. Greene would give to Jason that would help someone else just learning about nutrition understand carbohydrates. Encourage students to write the questions and answers in the space provided in Problem 7 of their Student Data Record. Sample questions follow:
a. Do all foods contain the same amount of carbohydrates? Some foods may contain more or fewer carbohydrates than other foods. This information can be found on the nutrition labels of foods.
b. How will I know if I am eating the amount of carbohydrates I need each day? The recommendations of the MyPlate graphic and the Percent Daily Value on nutrition labels can help you eat the correct amount of carbohydrates each day. Remember that foods in all of the different food groups and categories may contain some carbohydrates.
KEYS: POSTLAB