Teacher Portal:
Examining Nutrition
Investigation 2 – PostLab
PRINT IT
Use your browser to download a printable PDF as help during the slide presentation and to make additional notes. In your browser, go to File > Print and then choose to save as PDF.
NAVIGATE IT
Once the slide presentation is launched
- use your left and right arrows to advance or go back in the slide presentation, and
- hover your mouse over the left edge of the presentation to get a view of the thumbnails for all the slides so that you can quickly move anywhere in the presentation.
- Click HERE to launch the slide presentation for the CELL.
SHARE IT

SLIDE VNU2-post-1
This is the second Investigation of the LabLearner CELL Exploring Nutrition. In it, students learned to understand both the MyPlate graphic from the USDA as well as nutrition labels on the packaging of foods.
______________________________________________
SLIDE VNU2-post-2
A. Begin the analysis of the Lab by helping students remember the experiments they conducted. The following questions may be helpful in prompting student discussion:
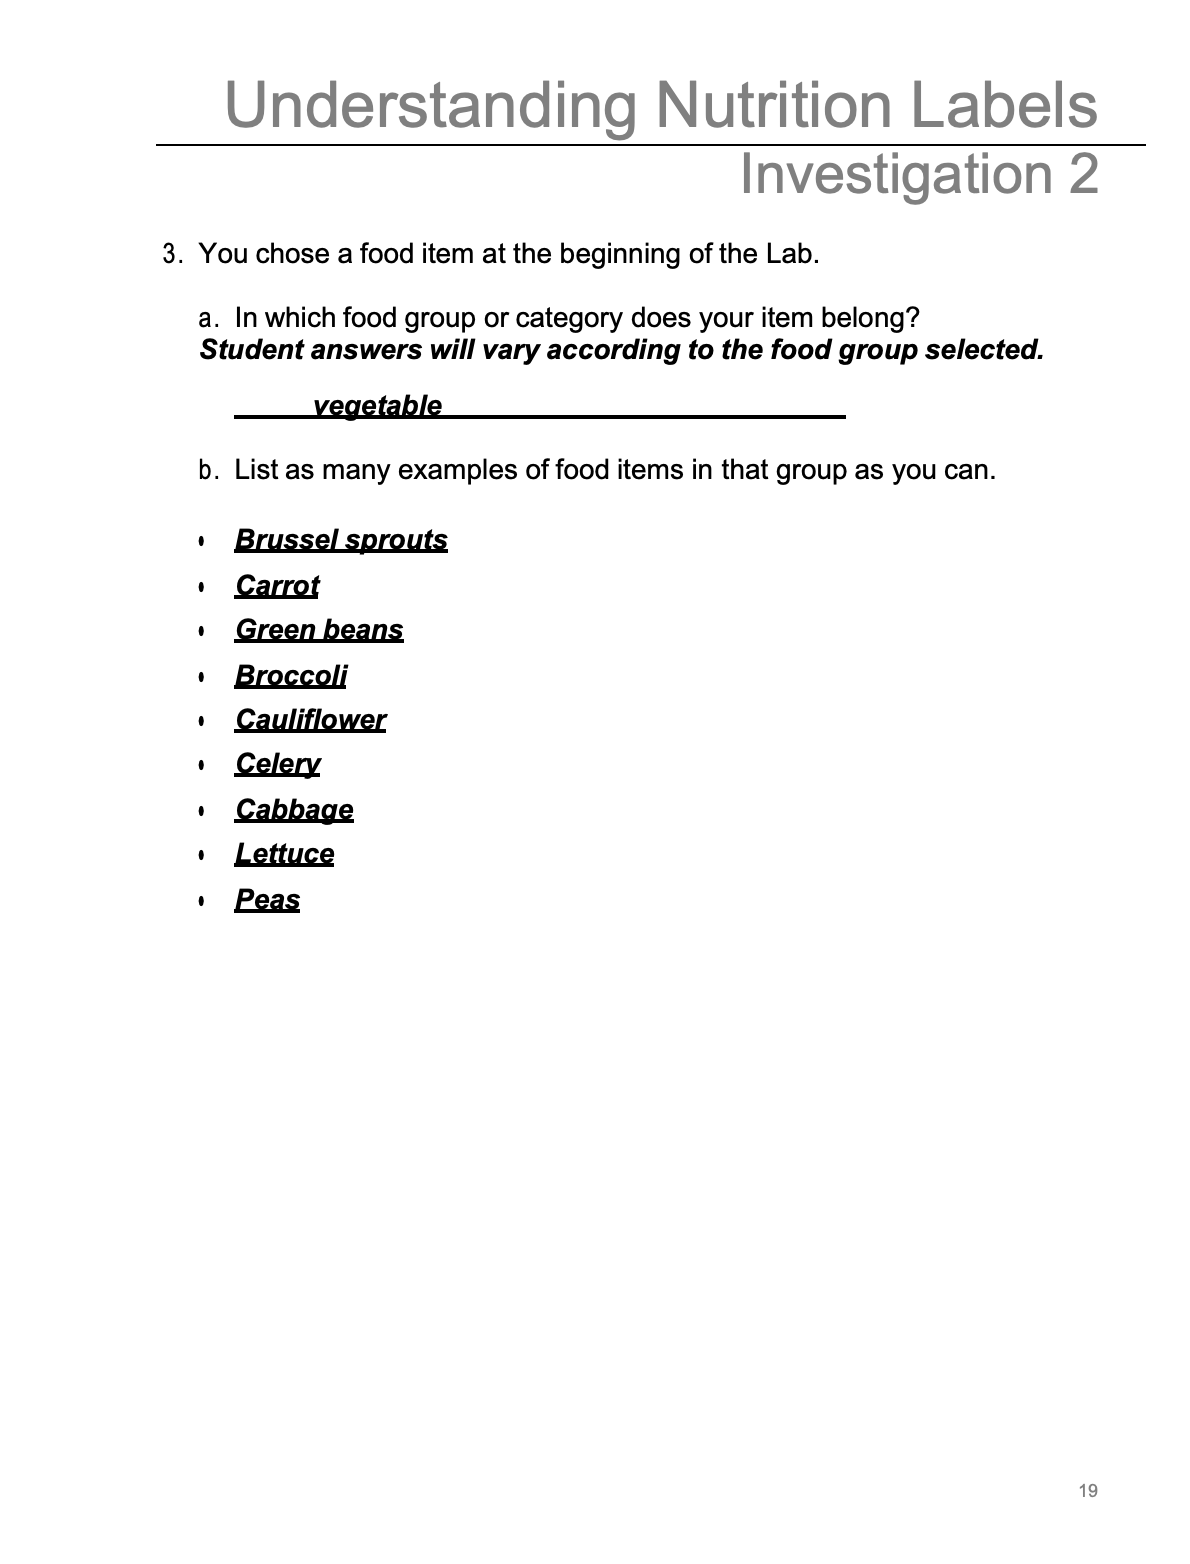
1. Ask students: What did you explore during the Lab? Students should indicate that they explored the MyPlate graphic and the nutrition labels found on various foods.
2. Ask students: Can you summarize what you did during your experiments? Students should indicate that they filled in the food groups or categories and daily requirements for the MyPlate graphic, listed examples of foods found in that food group or category, entered the information from several nutrition labels into a table to compare the fat, salt, carbohydrates, and protein content of those food items. They also answered several questions relating to nutrition labels.
B. Review the materials used in the experiments and what each represented in order to help students understand the relationship between the MyPlate graphic and nutrition labels. Use the following questions to aid in initiating student discussion. Students may wish to refer to their Scientist Data Record.
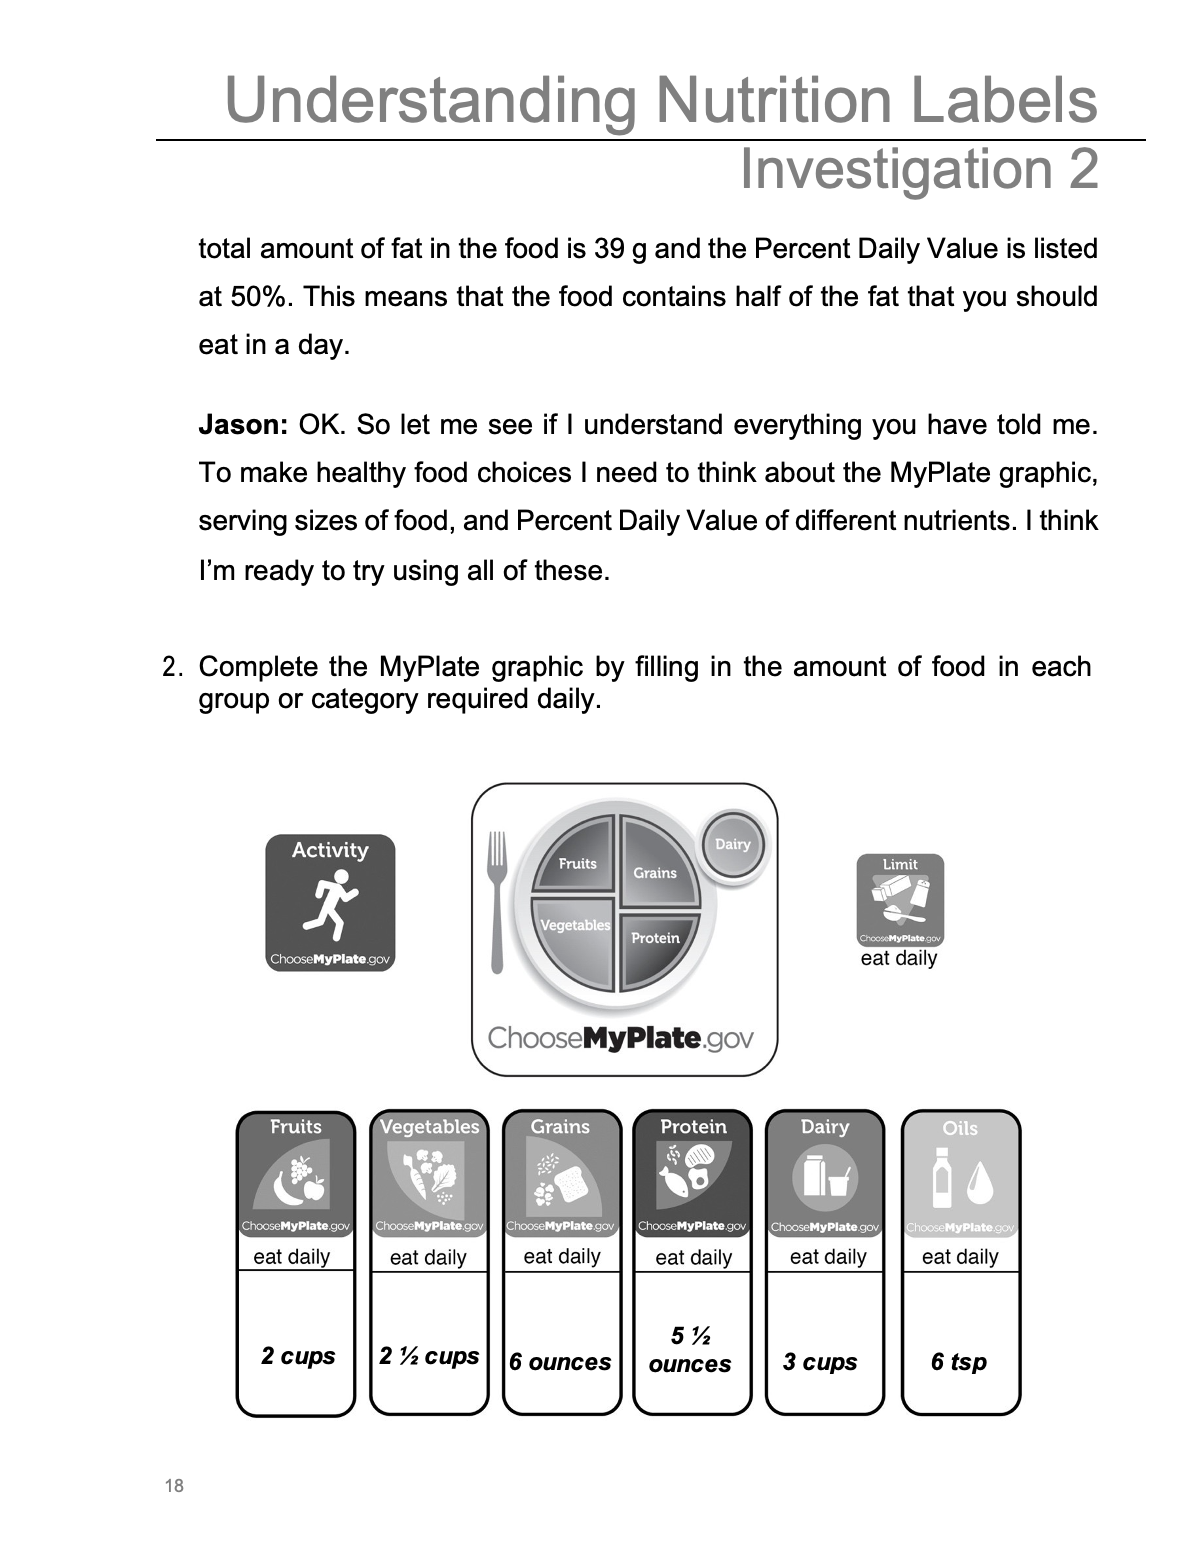
1. Ask students: What information does the MyPlate graphic show you? MyPlate shows the food groups or categories and the daily recommended amount a person should eat from each group or category in order to be healthy.
2. Ask students: Why do you think the MyPlate graphic is arranged as it is? Student answers may vary. Students should observe the different portions for the food groups on the plate realizing that the different proportions are a visual way to provide the right mix of portions without necessarily having to remember the specific number of servings for each food group. They should also suggest that it is important to include the different groups in each meal. By doing this, it helps you to eat all of the nutrients you need for good health. The plate helps to show each meal should try to include all of the food groups.
______________________________________________
SLIDE VNU2-post-3
3. Ask students: Do you think that food items always fit into only one food group or category? Why? Student answers may vary. Students may realize that some foods do not. For example, pizza would not fit into one group or category. The cheese would belong in the dairy group, the sauce would fit into the vegetables group, and the crust would fit into the grains group.
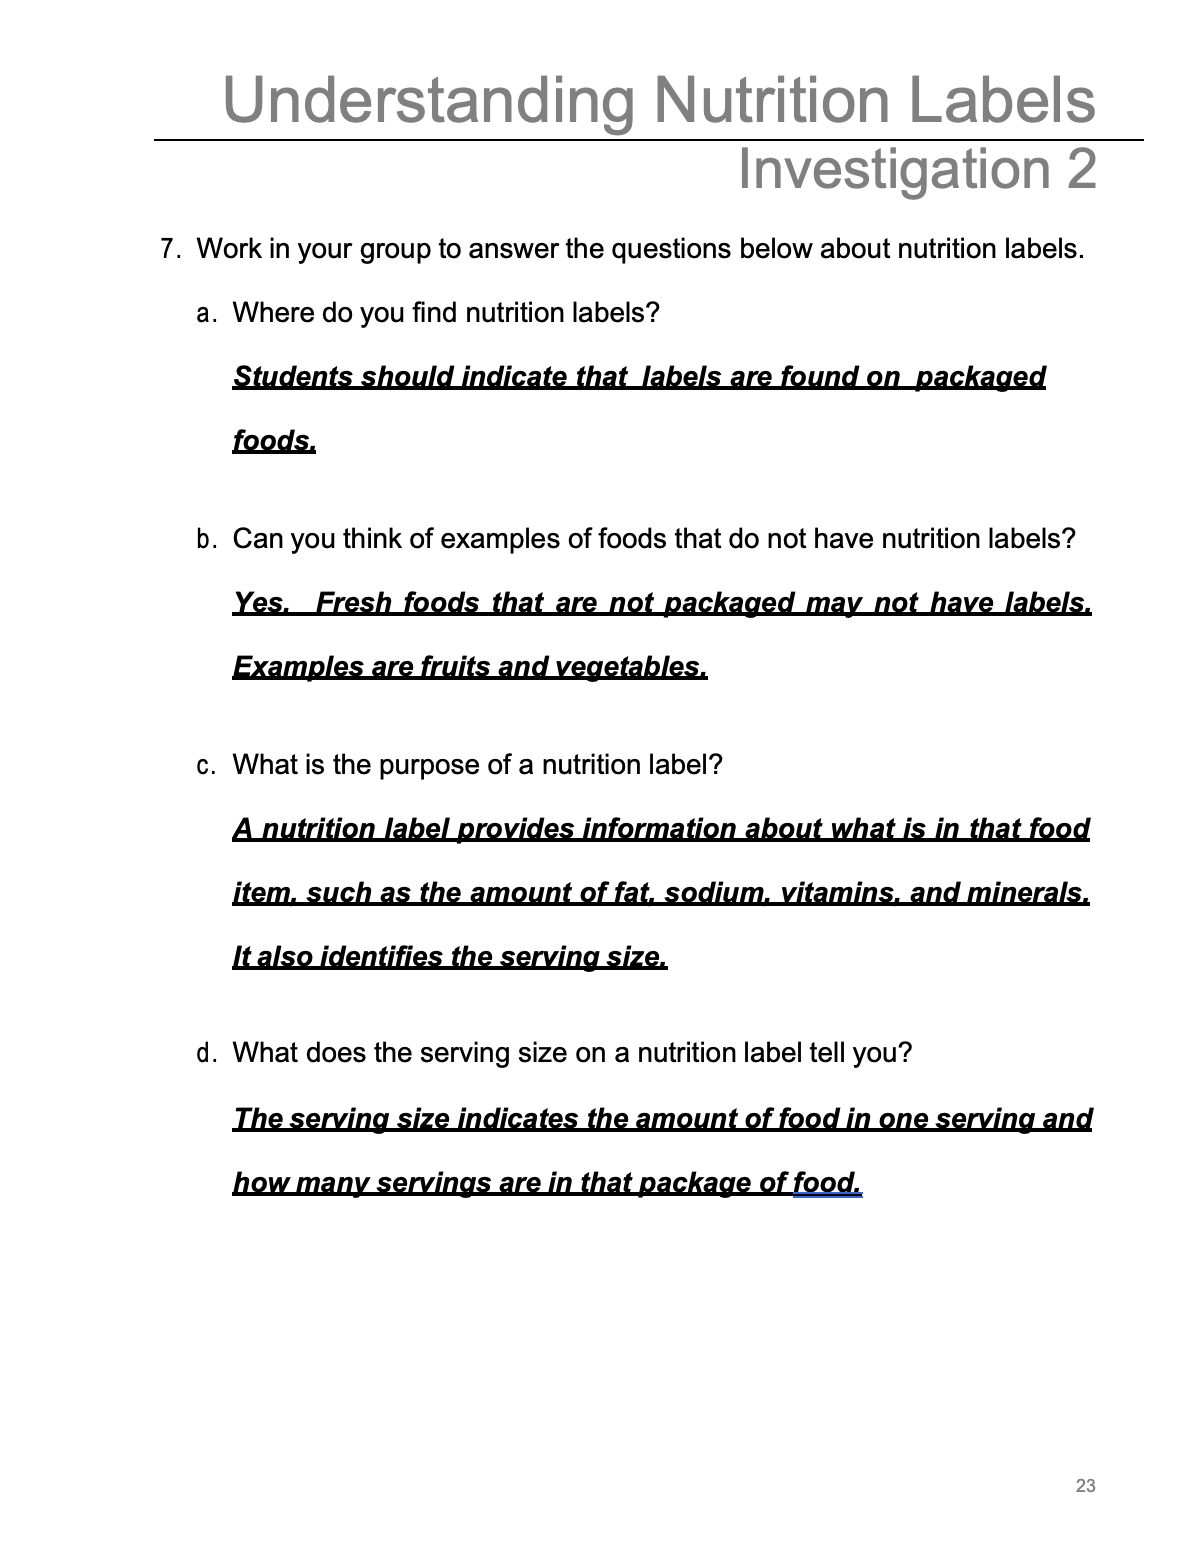
4. Ask students: Where do you find nutrition labels? Nutrition labels are found on the packaging of food items.
5. Ask students: What does a nutrition label tell you? A nutrition label tells you the serving size of the food item and the amount of nutrients found in that food for one serving. It also lists the Percent Daily Value for each of those nutrients. Sometimes, information about the Daily Value for each nutrient is described on the bottom of a nutrition label.
6. Ask students: What is the difference between Daily Value and Percent Daily Value? Can you give an example? Student answers may vary.
7. If necessary, explain that Daily Value represents the total amount of a nutrient that a person should consume in a day in order to be healthy. Percent Daily Value represents the portion or part of the Daily Value of a nutrient in a serving of food.
8. Ask students: Is the Daily Value for each nutrient or ingredient in food always listed on a nutrition label? No. Many labels only indicate the Percent Daily Value of nutrients and other ingredients in that food, but do not provide information about the total amount of the nutrient or ingredient that should be eaten in one day.
9. Ask students: What other information about nutrients is listed on a nutrition label? Students should indicate that the amount of nutrients or ingredients in a food is listed in grams or milligrams on the nutrition label.
______________________________________________
SLIDE VNU2-post-4
10. Use the nutrition label on this slide to help students understand the differences between Daily Value, Percent Daily Value, and the amount of nutrients listed on nutritional labels.
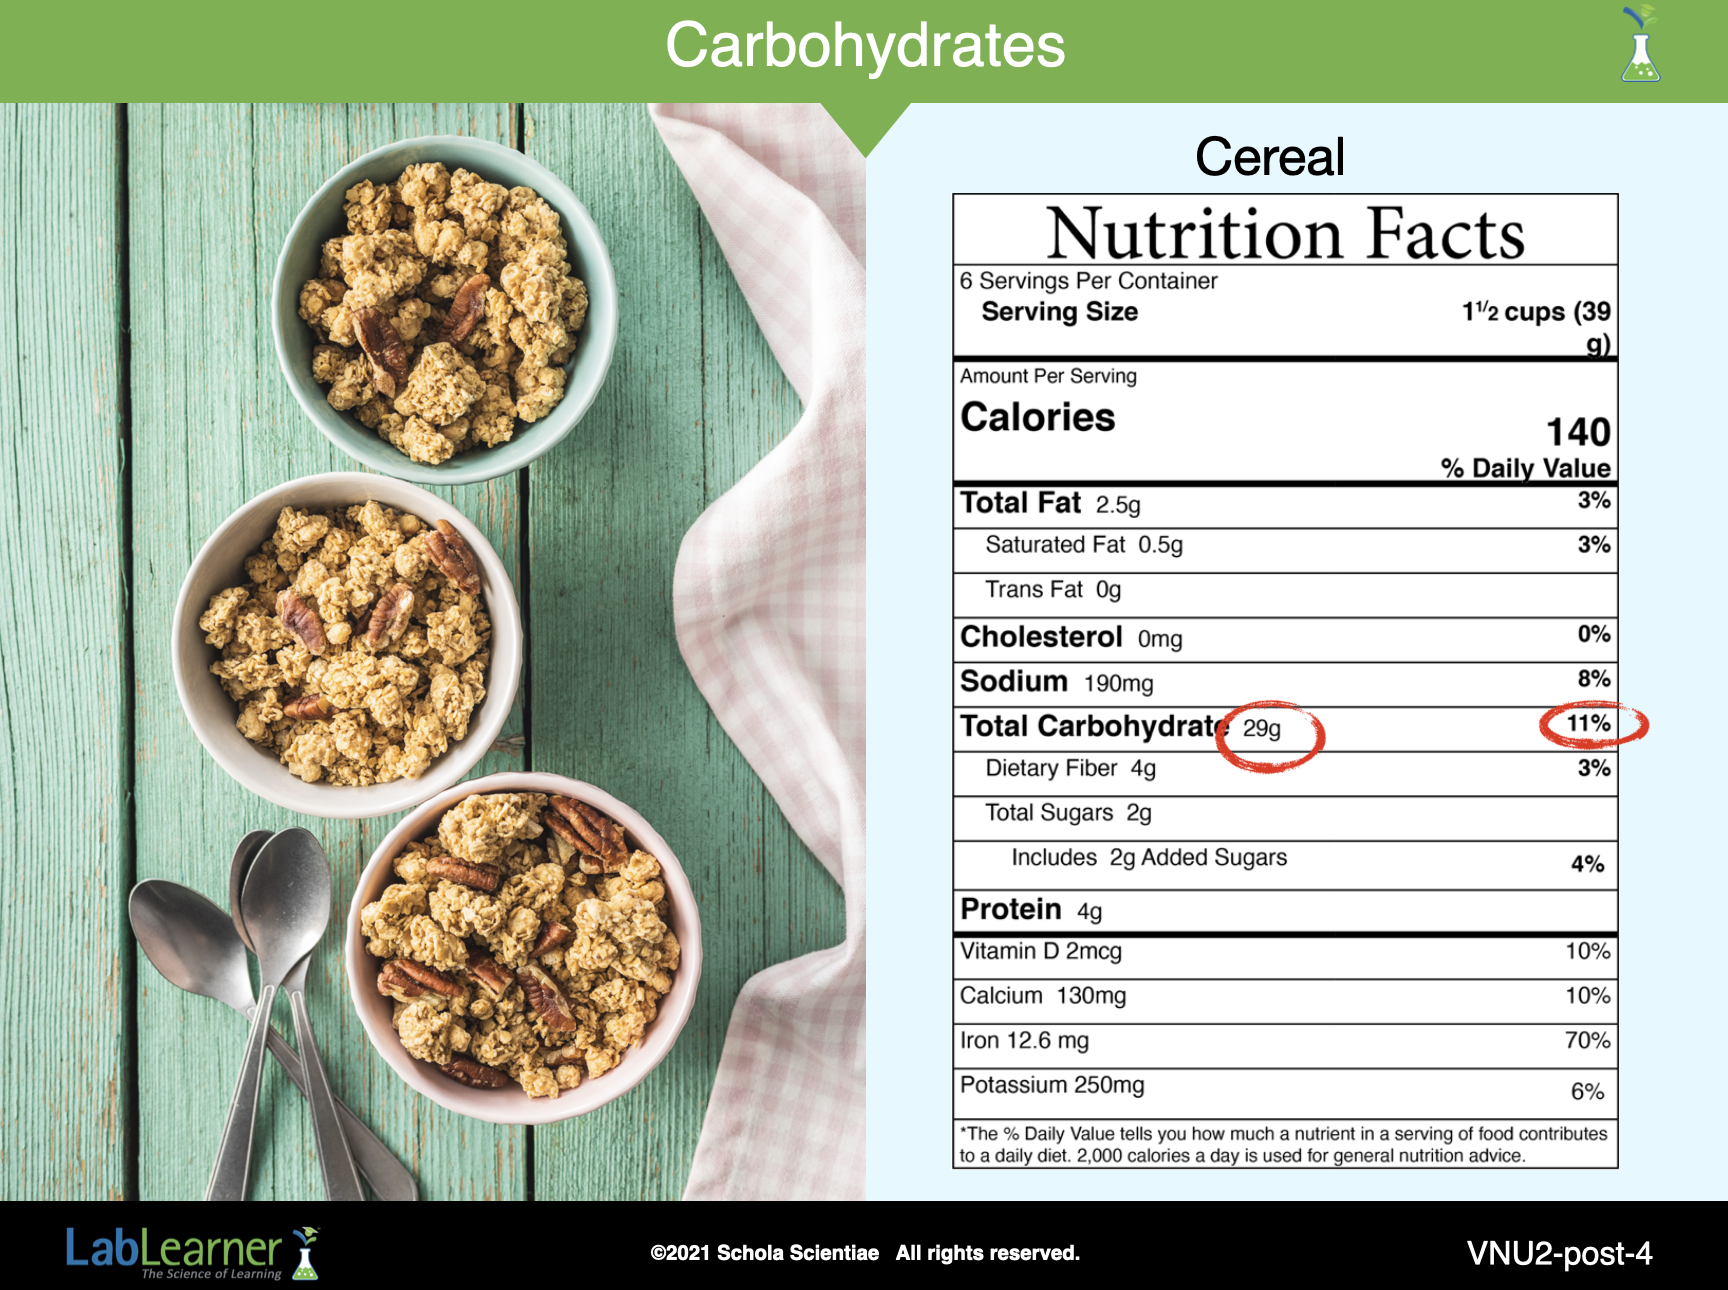
a. Begin by drawing students’ attention to the carbohydrate area of the label.
b. Ask students: How many total carbohydrates are in one serving of cereal? Students should indicate that 29g total carbohydrates are in one serving of the cereal.
c. Ask students: Would you get all of the carbohydrates that you need in a day from one serving of cereal? What information can you use to answer this question? No. The grams of carbohydrates on the nutrition label and the %DV for Total Carbohydrates can be used to answer the question. Only 29 grams of carbohydrates are in one serving of cereal. This is only 11% of the carbohydrates needed for the day.
d. Ask students: How can you use the Percent Daily Value listed on the nutritional label to help you answer the question? The %DV listed for Total Carbohydrates is 11%. This means that one serving of the cereal will provide one-eleventh of the total carbohydrates that can be eaten in one day.
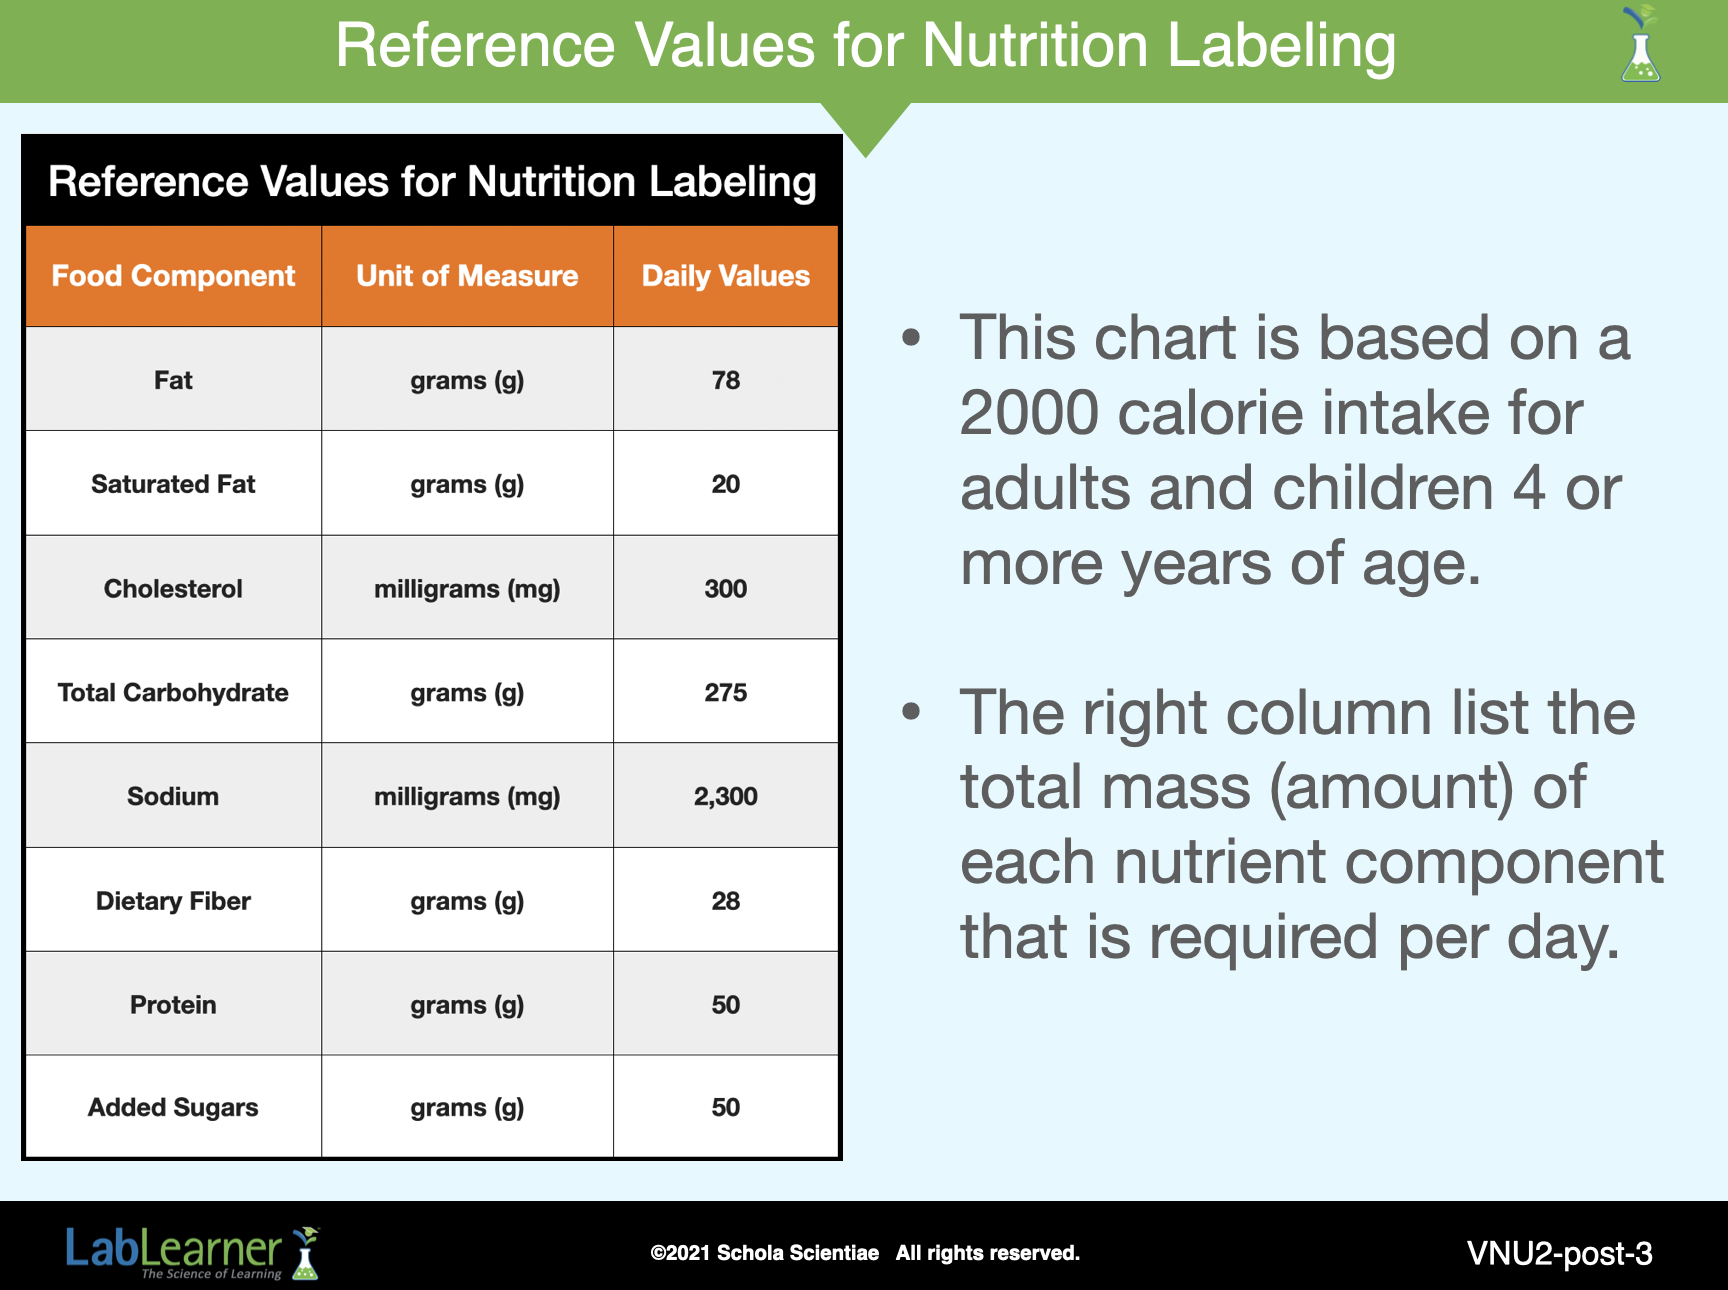
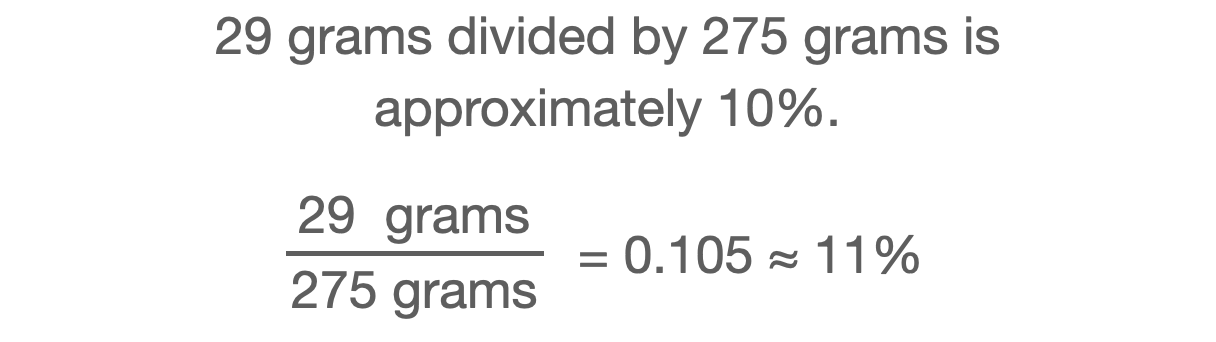
f. Explain to students that the Percent Daily Value was calculated by dividing the number of grams in one serving of the cereal (29 grams) by the Daily Value for carbohydrates (275 grams).
g. Assess whether students understand the concepts just discussed by drawing their attention to the area of the label that lists the fats contained in the cereal. Encourage students to tell you the amount of fat in a serving, the Daily Value for fat (78 g), and how they could determine whether they met the Daily Value for fat by eating a serving of this cereal.
______________________________________________
SLIDE VNU2-post-5
C. Conduct an activity to help students analyze the data they collected in Lab and to better understand how to maintain a healthy balance of nutrients in the foods they consume.
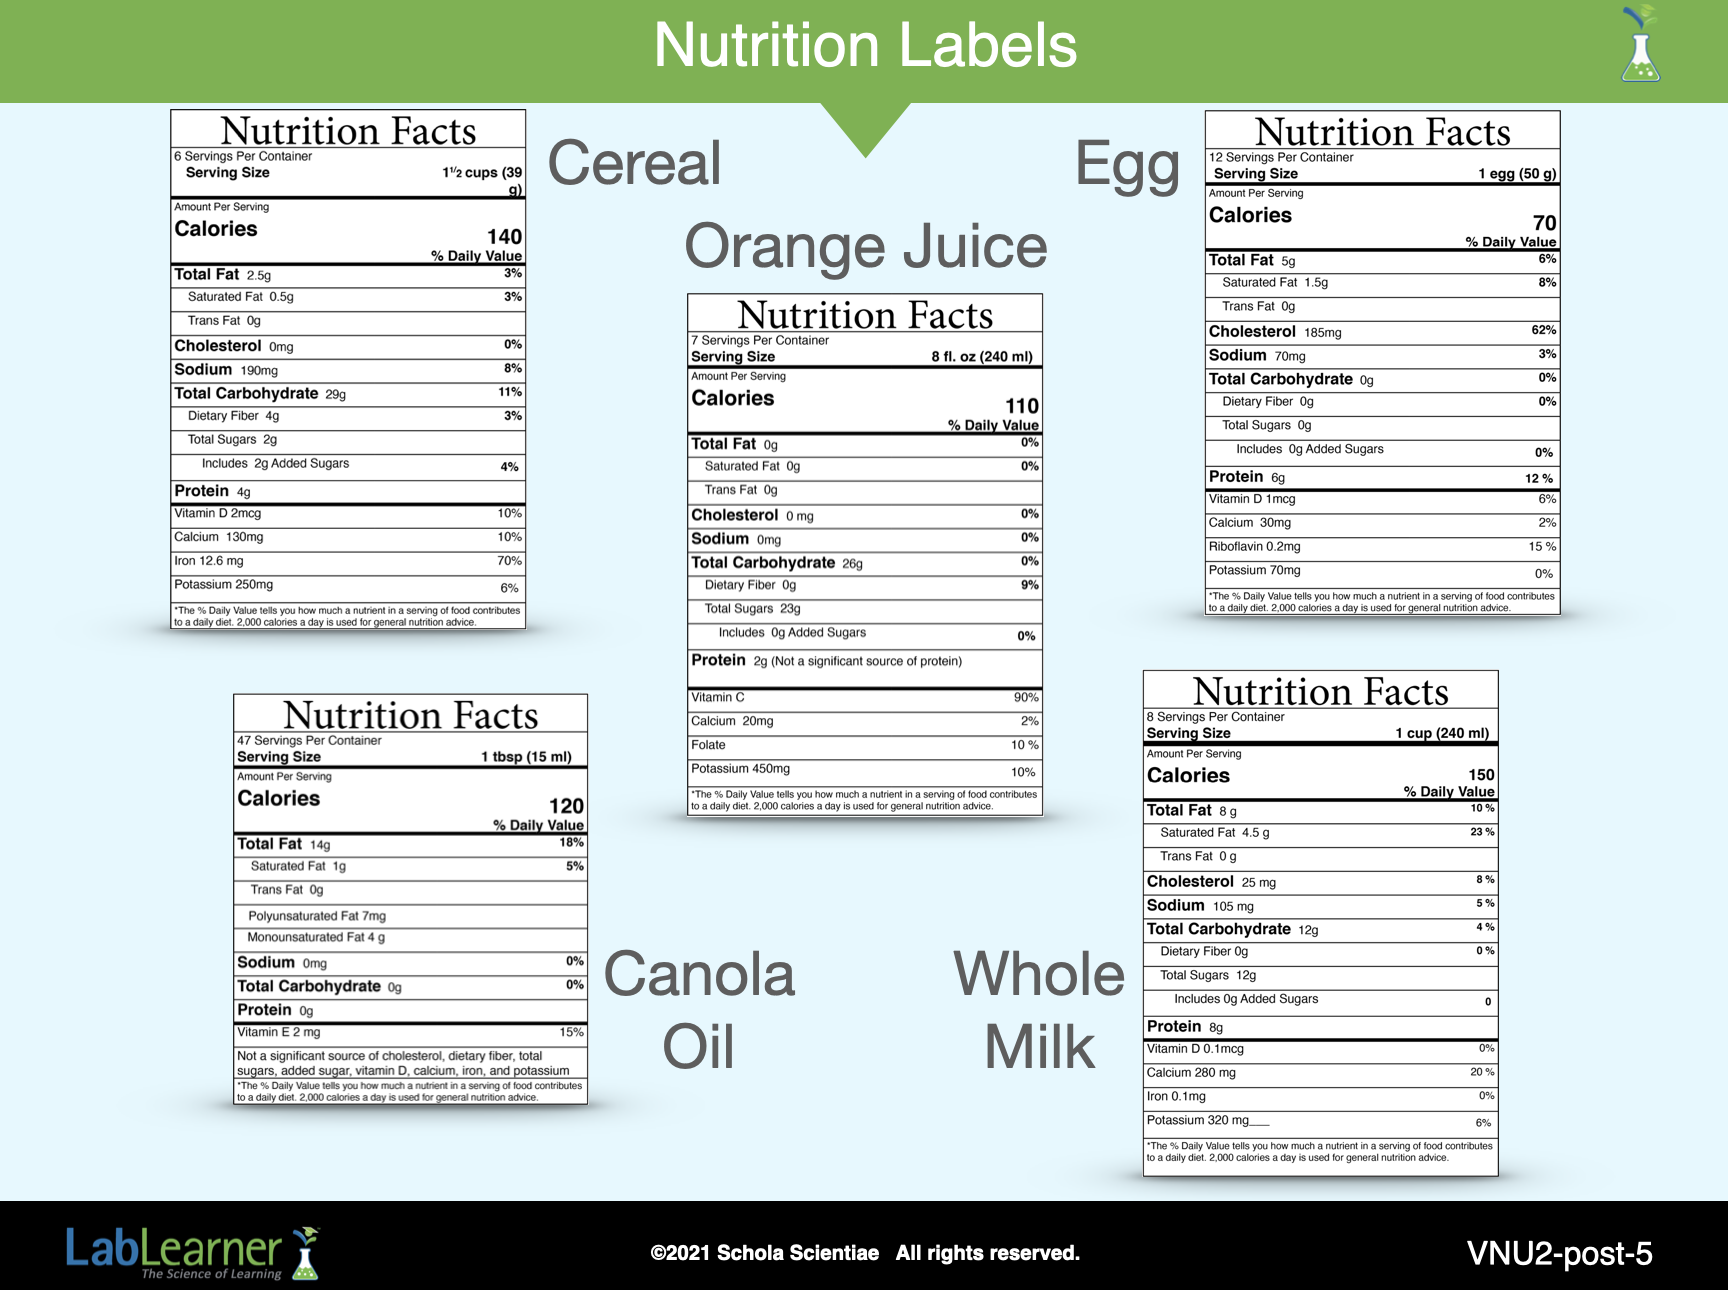
Refer students to the food items they investigated during Lab. If students used the prepared nutrition labels from Investigation One, they can refer to this slide or their Student Data Record.
1. Ask students: How can the information you collected from your food items be organized to compare the nutrients in the five food items? Student answers will vary.
2. Accept various answers and then guide students, if necessary, to the idea that a Data Table could be used. Work with students to develop a Table that will organize their data. If necessary, remind students of the steps they should consider as they Create and Complete a Data Table and that a data table is one of the tools from the Procedural Toolbox.
• Are there questions I need to answer?
• What type of results or measurements did I obtain?
• Which results or measurements could help answer my questions?
• How could I combine the data I recorded for each part of the experiment?
______________________________________________
SLIDE VNU2-post-6
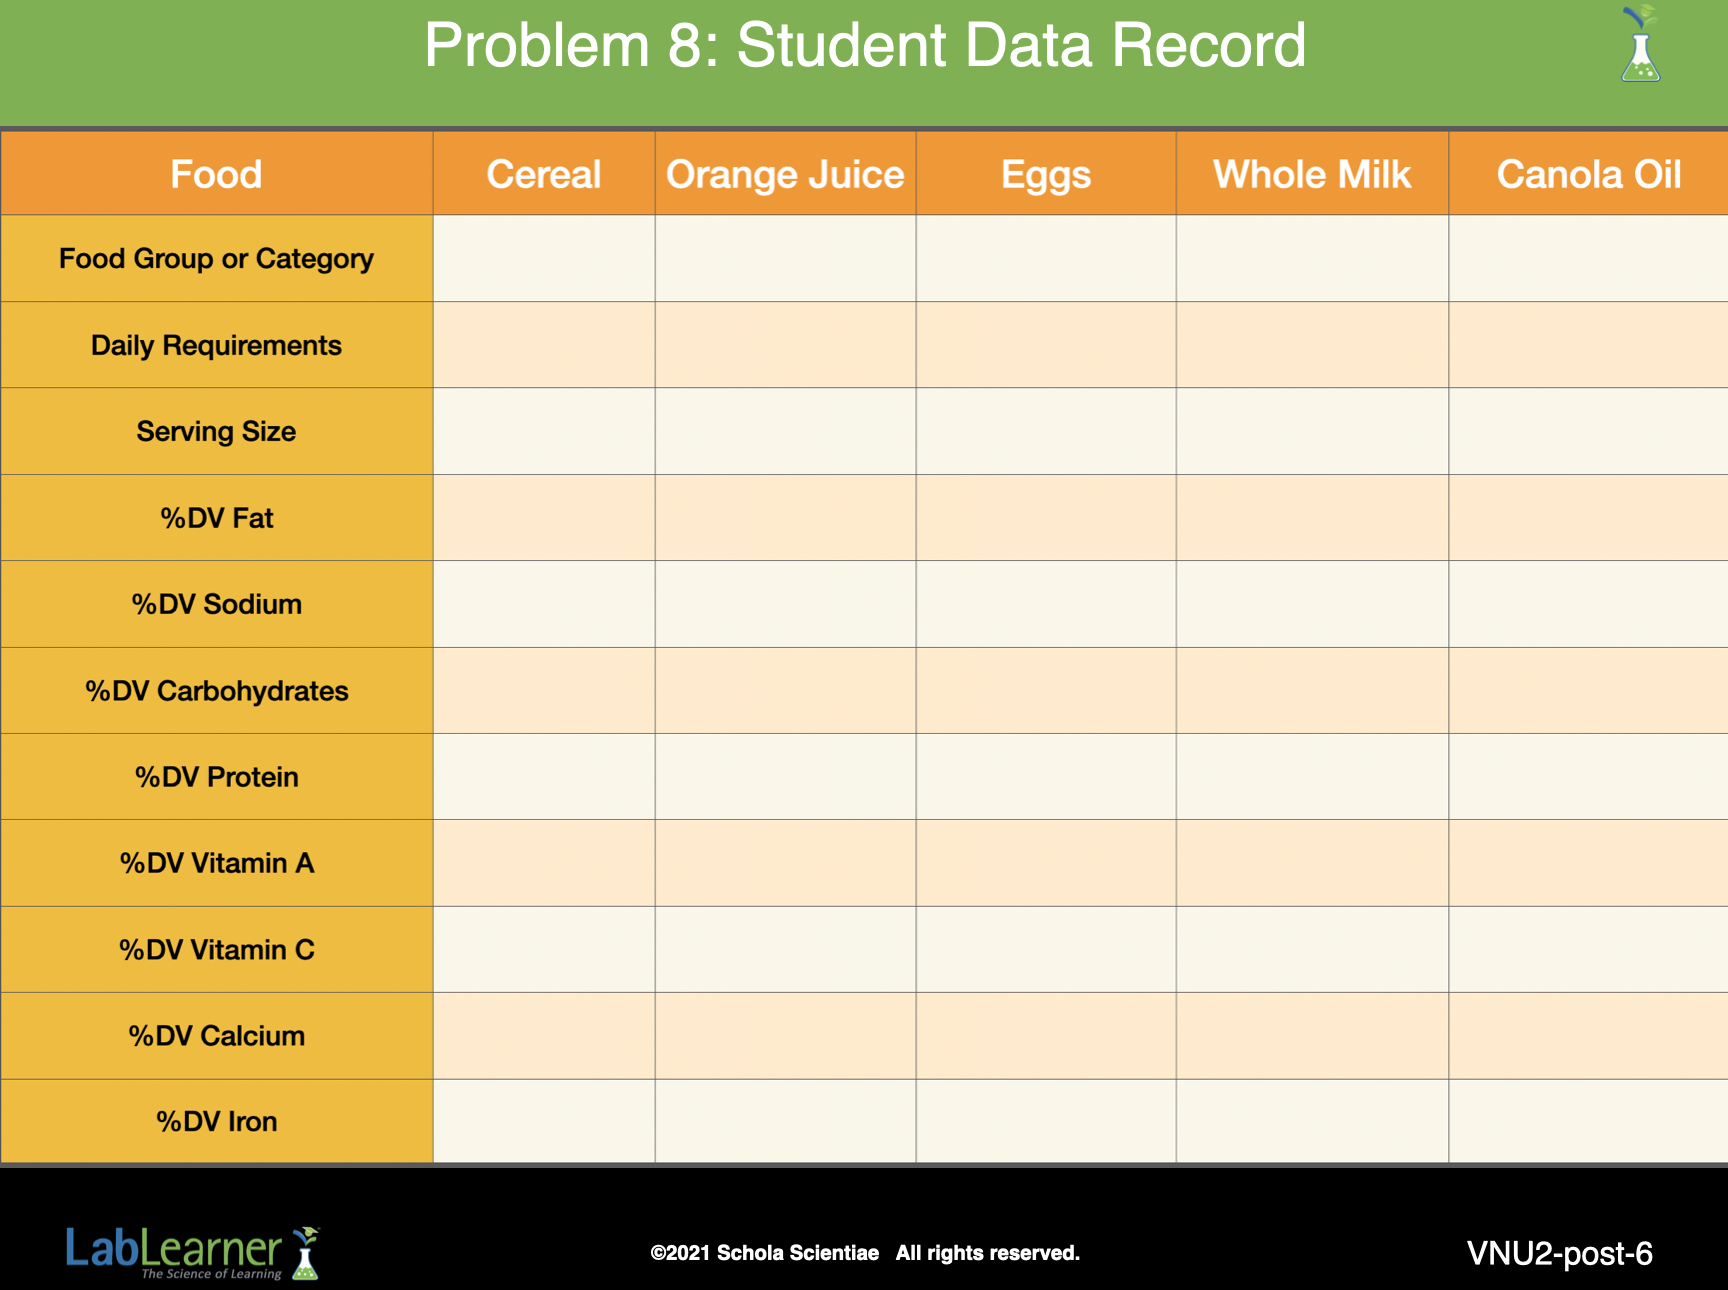
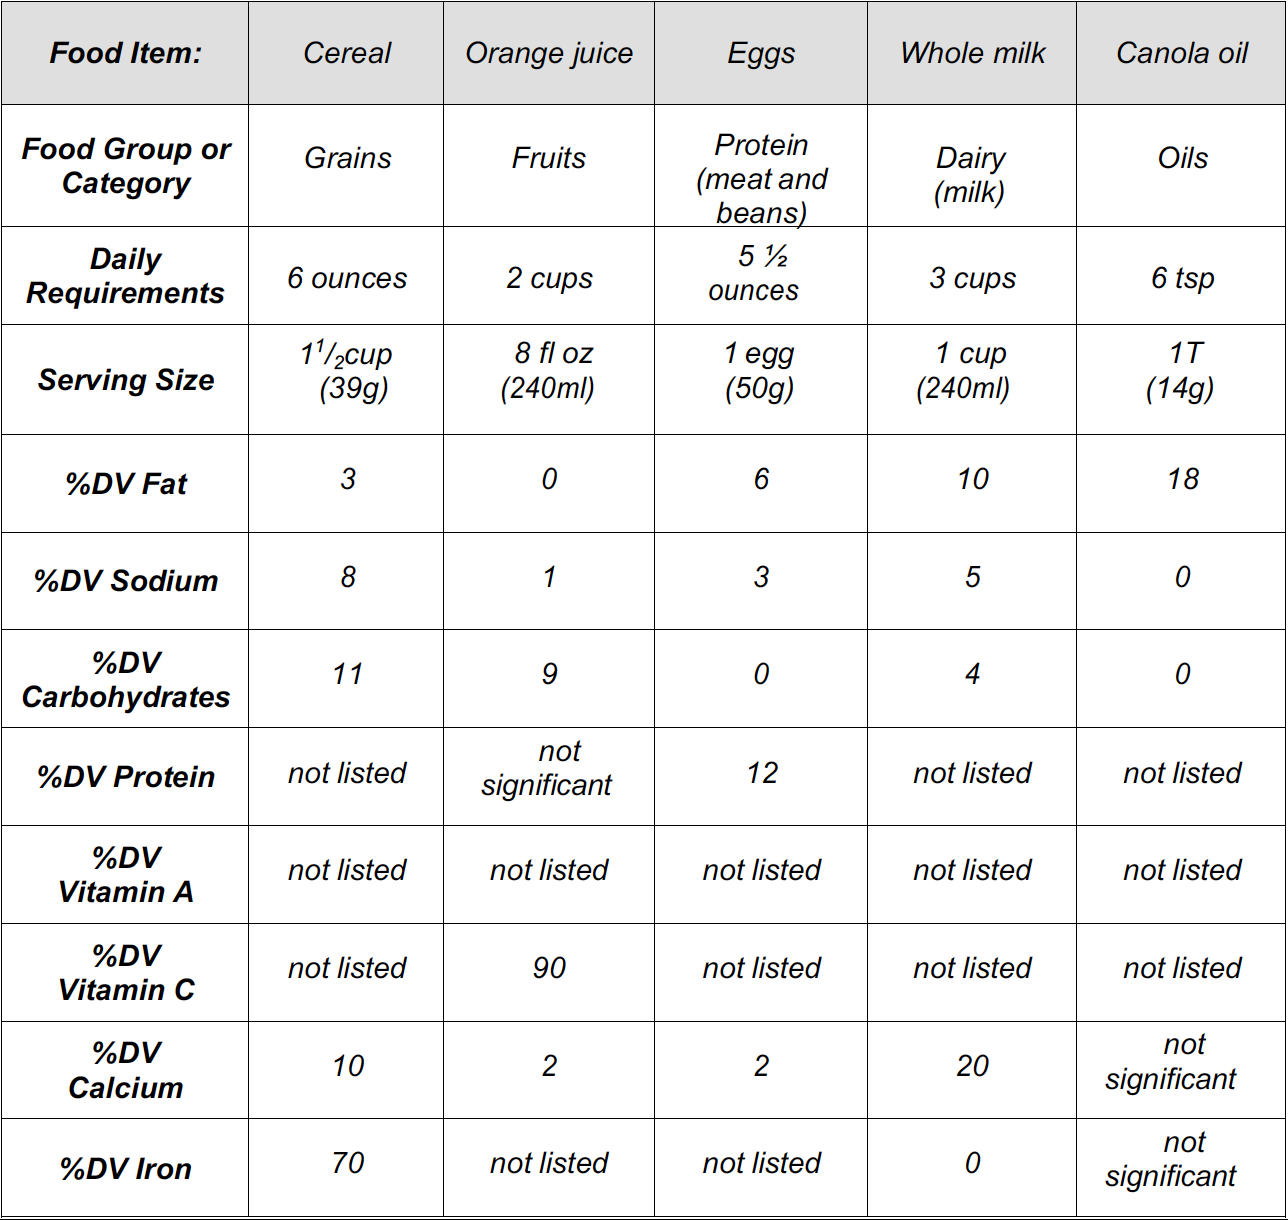
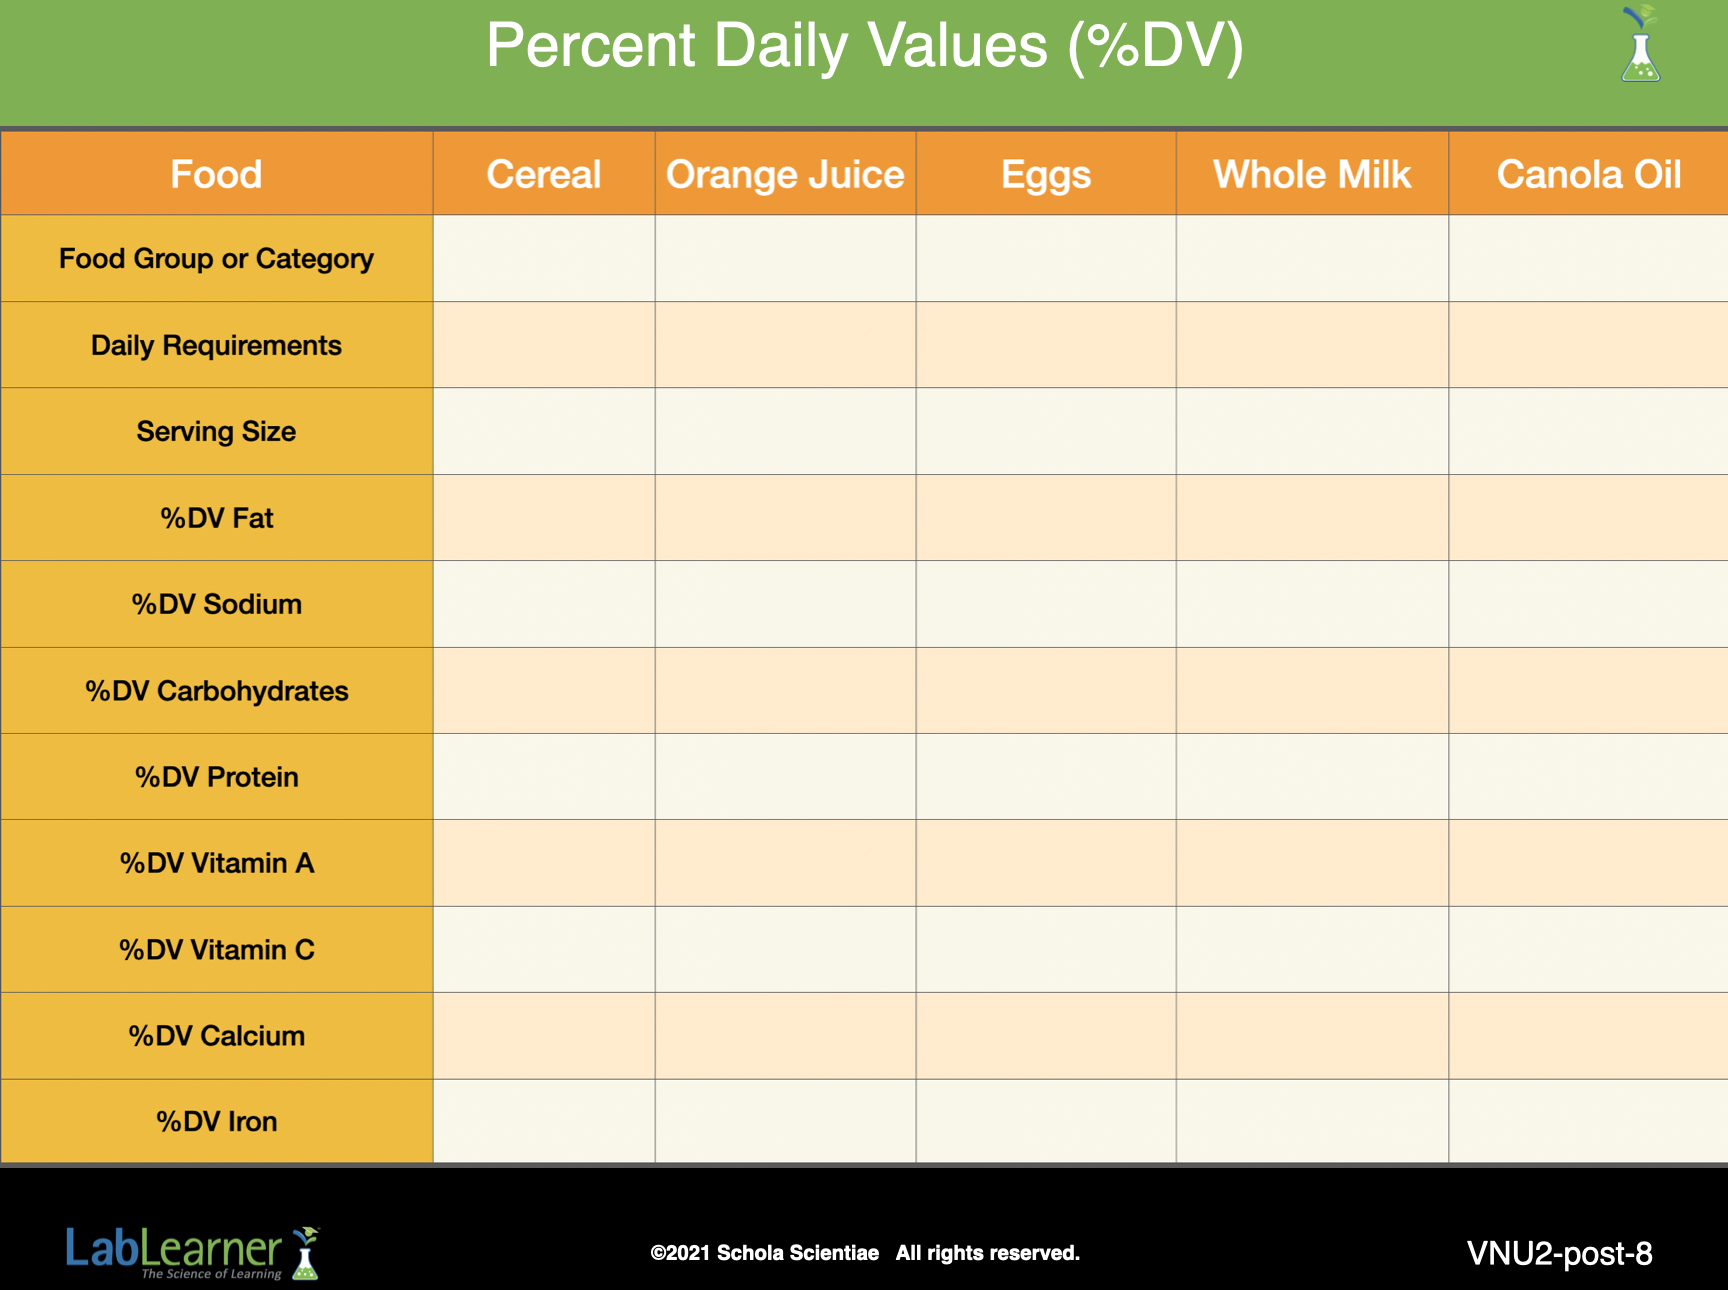
3. Draw a Table on the board similar to the Table shown on this slide and use it to incorporate student suggestions.
Direct students to locate Problem 8 in their Student Data Record and enter the headings for each column and row. As students have used this tool previously, provide time for students to try to complete this portion of the activity independently.
4. After students have had time to independently consider the task:
Ask students: What nutrition facts should we compare? As students make suggestions, list them in the first column of the Table. Encourage students to list the information on their Table.
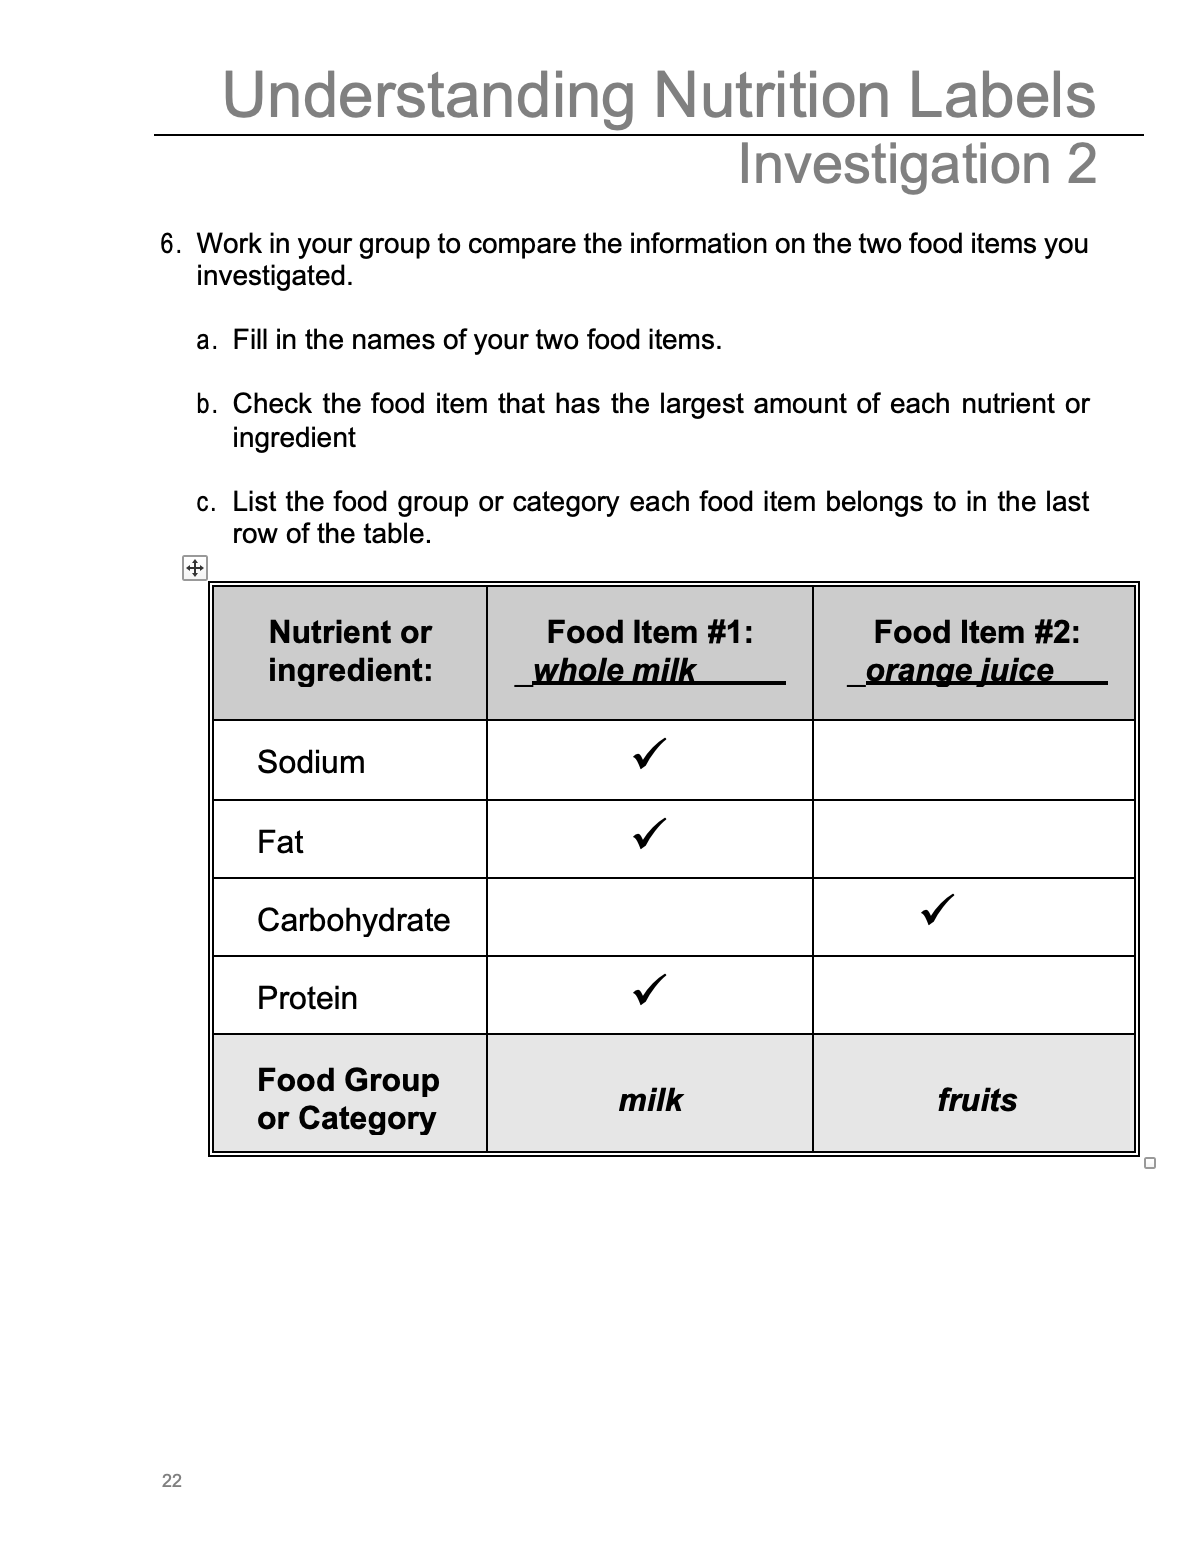
5. Direct one student from each Lab group to come to the board and enter the information they obtained from the first food item they investigated. Students should be able to refer to Problem 4 in their Student Data Record to help them with this task. After all groups have recorded their information encourage students to enter the data into the table in Problem 8 of their Student Data Record.
Note to Teacher: Students do not have the graphic below in their Portal.
______________________________________________
SLIDE VNU2-post-7
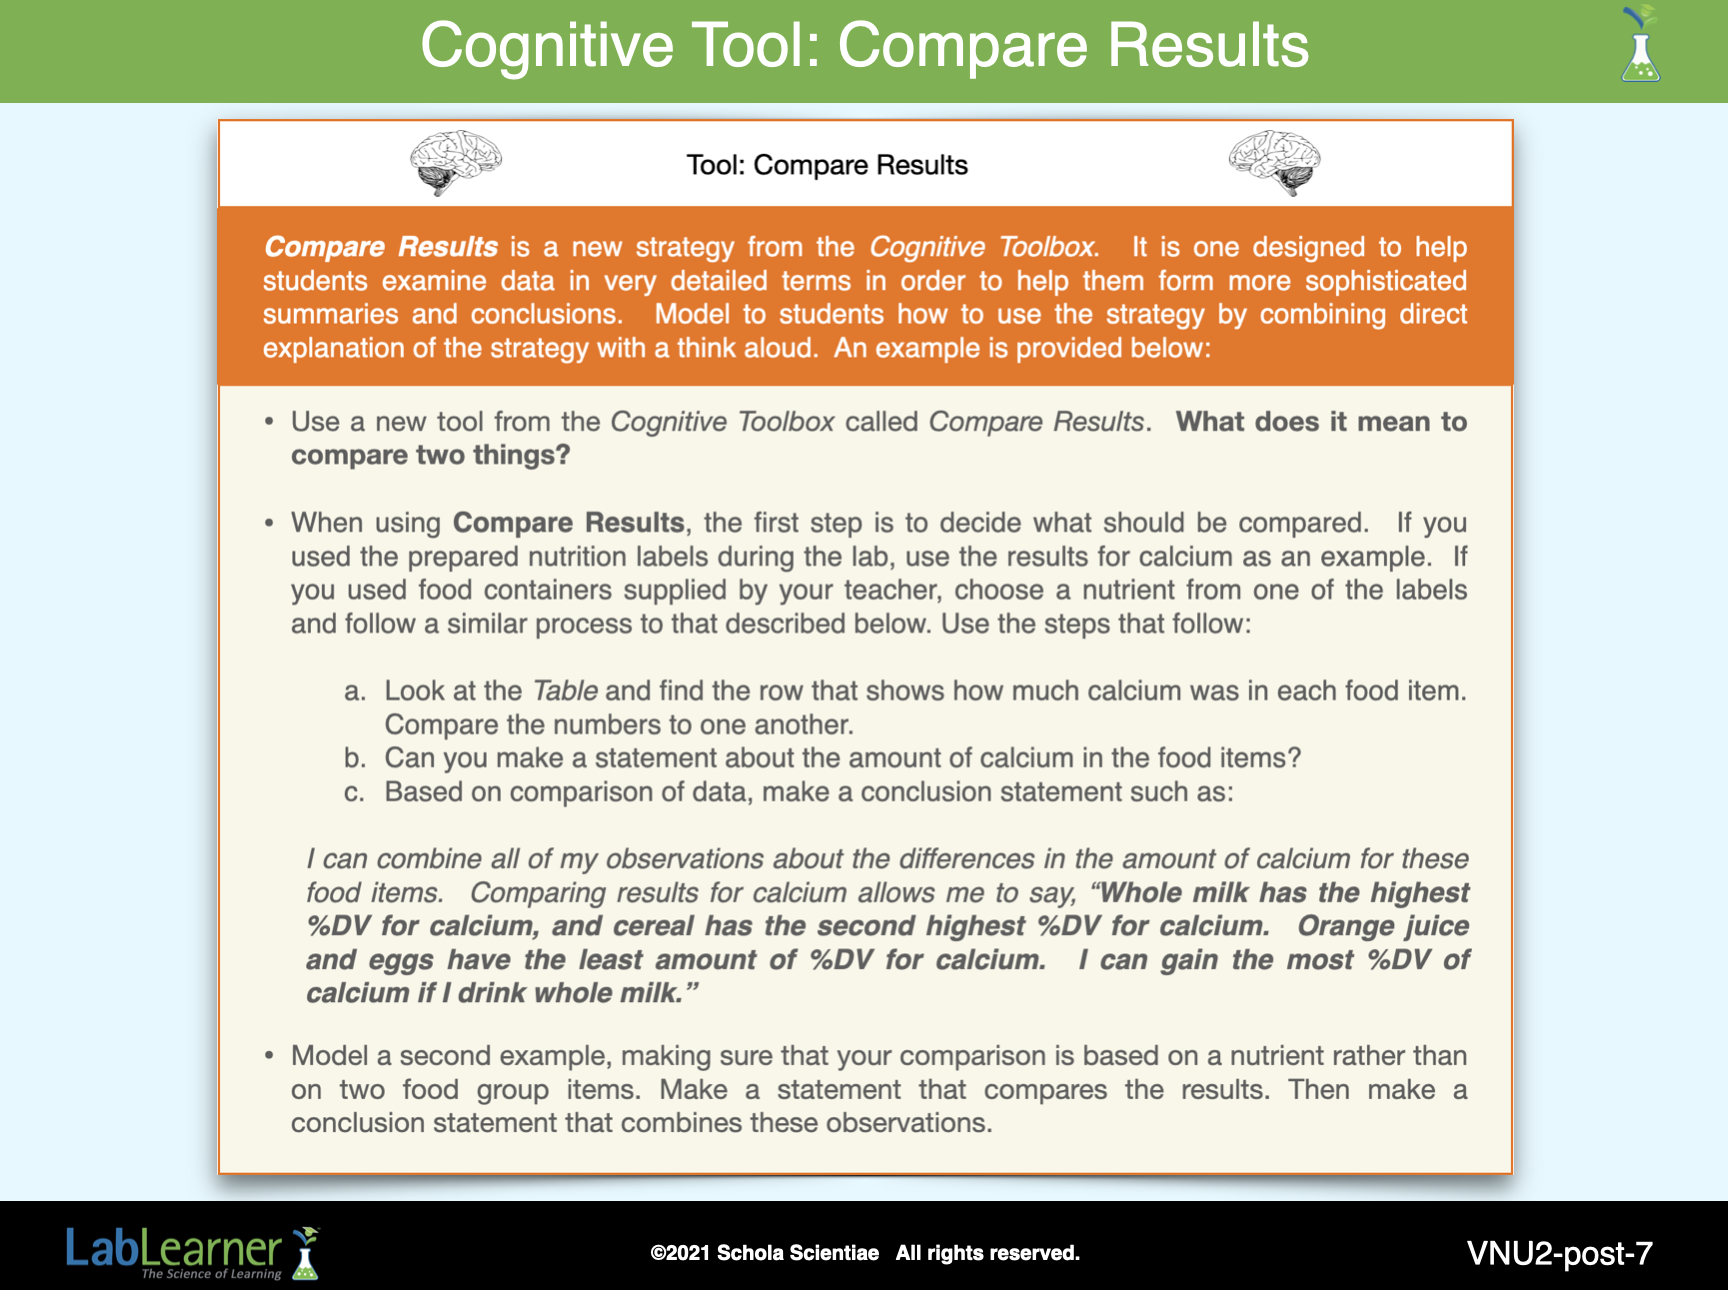
1. Tell students they will use a new tool from the Cognitive Toolbox called Compare Results.
Ask Students: What does it mean to compare two things? Students may indicate that two quantities or objects are compared according to a property. For example, mass, color, or composition could be compared.
2. Explain that when using Compare Results, the first step is to decide what should be compared. If students used the prepared nutrition labels during the lab, explain that they will use the results for calcium as an example. If students used food containers supplied by the instructor, choose a nutrient from one of the labels and follow a similar process to that described below. Use the steps that follow to model the process that follows after they have decided what to compare.
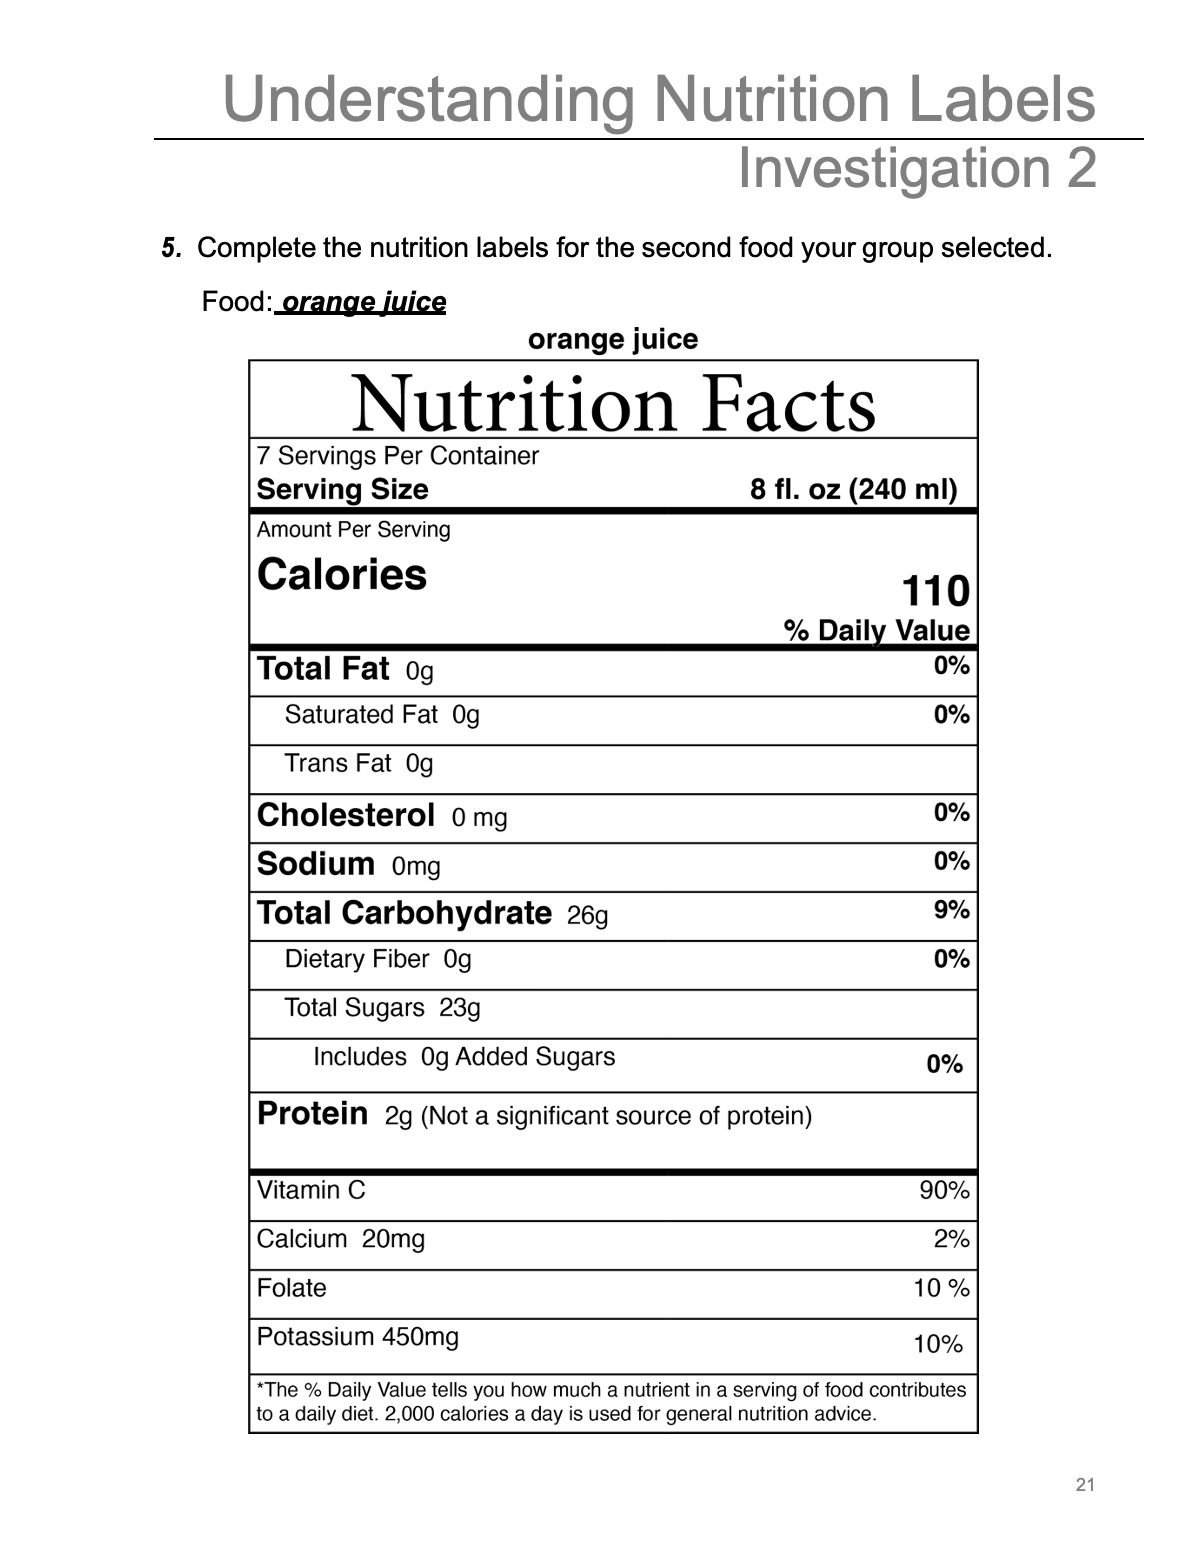
a. Direct students to look at the Table and find the row that shows how much calcium was in each food item. Compare the numbers to one another. Students should observe that the amount of calcium in the cereal is more than the amount of calcium in the orange juice. Cereal has 10%DV for calcium, while juice has 2%DV.
b. Ask students: Can you make a statement about the amount of calcium in the food items? Student answers may vary.
c. Continue to model using the calcium example and invite students to contribute statements. Then, model a conclusion statement:
I can combine all of my observations about the differences in the amount of calcium for these food items. Comparing results for calcium allows me to say, “Whole milk has the highest %DV for calcium, and cereal has the second highest %DV for calcium. Orange juice and eggs have the least amount of %DV for calcium. I can gain the most %DV of calcium if I drink whole milk.”
3. Model a second example, making sure that your comparison is based on a nutrient rather than on two food group items. Make a statement that compares the results and invite students to contribute specific statements. Then model a conclusion statement that combines these observations and invite students to contribute statements.
______________________________________________
SLIDE VNU2-post-8
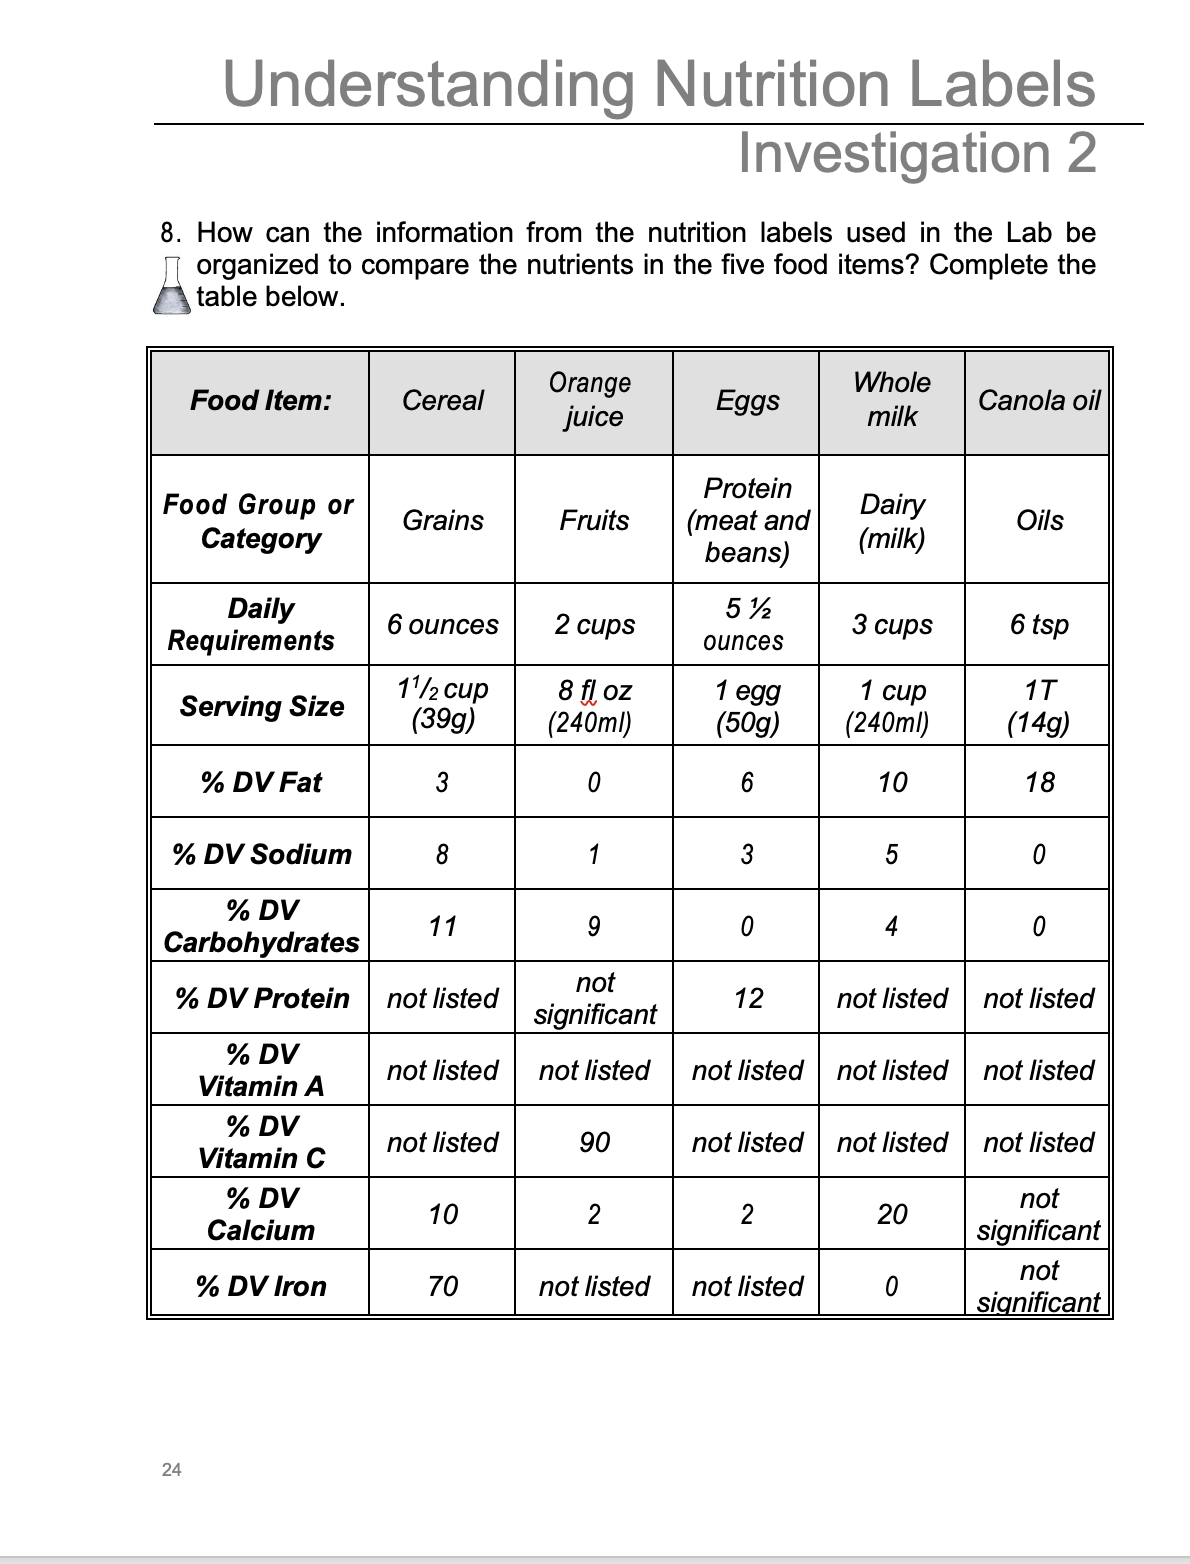
6. Ask students the following questions and refer to the Table as you discuss the responses with the class. Answers provided are based on values from the sample table.
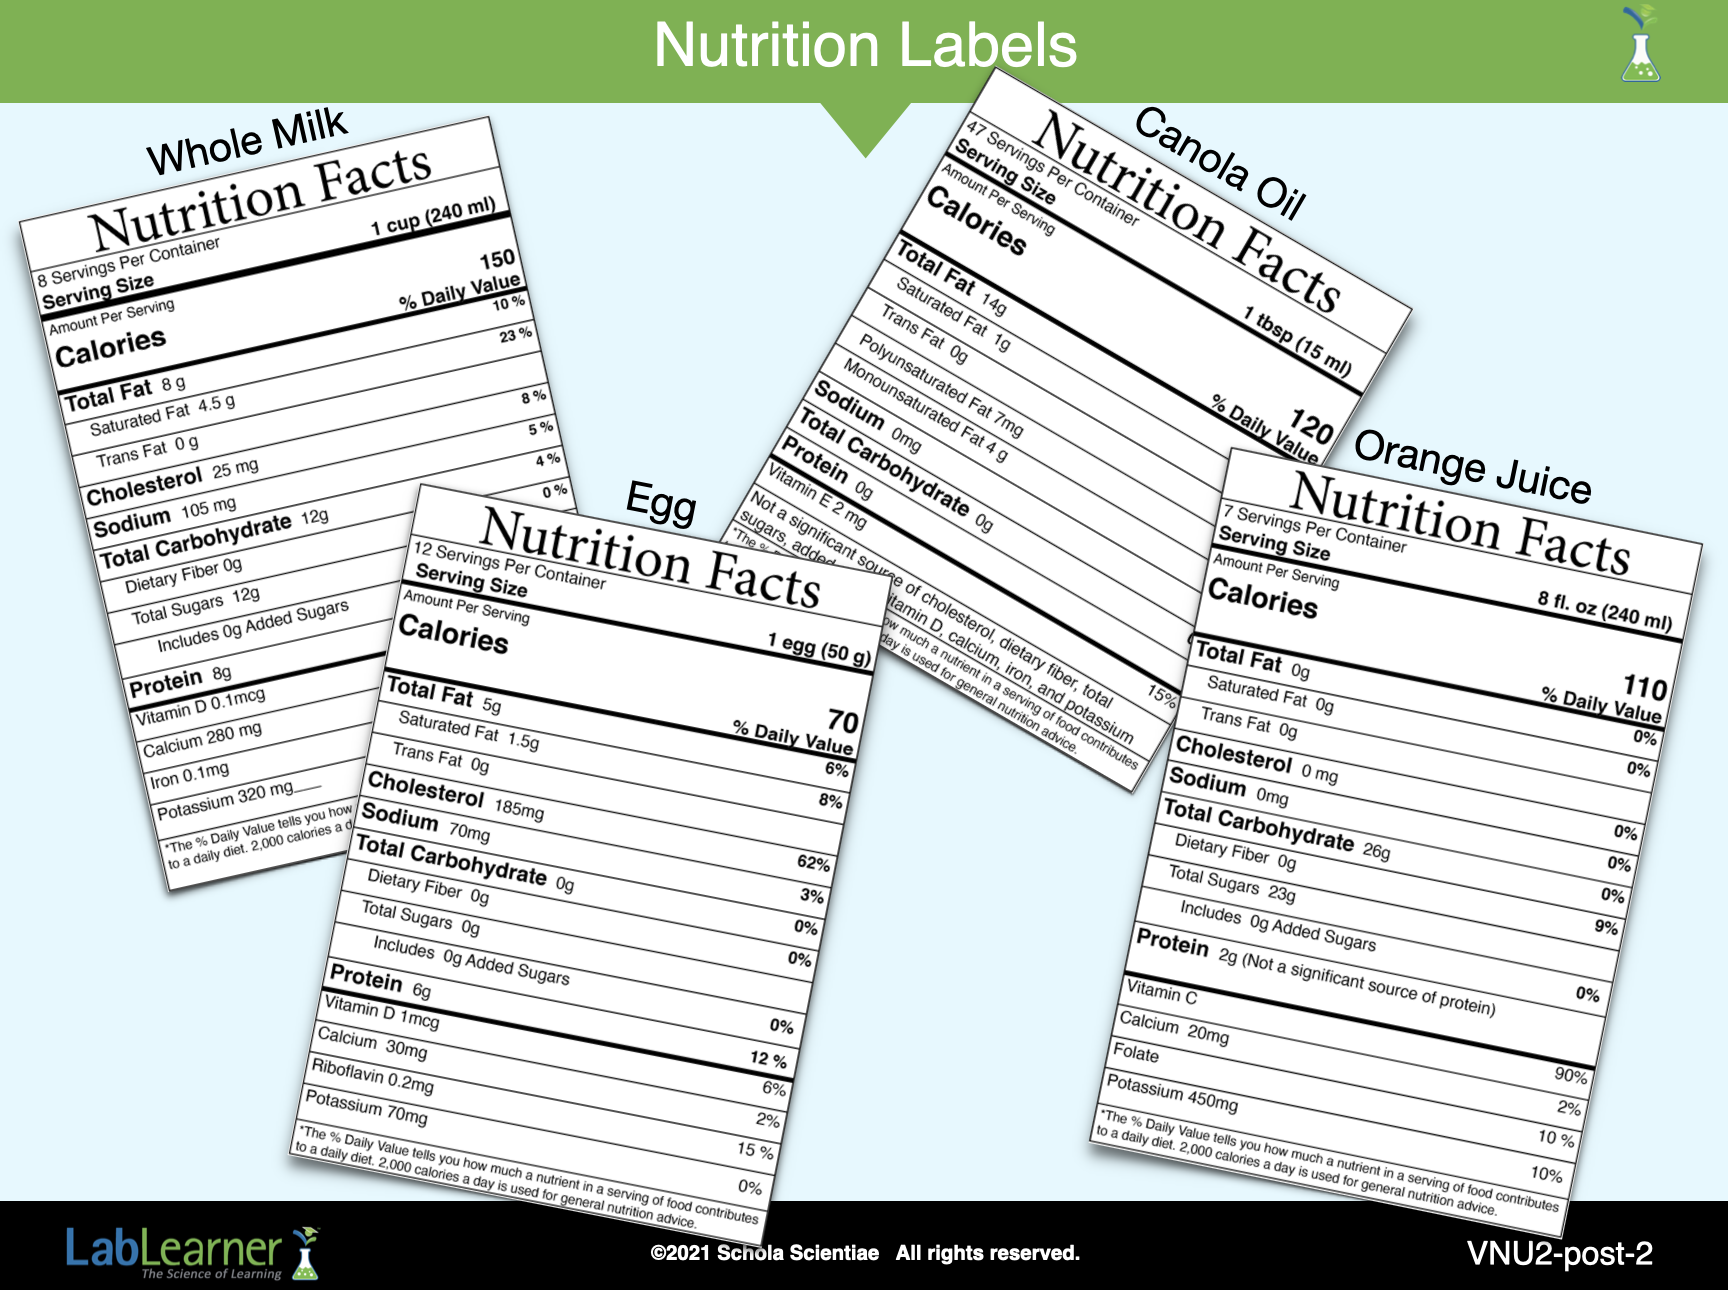
a. Ask students: Does one serving of a particular food group differ from one serving of another food group? Yes. Using the answers from the sample table: a serving size of canola oil is one tablespoon, whereas a serving of milk is 1 cup or 240 ml; a serving of orange juice is 8 fluid ounces or 240 ml; a serving size of an egg is 1 egg or 50 grams, but a serving size of cereal is 39 grams or 1 ½ cups.
b. Ask students: Do you notice any other differences in the way a serving size is described? Students should indicate that two types of measurements are used, the Metric System and the English System of Measurement. Students also should notice that liquids and solids are measured differently. In the metric system, liquids are measured by their volume in milliliters, and solids are measured by their mass in grams. In the English system, both liquids and solids may be measured in cups and ounces.
Note to Teacher: It may be necessary to explain to students that the terms cups and ounces are used to indicate different types of measurements, depending upon whether the item to be measured is a solid or a liquid. For example, ask students to think of when they or their parents cook. There are cups used to measure dry ingredients and cups to measure liquid ingredients. When the term ounce is used, generally a liquid is measured in fluid ounces and a solid simply in ounces.
c. Ask students: Why do you think most of the food items do not list a %DV for protein? Student answers will vary.
d. Explain to students that one reason that information about Recommended Daily Values for nutrients appears on food labels is that scientists found that there are some nutrients that people either have too little of or consume in excess. Scientists and the Food and Drug Administration wanted to help people obtain the amounts of these nutrients that they needed. These nutrients have the Percent Daily Value on the nutrition label. When scientists did their research, protein was not one of the nutrients that people either consumed too little of or in excess. That’s why the Percent Daily Value is not required on nutrition labels. Protein is only required to be listed if the manufacturer states that the food item is high in protein or over 15% of the Daily Value.
e. Ask students: What are the nutrients listed in the next four rows? Vitamin A and C are included in the vitamin nutrients that are needed by the body. Calcium and iron are mineral nutrients.
f. Explain to students that when a nutrient is listed as not significant, this means that there is not enough of the nutrient to list it on the label.
Ask students: How much of the Daily Value of vitamin and mineral nutrients will this meal provide? Students should find that this meal provides 0% vitamin A, 90% vitamin C, 34%calcium, and 70% iron of the Daily Values.
g. Ask students: Do all foods have the same nutrients? Do all foods have the same amount of nutrients? Students should indicate that foods do not have the same nutrients, nor do they have the same amount of nutrients.
h. Ask students: Can you use what you now know about the different nutrients in different foods to answer the following question: Why do you think you should eat foods from the five food groups and the oils in MyPlate? Students should indicate different foods provide different nutrients. Eating foods from all five of the food groups and the oils group in MyPlate will help supply the body with the nutrients it requires each day.
______________________________________________
SLIDE VNU2-post-9
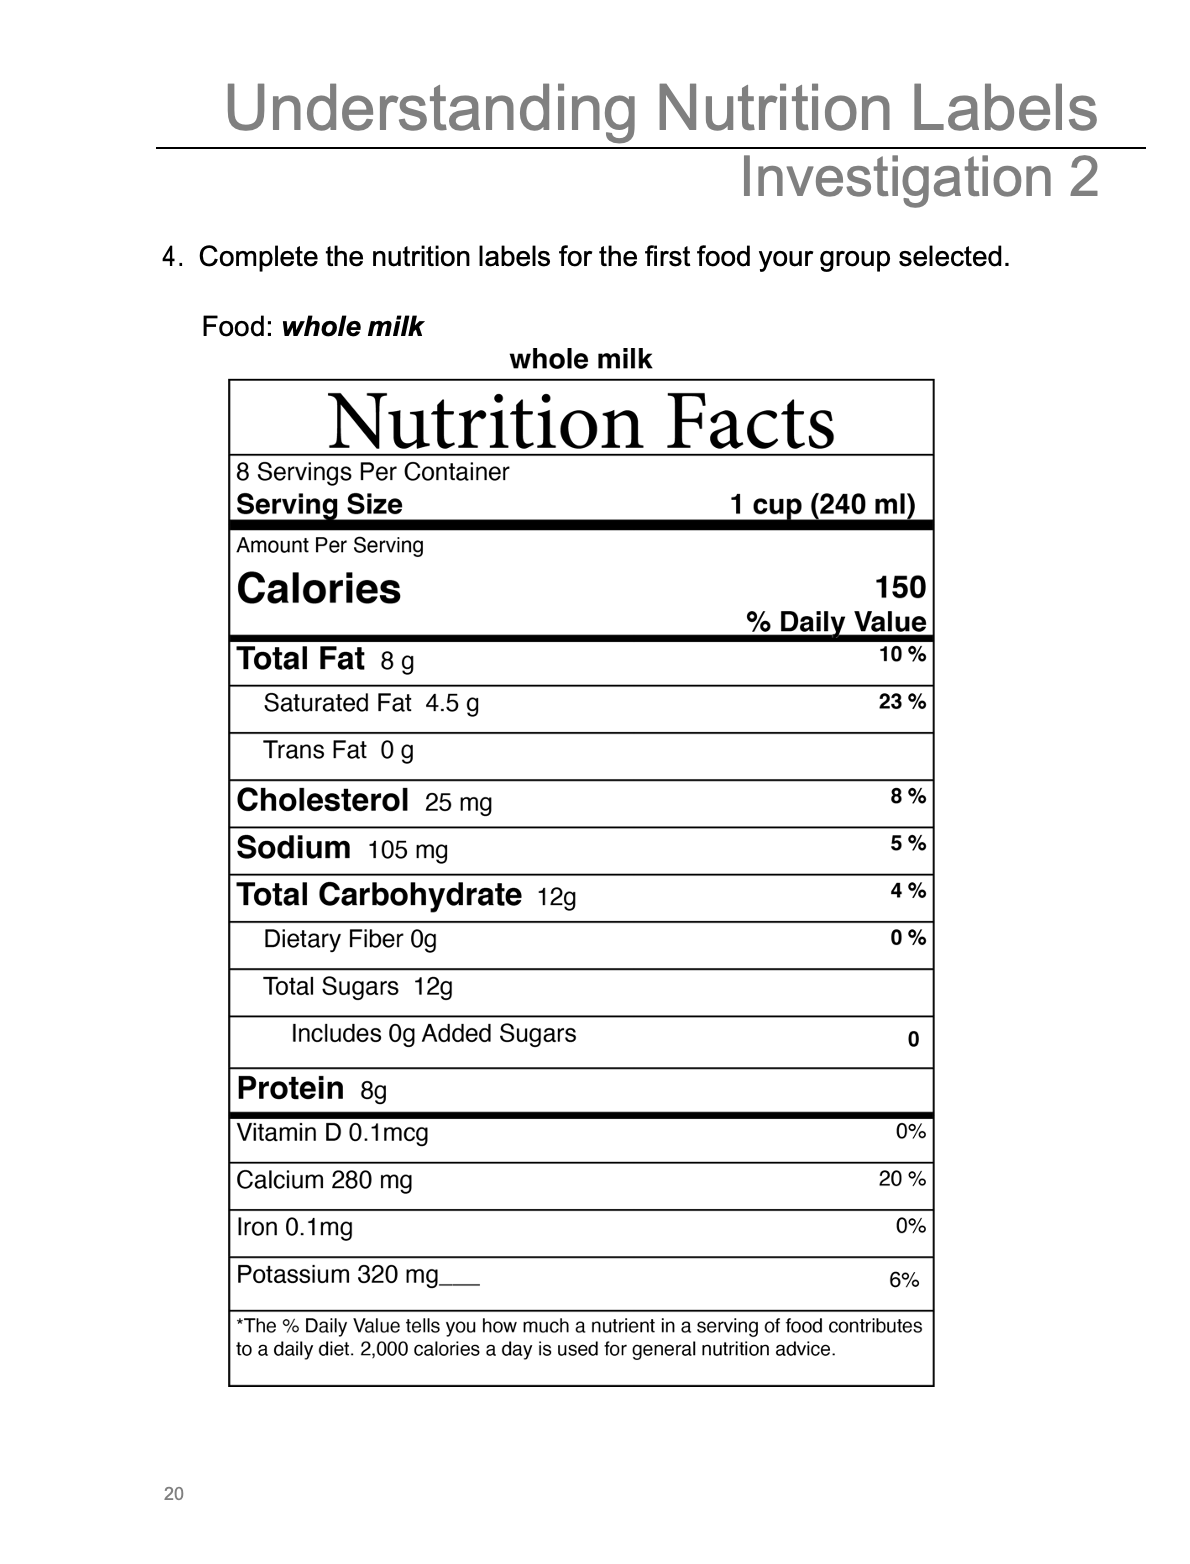
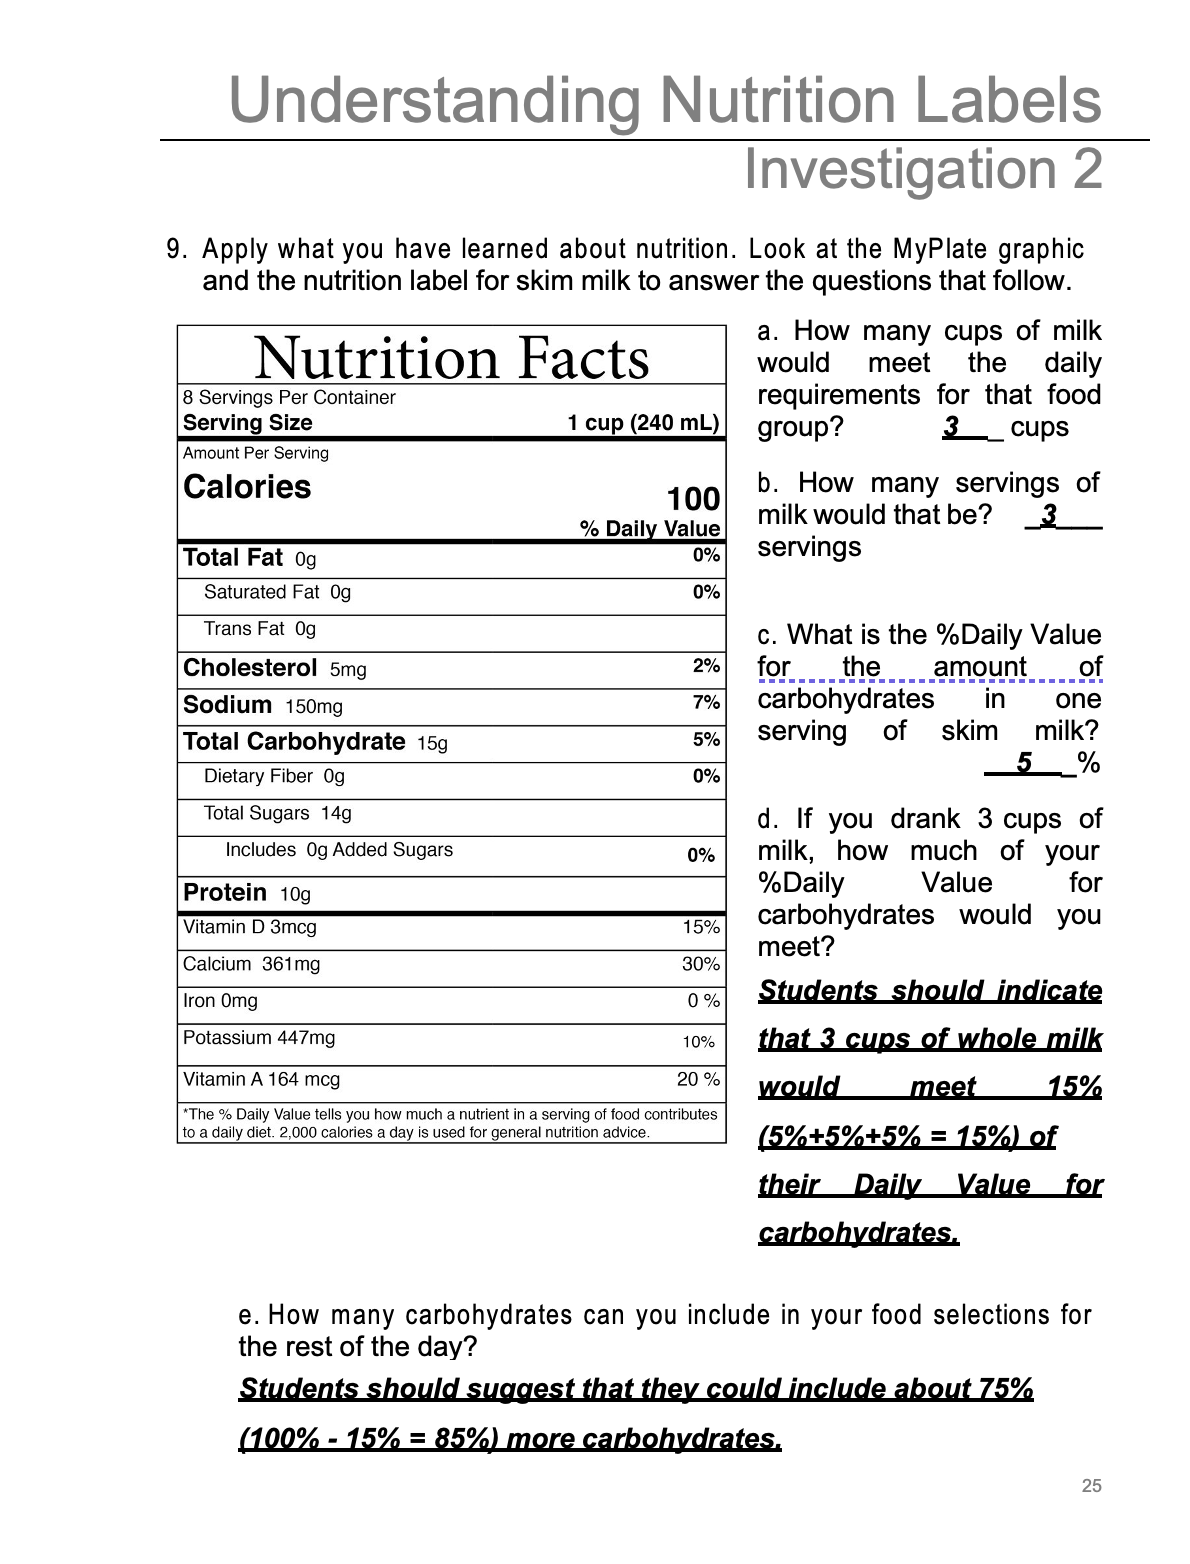
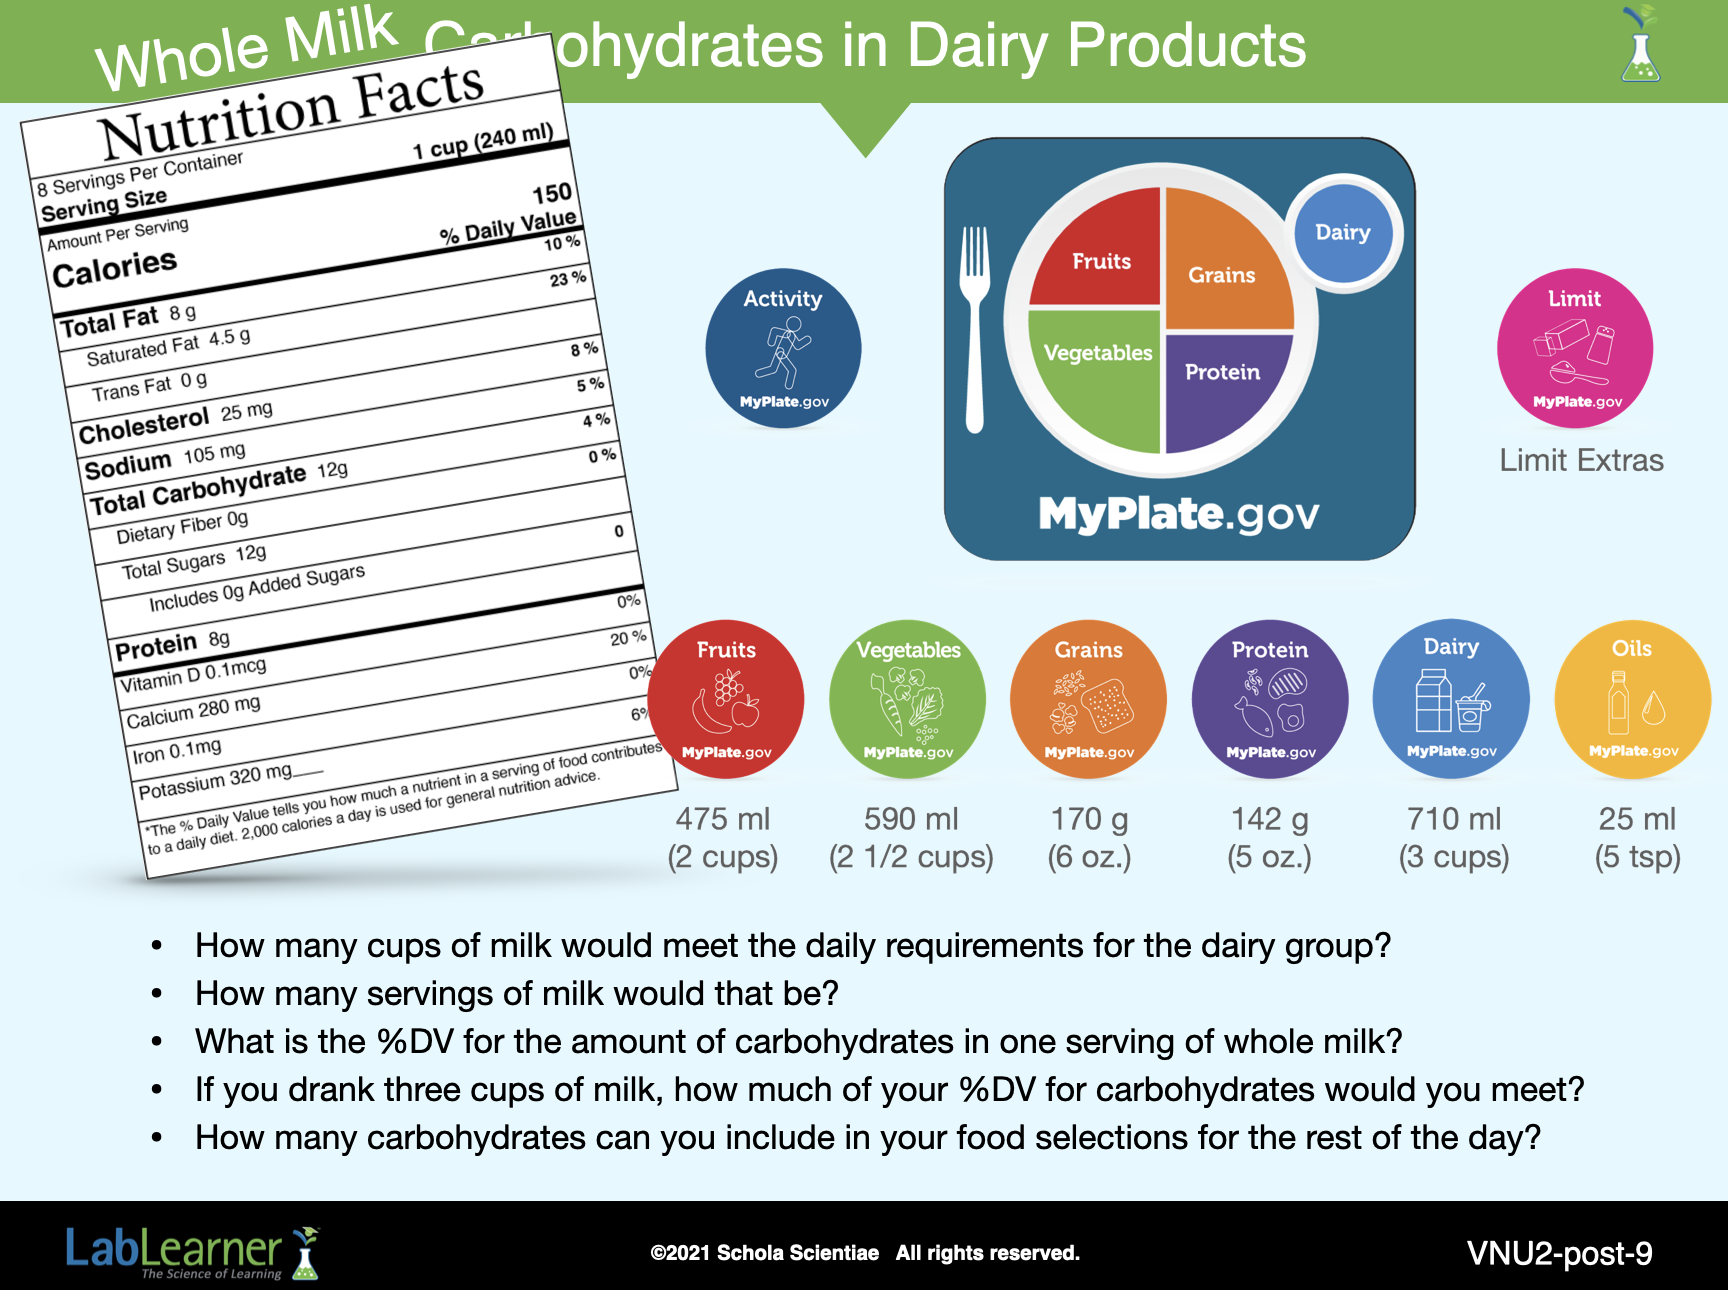
7. Encourage students to apply what they have learned about serving size, %DV, and nutrition labels by engaging them in the following activity. Direct students to look at the recommended daily amount needed each day from the dairy group on the MyPlate graphic and the %DV for carbohydrates for milk on the nutrition label for milk in Problem 9 of their Student Data Record.
a. Divide students into five groups and write the following questions on the board. These questions can also be found in Problem 9 of the Student Data Record.
• How many cups of milk would meet the daily requirements for the dairy group?
• How many servings of milk would that be?
• What is the %DV for the amount of carbohydrates in one serving of whole milk?
• If you drank three cups of milk, how much of your %DV for carbohydrates would you meet?
• How many carbohydrates can you include in your food selections for the rest of the day?
______________________________________________
SLIDE VNU2-post-10
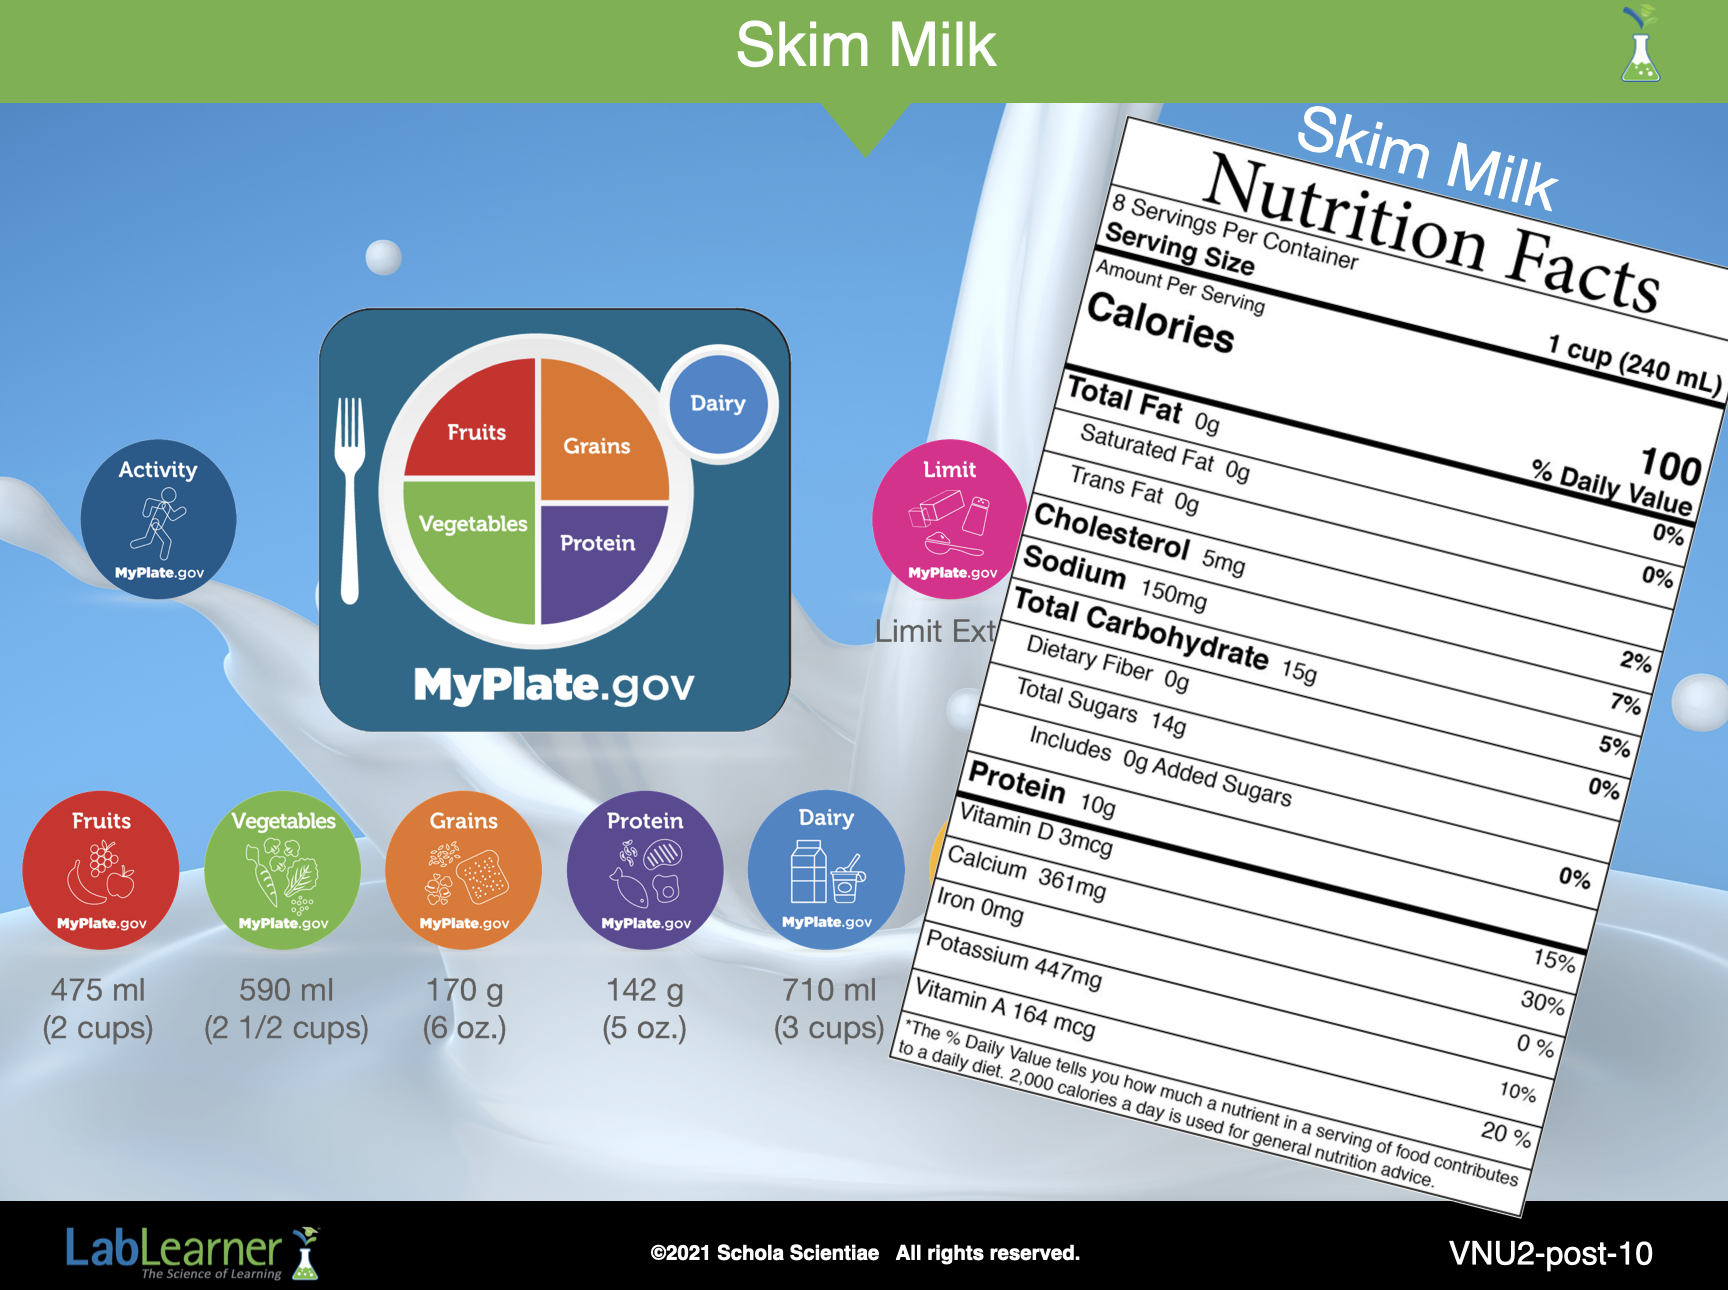
b. Encourage students to work within their groups using the nutrition label for skim milk to solve and record the answers in their Students Data Record. After a sufficient amount of time, review the questions with the class.
- Ask students: How many cups of skim milk would meet the daily requirements for that food group (dairy)? Students should suggest that 3 cups of milk would meet the daily requirements.
- Ask students: How many servings of skim milk would that be? Three servings.
- Ask students: What is the %DV for the amount of carbohydrates in one serving of skim milk? Students should indicate that the %DV is 5%.
- Ask students: If you drank three cups of skim milk, how much of your %DV for carbohydrates would you meet? If necessary, write the calculation on the board. Students should indicate that three cups of whole milk would meet 15% (5% + 5% + 5% = 15%) of their Daily Value for carbohydrates.
- Ask students: How many carbohydrates can you include in your food selections for the rest of the day? If necessary, write the calculation on the board. Students should suggest that they could include about 85% (100% – 15% = 85%) more carbohydrates.
______________________________________________
SLIDE VNU2-post-11
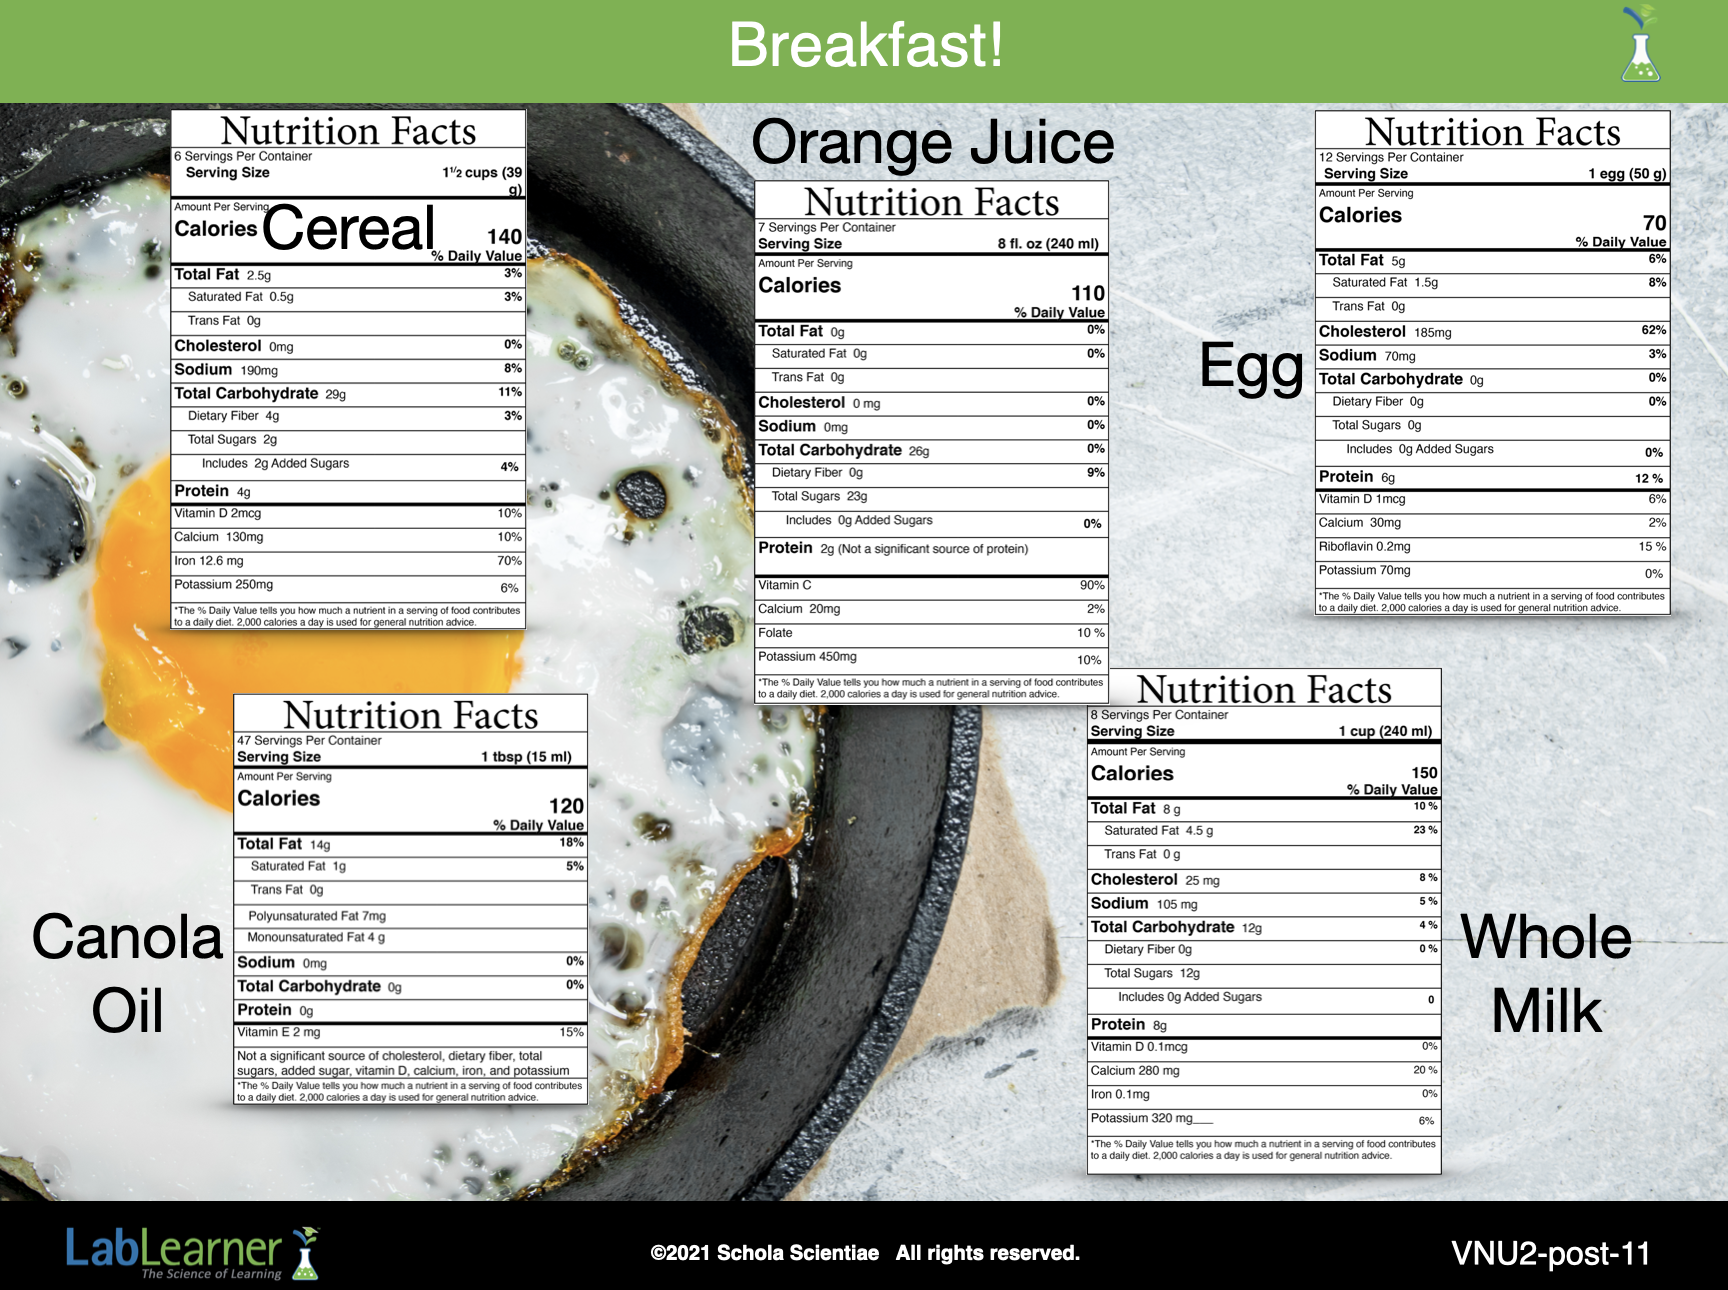
8. Encourage students to imagine that they are eating breakfast. Use the nutrition labels on the slide for this activity. The breakfast includes the following food items:
- 1 egg fried
- 1 tablespoon (T) of canola oil
- 1 cup of cereal in
- 1 cup whole milk
- 8 fluid ounces of orange juice
a. Ask students: What is the %DV of the following nutrients provided by this meal: fat, calcium, and carbohydrates? Work with students to answer this question. Because only one serving of each food item is included in the meal, the %DV for each nutrient can be added together.
Students should find that this meal provides 37% fat, 2% calcium, and 24%carbohydrates of the Daily Values.
b. Explain to students that when they think about how many nutrients they are consuming, they should remember that breakfast is only one out of the three meals they will eat.
Ask students: Are there any nutrients whose requirements were met by this meal? What types of food would be good to eat for other meals of the day? No. However, students should note that the %DV for fats is almost half of what is recommended as the Daily Value for one day. Therefore, although they should look for foods that will help supply these nutrients, they should be careful in selecting foods that will not exceed the Daily Value for fats. Students should also suggest that it would be wise to look for foods that contain calcium and carbohydrates.
______________________________________________
SLIDE VNU2-post-12
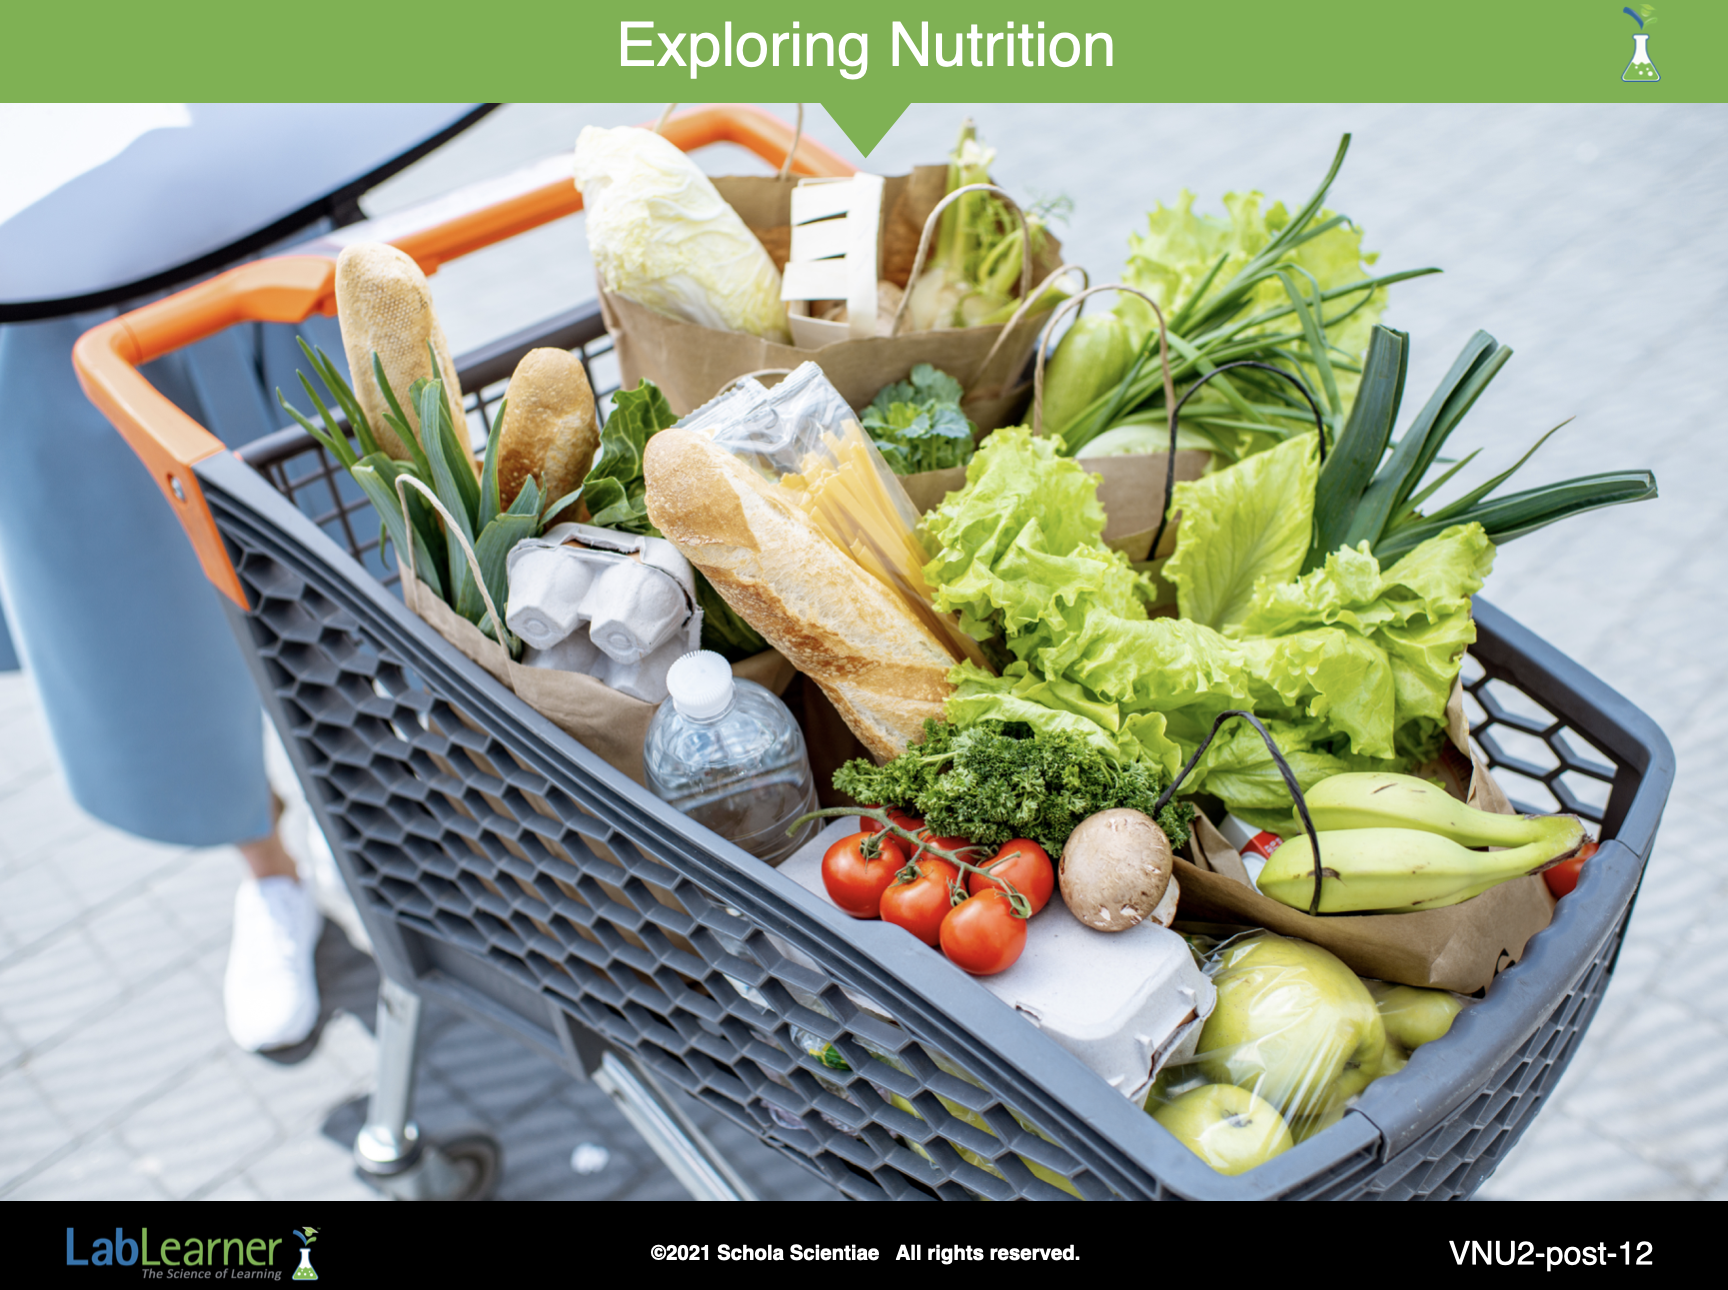
D. Help students to summarize how they can use the MyPlate graphic and nutrition labels on food items.
1. Ask students: How can you use the %DV on nutrition labels to help you maintain a healthy balance of nutrients? Students should indicate that they can use the %DV to compare nutrients and know which foods are higher or lower in nutrients.
2. Ask students: How can you use nutrition labels to meet the requirements in the MyPlate graphic? The serving size on nutrition labels can help compare the amount of food in a serving size to the amount of food recommended each day from each food group or category.
3. Ask students: Are there foods that do not have nutrition labels? Yes. Some foods such as fresh fruit and vegetables do not have nutrition labels.
4. Ask students: Does this mean that you should not eat fruits and vegetables? Why is it still important to eat from these groups, even if they do not have nutrition labels? Can you find out the types of nutrients that are in fresh fruits and vegetables? Students should indicate that it is still important to eat fresh fruits and vegetables because they contain important nutrients. Nutrition information for these foods can be found in books or on the internet. Some grocery stores may also list this information on fresh fruits and vegetables that are packaged in bulk.
5. Tell students that they have studied the six nutrients essential to the human body and the food groups and categories in the MyPlate graphic.
Ask students: How would you explain the relationship between these two things? Students should indicate that nutrients are substances found in foods. Food groups and categories are a way in which foods are organized to help people get all of the nutrients their bodies need in a day. The six nutrients are found in all the food groups and in the oil category in the MyPlate graphic.
E. To complete this Investigation, tell students they will continue to work with the MyPlate graphic and nutrition labels during the next Investigation. They will explore a type of nutrient called a carbohydrate. Tell students to think about the following questions as they conduct their exploration:
How many carbohydrates are in the foods I eat?
Are carbohydrates found in all the food groups and categories?
KEYS: POSTLAB