Teacher Portal:
Examining Nutrition
Investigation 2
Investigation One:
Understanding Nutrition Labels
Investigation One introduced students to the concept that digestion is the process of mechanically and chemically breaking down food into nutrients that can be used by the body for 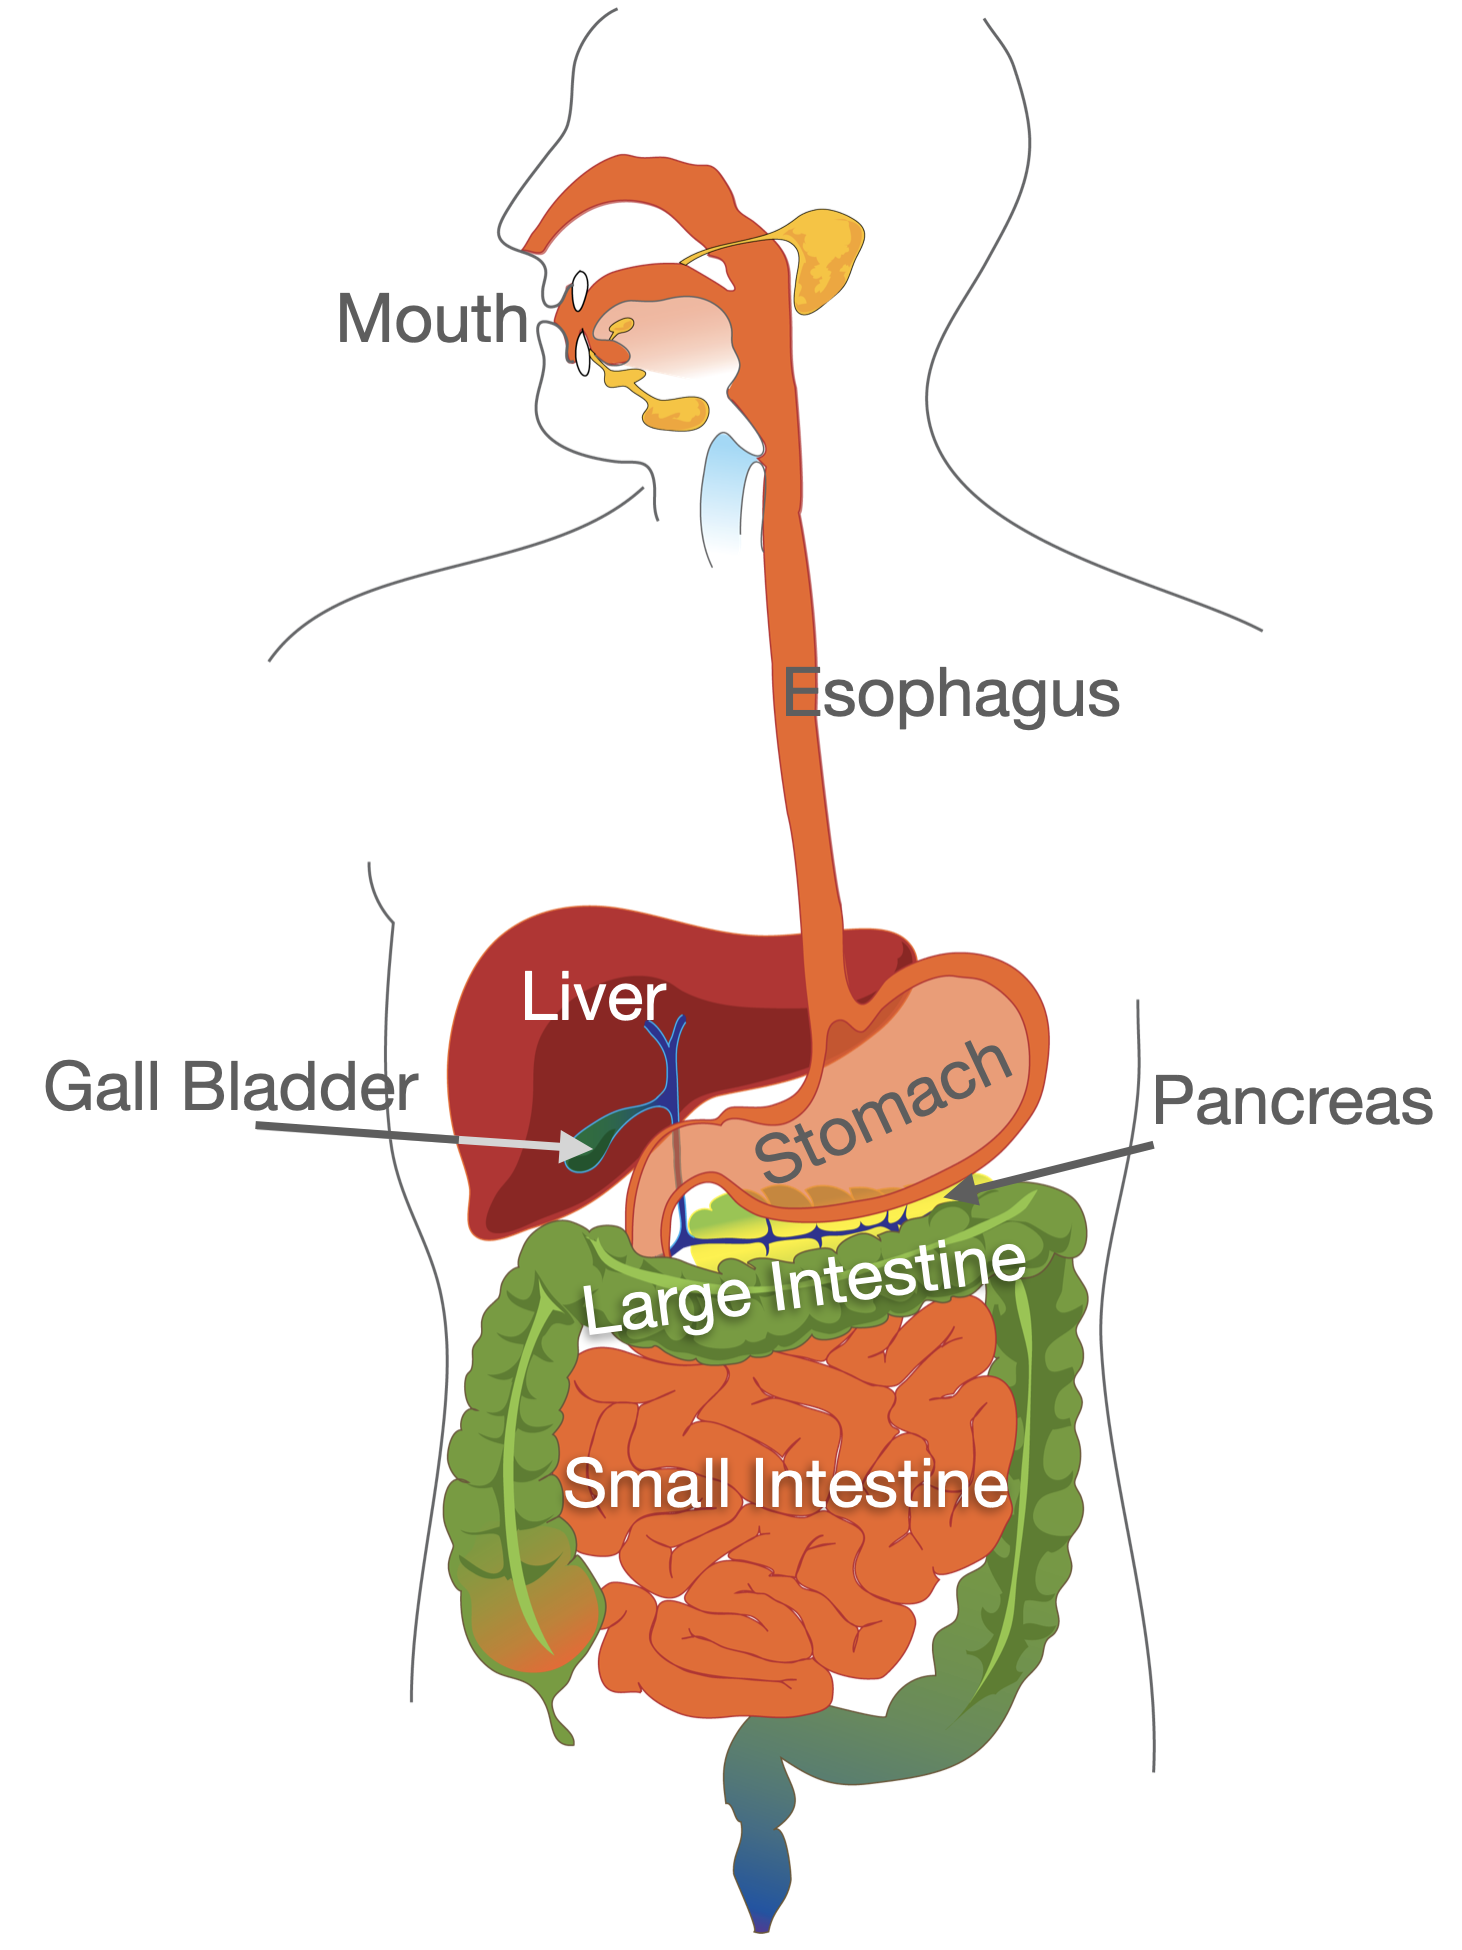 growth and energy. Students explored the structure of the digestive system through models and diagrams. Students then investigated the difference between mechanical and chemical digestion through experiments with chalk and vinegar. Students discovered that mechanical digestion is a physical change in the form of the food, but that no chemical change occurs. Students also discovered that chemical digestion results in chemical changes to the food as well as physical changes in structure, thus releasing the nutrients contained in the food. In Investigation Two, students will discover that scientists are able to quantify the different nutrients and determine how much of each nutrient a person needs every day.
Nutrition is the study of nutrients. Nutritionists evaluate the value of a particular food source based on its nutrient content and then use this information to recommend a daily diet that meets all of a person’s nutritional needs for a given physiological state. It should be noted here that the term diet is used in the classic sense; that is, a diet is simply the combination of food and water that a person consumes on a daily basis to meet his or her nutritional needs. In recent times, the word diet has come to be associated incorrectly with a nutrition plan designed to help a person lose weight. It is more appropriate to refer to this sort of nutrition plan as a restricted diet.

A growing child needs different proportions of energy and protein than an adult who is simply maintaining his or her weight. A pregnant woman has different requirements from both growing children and the adult in maintenance because of the additional demands placed on the mother’s body by the growing fetus. Activity level also plays a role in the body’s nutrient requirements. Therefore, the National Academy of Sciences maintains a database of estimated nutrient allowances for all human physiological states. This database is updated frequently as research determines additional information about the nutritional needs of humans. Nutritionists and dieticians can then use the database to determine how many grams of nutrients and the number of calories a person needs every day to meet someone’s nutritional needs. In order to formulate a nutritional plan, the nutritionist needs to know the amount of each nutrient in each type of food.
 Nutrition labels have undergone significant changes in recent years. Formerly, labels used the term U. S. Recommended Daily Allowance (U.S. RDA) to indicate the amount of vitamins, minerals, and protein required on a daily basis. In 1994, the Food and Drug Administration (FDA) discontinued that term because it was being confused with the National Academy of Science’s RDAs. The FDA has replaced the term U.S. RDA with Reference Daily Intakes (RDI) to represent the RDAs for vitamins and minerals and in some cases, protein. In addition, the FDA is now also using a set of dietary references for nutrients that have been added to food labels: fat, saturated fat, added sugars, cholesterol, carbohydrates, protein, fiber, sodium, and potassium. This group of dietary references is called the Daily Reference Values. The FDA has adopted the term Daily Value (DV) to refer to both RDIs and DRVs to avoid confusion for the public.
Food Nutrition Labels
Daily Values (DV) are the estimated amounts of nutrients that a person should try to consume on a daily basis. However, these values are only guidelines. Some people may need less of a particular nutrient while others need more. Food nutrition labels provide information on the total amount of a nutrient present in the food, as well as the %DV of that nutrient. The %DV of a nutrient indicates the percentage of the Daily Value for that nutrient that is contained in a food. This is based on the DV for a 2000-calorie diet. For example, the DV for fat in a 2000-calorie diet is 78 g. If a label indicates that a single serving of the contents contains 25% of the DV for fat, then the serving contains just over 19 g of fat, or 25% of 78 g.
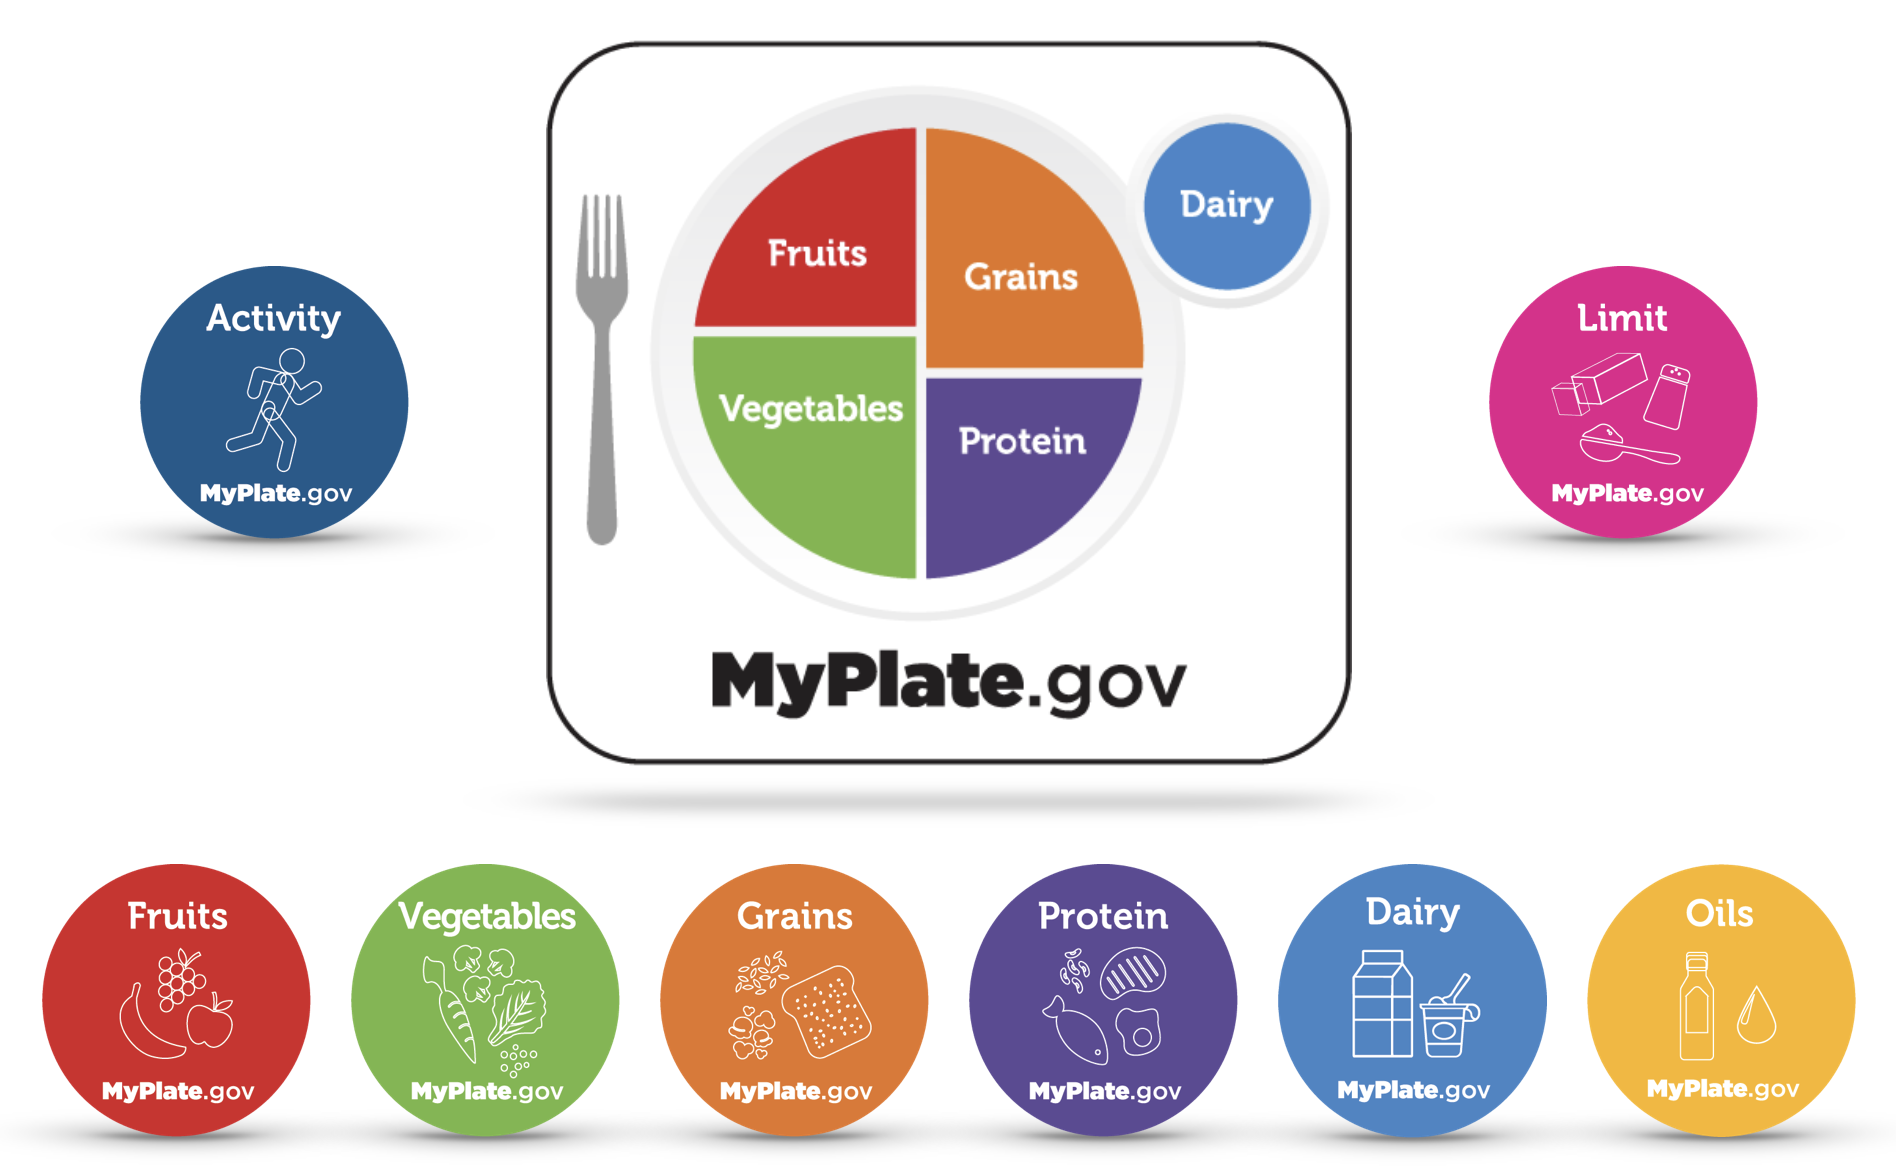
![]() All of this information may seem daunting and cumbersome to use when planning a weekly menu, as most consumers do not have the nutritional background necessary for balancing their diets mathematically in the same way that nutritionists do. Therefore, nutritionists at the USDA have used this information to prepare the MyPlate.gov for American consumers to use when planning meals. MyPlate graphics often include physical activities or a physical activity icon as a component of the daily nutritional recommendations, as the level of physical activity greatly influences the amount of calories a person can safely consume to remain healthy. The nutritionists at the United States Department of Agriculture (USDA) have divided the foods we eat into five major groups based on their nutrient content and source.
All of this information may seem daunting and cumbersome to use when planning a weekly menu, as most consumers do not have the nutritional background necessary for balancing their diets mathematically in the same way that nutritionists do. Therefore, nutritionists at the USDA have used this information to prepare the MyPlate.gov for American consumers to use when planning meals. MyPlate graphics often include physical activities or a physical activity icon as a component of the daily nutritional recommendations, as the level of physical activity greatly influences the amount of calories a person can safely consume to remain healthy. The nutritionists at the United States Department of Agriculture (USDA) have divided the foods we eat into five major groups based on their nutrient content and source.
Grains
The grains group represents all foods that are derived from grains. These include any product with a high content of flour, as well as cereals and whole grains such as oats and popcorn. Whole grain items are those items that contain all portions of grain kernels, including the hull. Refined grains are those that have had their hulls removed during processing. For example, brown rice is considered a whole grain because it still has its hull, but white rice is a refined grain because the hull has been removed by a polishing process.

Vegetables
The vegetables group is a very large category that is grouped together primarily as a result of their similarity in origin. However, all vegetables, characteristically, are high in vitamins and certain minerals, as well as fiber and water. Fruits are grouped for the same reasons as vegetables but are distinguished from vegetables by their greater content of natural sugars such as fructose.

Dairy
The dairy (milk) group contains all products made from milk. Nutritionally, milk products are good sources of calcium. Dairy products include milk, butter, cheese, yogurt, cream, and ice cream. Dairy products are derived or made from milk, and of course milk itself. Cows are the chief providers of milk in the US but other mammals like goats are known for milk and cheese products as well and are consumed more than cow’s milk in many areas of the world.
Sometimes eggs are included in the dairy food group. However, they should rightly be grouped with items like meat in the protein group. They are not obtained from mammals nor made from milk.

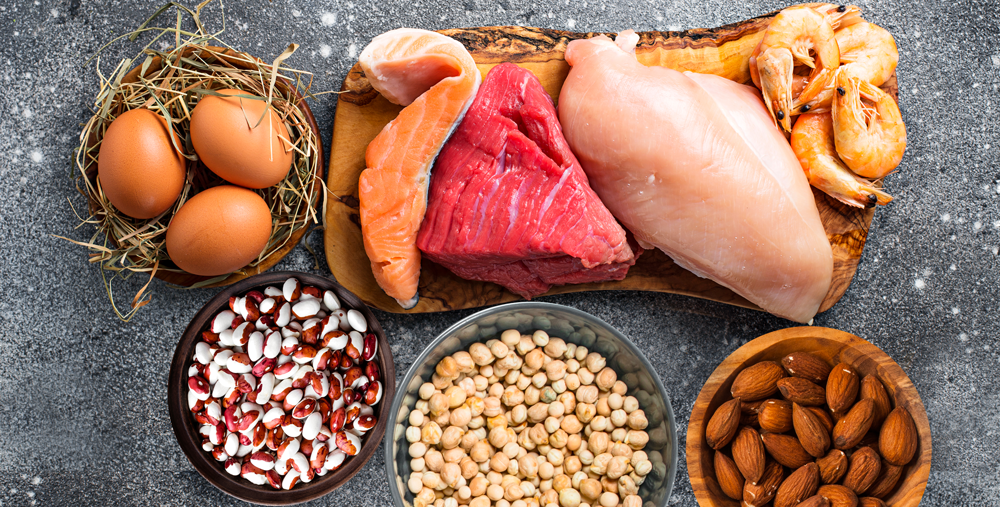
Protein
The final group is the protein (meat and beans) group. This group represents meats, dried beans, nuts, eggs, and poultry. Although at first glance this group may appear to be exceptionally diverse compared to the other four groups, the common denominator is their high level of protein. Also, notice that eggs are included in the protein category rather than the dairy group.
Every five years, the USDA reviews its nutrition recommendations to determine if any changes need to be made due to advances in nutrition research. They also make any changes needed in their food program, which is designed to promote healthy eating practices in American consumers. MyPlate represents a way to follow the daily dietary recommendations by eating healthfully from five major food groups. Additional graphics related to MyPlate represent oils and foods that should be limited in a daily diet.
Notice that for its illustrations, the USDA separates fruits from vegetables and adds an additional category of Oils. The oils group stresses that fats in the diet should be limited to a very small amount, with a focus on using oils rather than solid fats, such as lard, shortening, butter, and margarine, whenever possible. Oils have lower levels of saturated fats associated with the development of cardiovascular diseases.
Following this USDA guide helps to ensure that a person gets all the nutrients he or she needs each day to remain healthy. Sweets are considered an occasional treat rather than a regular part of the diet. Within this CELL, students will refer to these foods as “limited foods.”
It is important to note that some foods appear in more than one category or group. Dried beans and peas are in both vegetables and proteins groups. Beans, peas, and lentils belong to a special class of plants called legumes, which are richer in protein than other vegetables. Therefore, they are classified not only as vegetables but are also placed in the protein group because of their  protein content. Nuts and seeds are categorized with the protein group, but also appear in the list of foods that are high in oils. Many oils used in cooking are extracted from nuts and seeds.
In this Investigation, students will explore MyPlate and learn how to use it to make healthy food choices. The recommended amounts listed in the MyPlate that students will use in this CELL are based on those suggested by the USDA for children 9-13 years of age that participate in sixty minutes of physical activity a day. These amounts represent the average for both boys and girls within this age group. The recommended amounts in each of the food groups and categories would increase as children’s level of physical activity increases. In addition to exploring MyPlate in Investigation Two, students will also learn to read nutrition labels on packaged foods and make decisions on where these foods fit into the MyPlate recommendations
Examining Nutrition: Investigation 2 - Mathematics Concepts
Prelab
- parts/whole
- percentages
- problem-solving
- fractions
- volume in ounces, cups, teaspoons
- grouping/classifying
Lab
- parts/whole
- percentages
- fractions
- volume in ounces, cups, teaspoons
- grouping/classifying
- mass in mg and grams
- place value (ones, tens, hundreds)
- whole numbers
- data table
Postlab
- percentages
- parts/whole
- fractions
- whole numbers
- place value (ones, tens, hundreds)
- mass in mg and g
- division
- data table
- volume in ounces, cups, teaspoons
- addition
Examining Nutrition: Investigation 2 - Procedural Tools

Examining Nutrition: Investigation 2 - Cognitive Tools
Examining Nutrition:
Investigation 2 Quiz

