Teacher Portal:
Examining Exercise
Investigation 2 – PostLab
 PRINT IT
Use your browser to download a printable PDF as help during the slide presentation and to make additional notes. In your browser, go to File > Print and then choose to save as PDF.
NAVIGATE IT
Once the slide presentation is launched
- use your left and right arrows to advance or go back in the slide presentation, and
- hover your mouse over the left edge of the presentation to get a view of the thumbnails for all the slides so that you can quickly move anywhere in the presentation.
- Click HERE to launch the slide presentation for the CELL.
SHARE IT
SLIDE VEXEX2-post-1
This was the second Investigation of the LabLearner CELL Examining Exercise.
______________________________________________
SLIDE VEXEX2-post-2
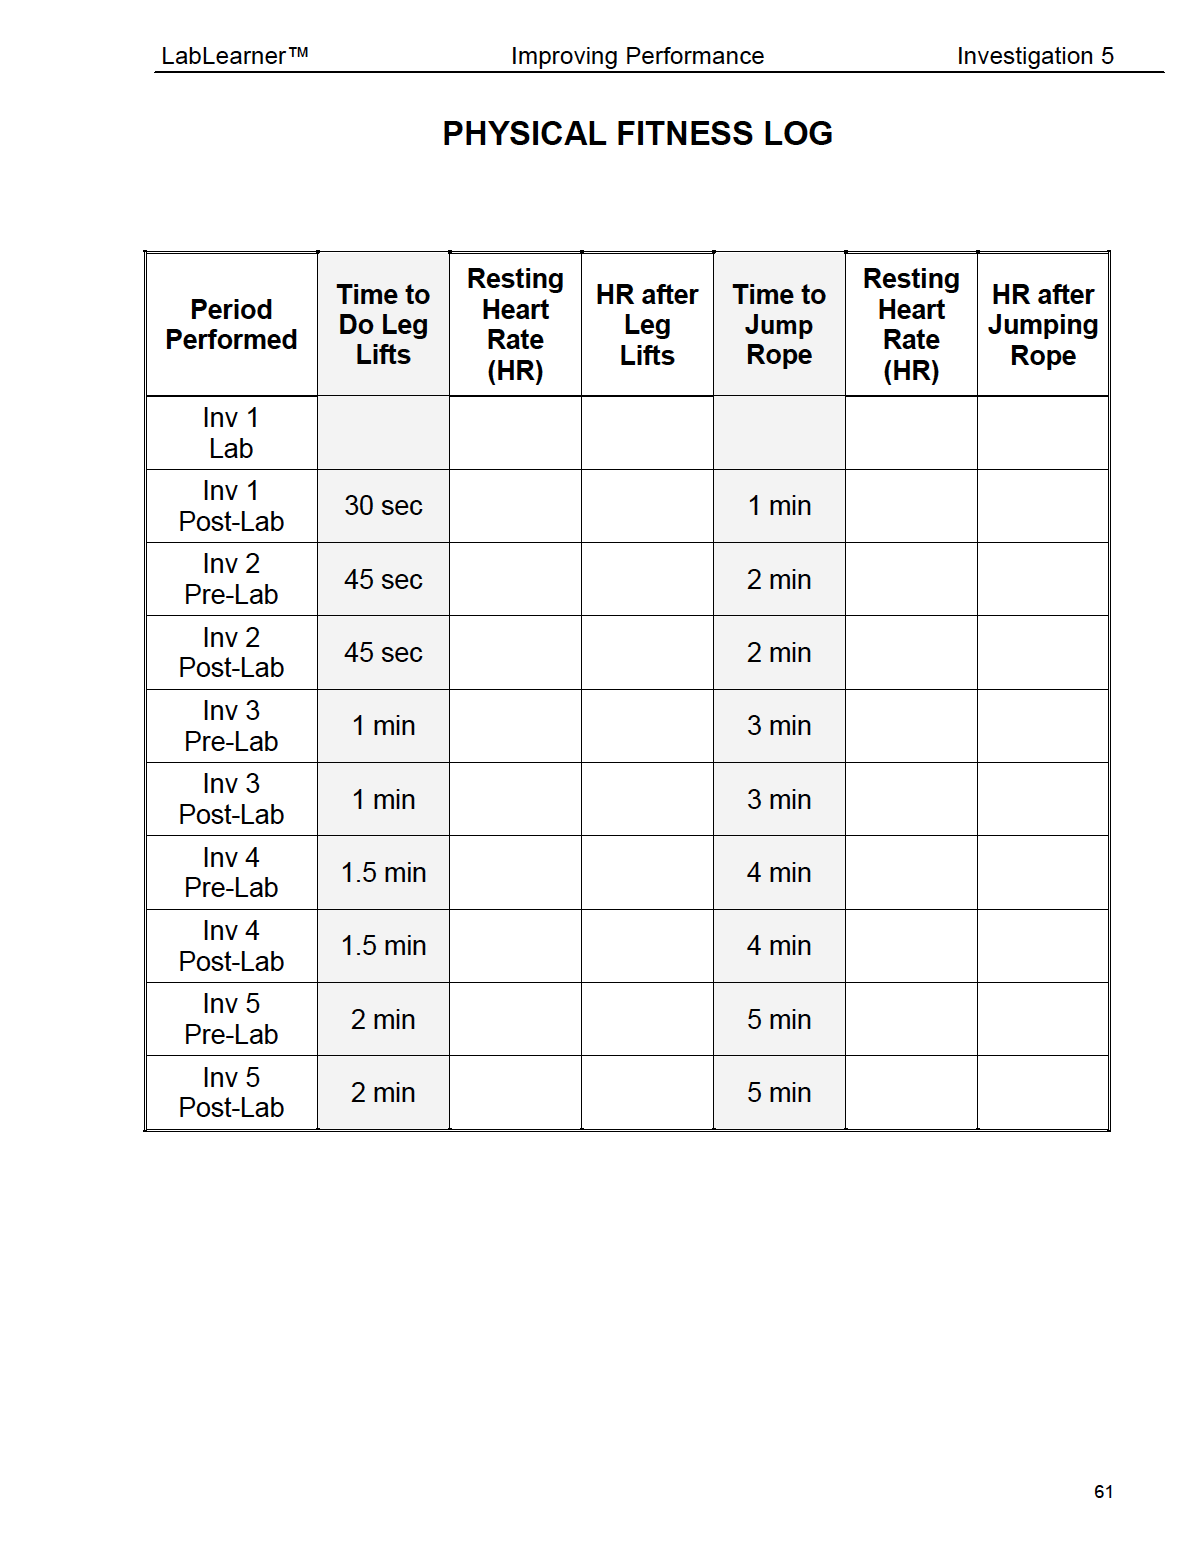
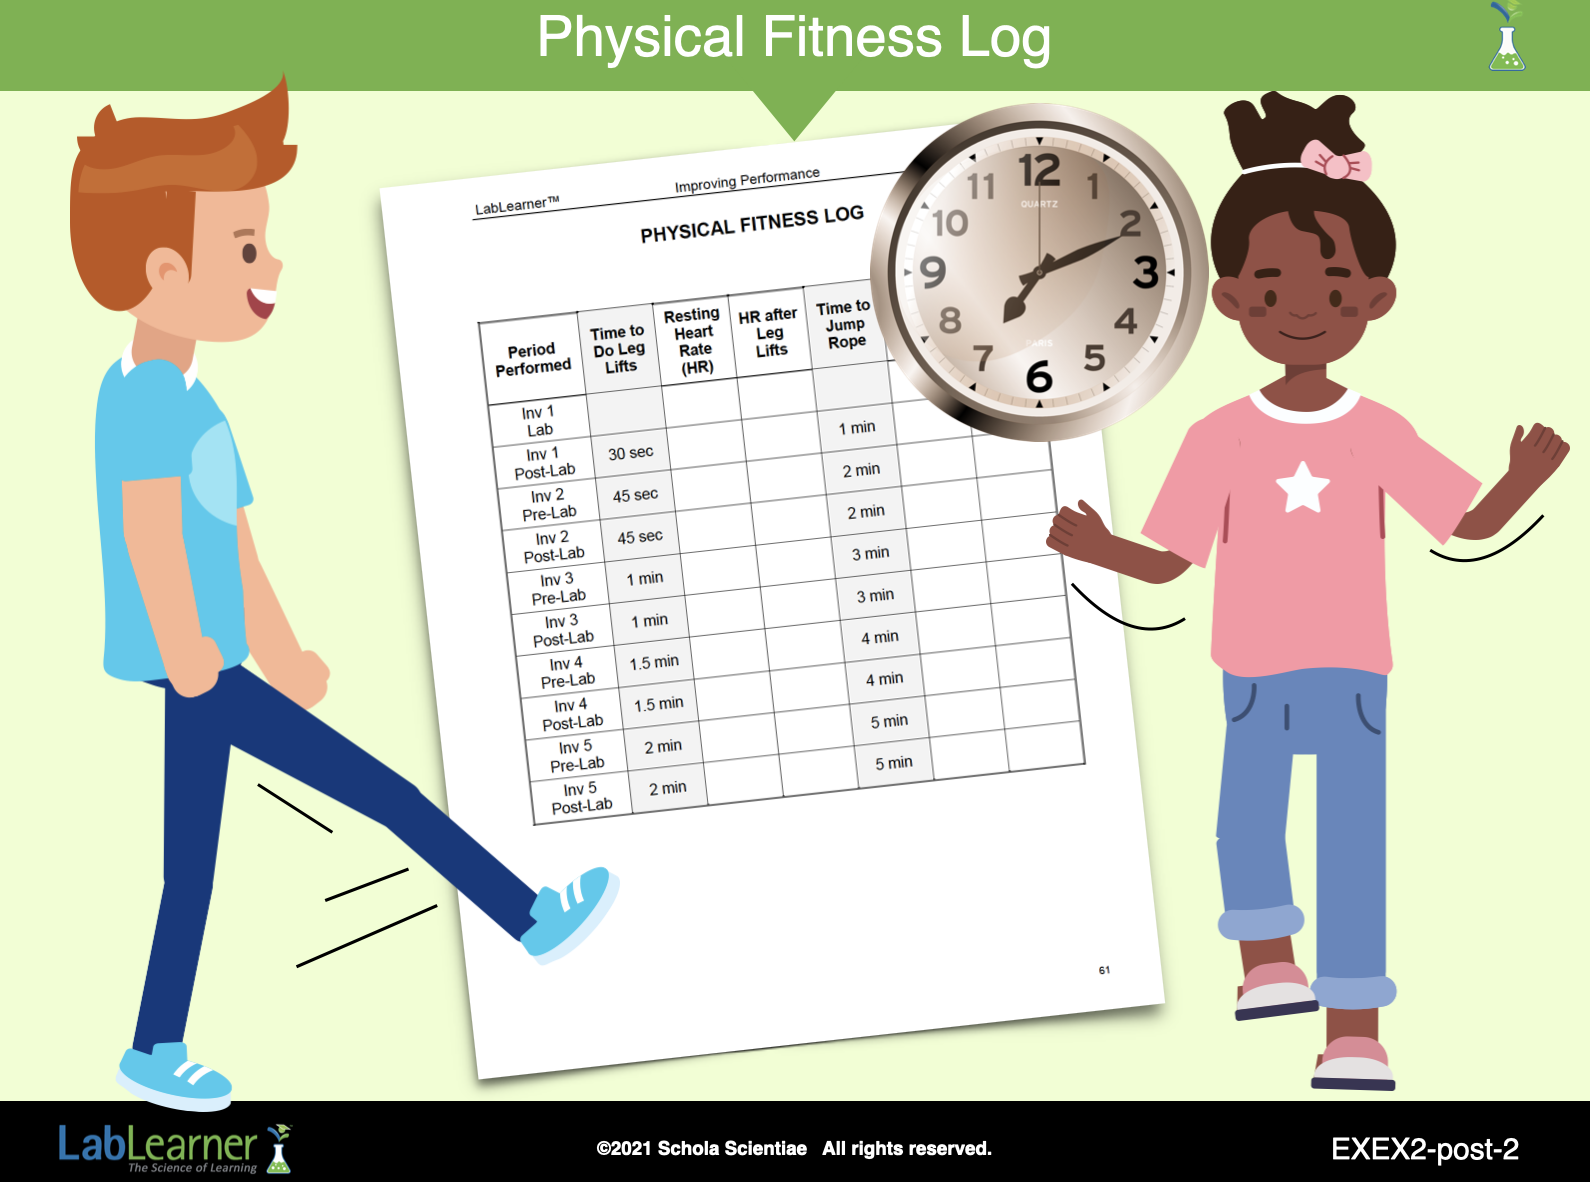
A. Begin this part of the investigation by directing students to locate their Physical Fitness Log at the end of their Student Data Record. Ask students to organize into their exercise pairs.
1. Direct students to follow the same procedure to complete their exercises as during the PreLab.
2. Students should first take and record their resting heart rates in the appropriate column before beginning their exercises.
3. Each student should perform their exercise, either the leg lift for each leg for 45 seconds or the jump rope activity for two minutes.
4. After students have completed their exercise, they should immediately take and record their heart rates in their Physical Fitness Log.
______________________________________________
SLIDE VEXEX2-post-3
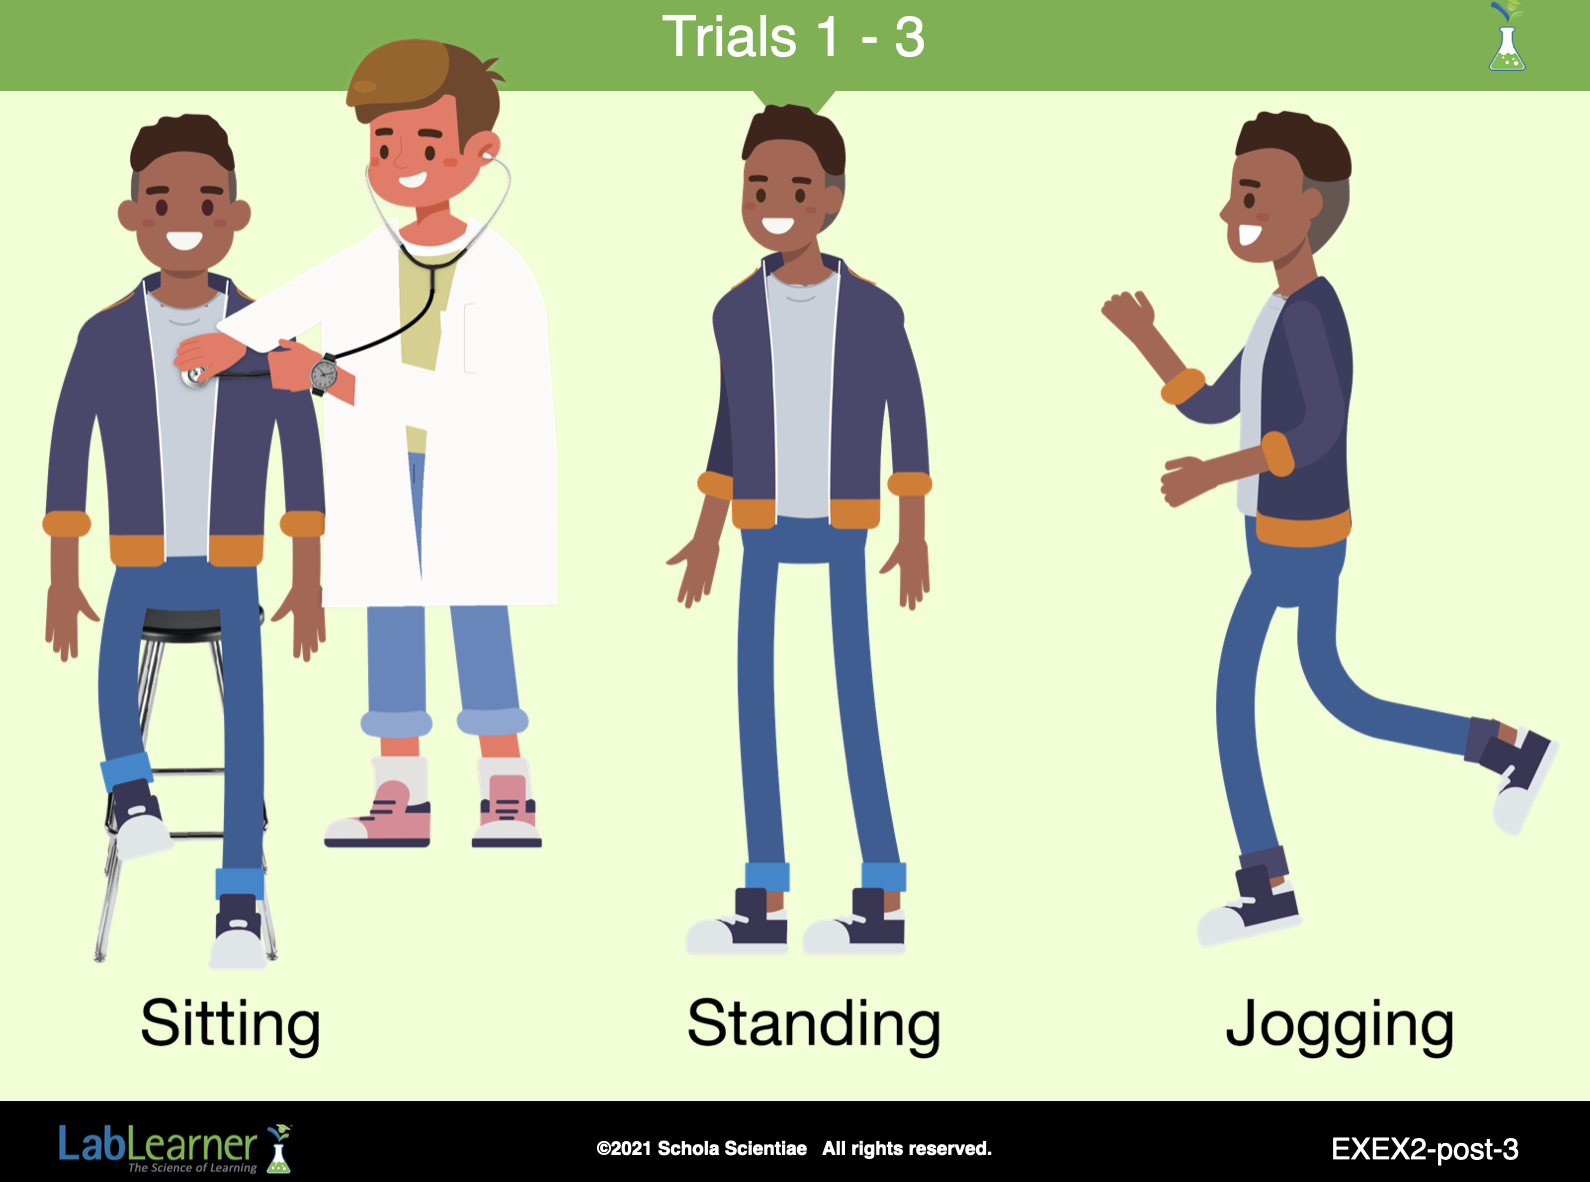
B. Begin the analysis of the Lab by asking students to summarize the experiments they conducted in the lab and their purpose. The following questions may be helpful in prompting student discussion.
1. Ask students: Can you remember the two main questions we investigated in the Lab? How does exercise affect your cardiovascular and respiratory systems? What is the long-term effect of cardiovascular training on the heart?
2. Ask students: How would you summarize what you did in the Lab in order to answer those questions? Students measured the heart rate and respiratory rate of another student as the student was sitting, standing, and after jogging. They also performed experiments in which they used models to compare differences in how the heart of someone who regularly participates in cardiovascular exercise (strong heart) pumps blood as compared to someone who does not regularly exercise (normal heart).
C. Continue to review the experiments. Analyze the experiment conducted to compare the heart rates and respiratory rates while performing different levels of activity. The following questions and group activities are designed to prompt discussion:
1. Ask students: What were the two types of data you collected? Heart rate and respiratory rate.
2. Ask students: Under what conditions was the data collected? The data was collected from the athlete when he/she was sitting, standing, and jogging in place.
3. Ask students: What type of graph could be used as a good way to analyze the data from the experiment? A line graph would be well suited for this data because there are three data points that illustrate a progression of activity.
______________________________________________
SLIDE VEXEX2-post-4
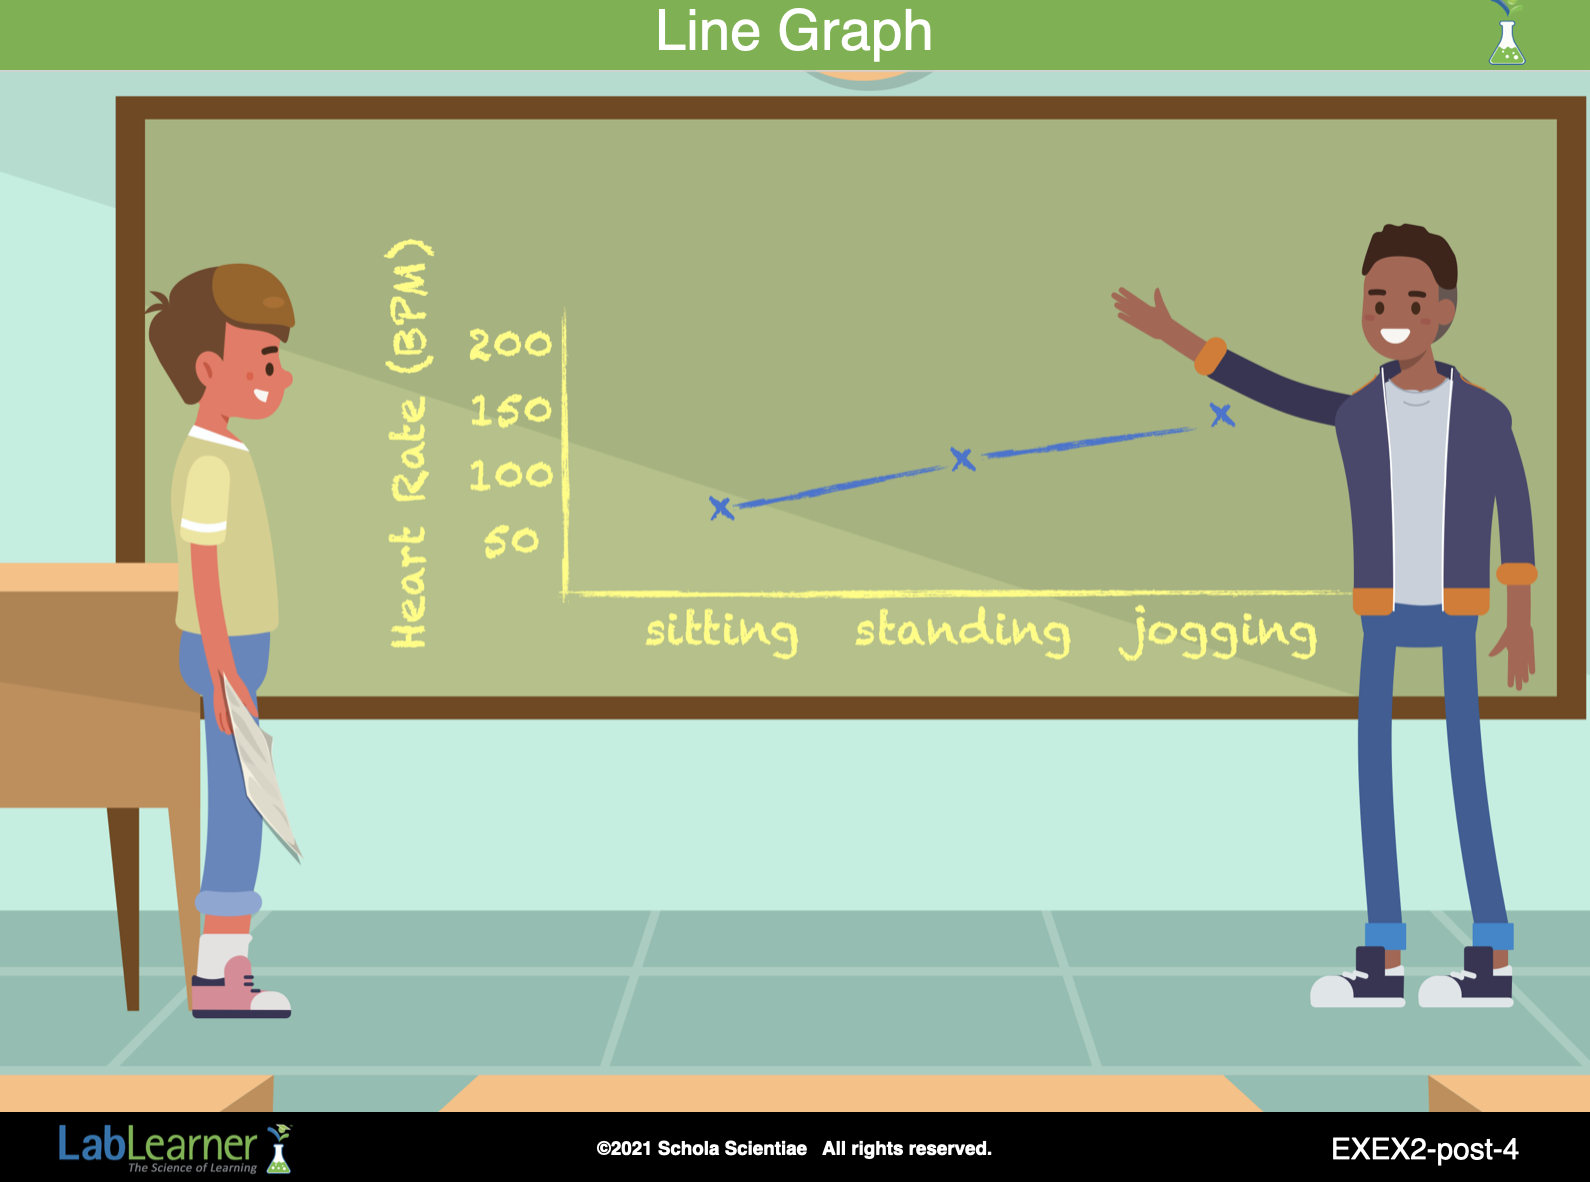
4. Organize students into cooperative groups. Instruct them to develop a line graph using the data they collected from the heart rates. Students may need to refer to the Creation and Completion of a Line Graph tool from their Procedural Toolbox in order to complete this task. Ask students to record their graph in Problem 7 of their Student Data Record.
a. Tell students, that because their data may differ among the students in their group, they should select which data set they will use for their graph.
b. After students have completed their graphs, ask one representative from each group to illustrate the graph on the board.
c. Analyze the graphs on the board with students.

5. Observe the graphs:
Ask students: Were they similar? The graphs for all students may not be exactly the same, but should be similar.
Ask students: What does the graph illustrate? As the person moved from sitting to standing to jogging the heart rate increased.
6. Ask students: Is this relationship true for the data you collected for your respiratory rate? Yes. As activity increased, so did the respiratory rate.
7. Ask students: How did your activity increase as you moved from sitting to standing to jogging? As students transitioned from sitting to standing to jogging, the number of muscles engaged in the activity increased. Sitting did not engage as many muscles as standing or jogging. When sitting, most of the muscles are relaxed with the exception of the muscles required for breathing or holding the back and chest erect. The muscles of the rib cage and diaphragm continued to contract and relax. However, when standing, the muscles in the feet, as well as legs, abdomen, and back, contracted in order to keep the body in a standing position. When jogging, the leg and arm muscles were constantly contracting and relaxing as the legs and arms moved. Muscles in the abdomen, back, and chest worked harder to maintain balance, and the muscles used for breathing worked harder while jogging as compared to sitting or standing.
8. Ask students: Why did your heart rate and respiratory rate increase as your activity increased? As the increased activity engaged more muscles, it increased each muscle’s need for oxygen to provide energy in order to perform the activity. As the body sensed an increased requirement for oxygen, the heart increased the rate it pumped blood, which contained oxygen, to the muscles. The body also increased breathing, or respiratory rate, to bring in more oxygen for the muscles.
______________________________________________
SLIDE VEXEX2-post-5
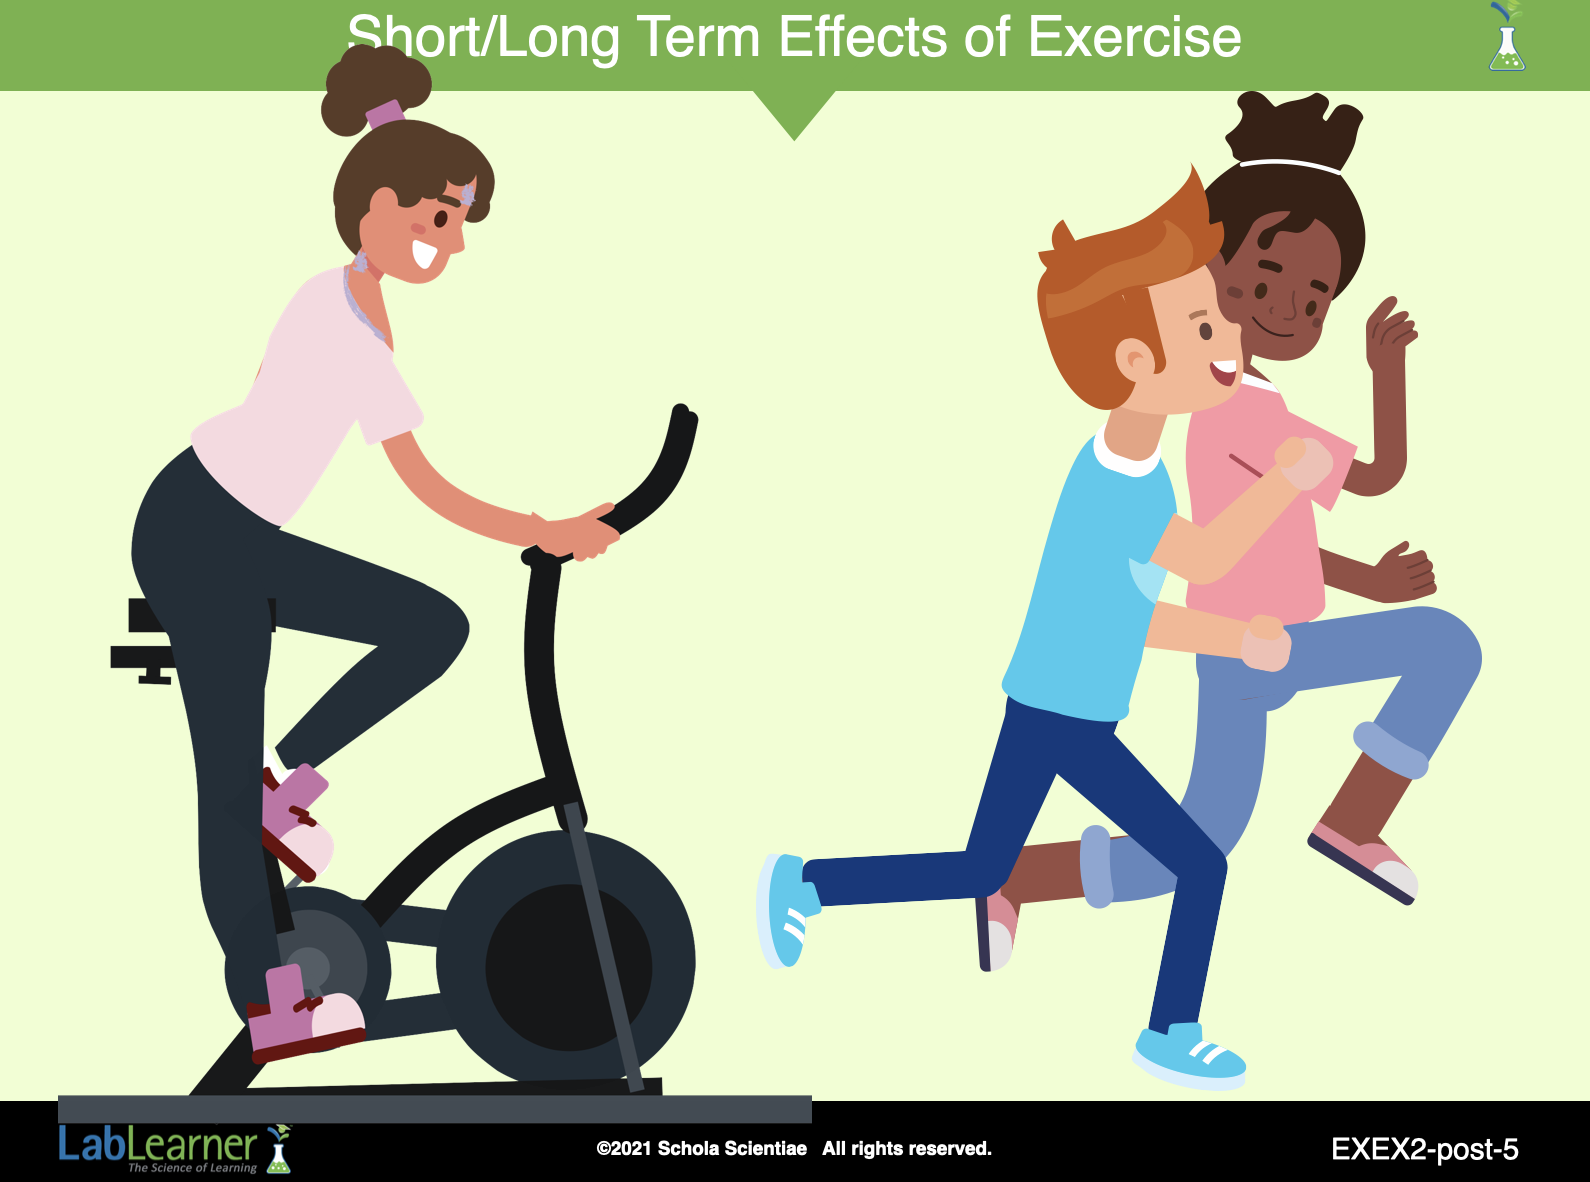
D. Before moving on to the analysis of the heart models, ask students to stop and reflect on what they have concluded about exercise and the cardiovascular system thus far.
Ask students: Would you consider your observations short-term or long-term effects of exercise? Students should indicate that exercise increases the activity of the cardiovascular system. This can be seen as an increase in heart rate, which is considered a short-term effect because it occurs simultaneously with exercise.
______________________________________________
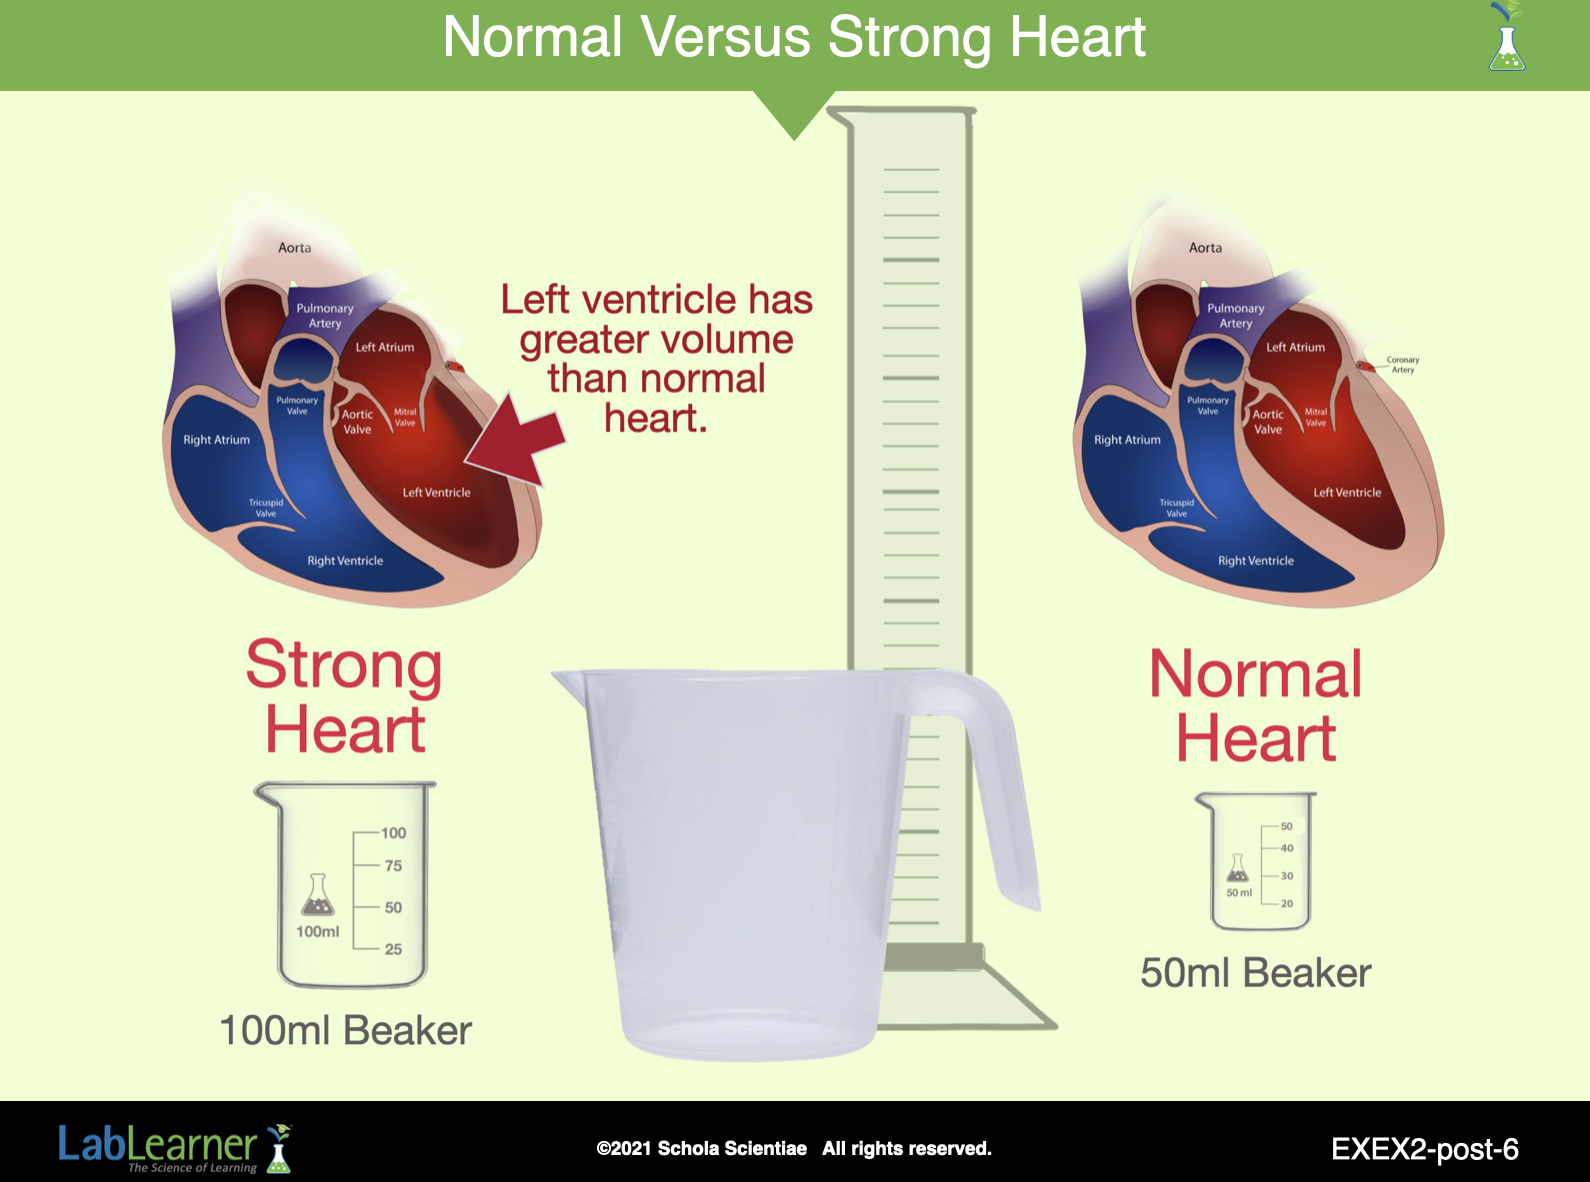
SLIDE VEXEX2-post-6
E. Review and analyze the experiments conducted with the “strong” and “normal” heart models. Tell students they may wish to refer to their Scientist’s Glossary during this analysis. The analysis should increase students’ comprehension of many of the terms. The following activity and questions may be included to initiate a discussion:
1. Ask students: In your experiment with the “strong” and “normal” hearts, what did the 50 ml beaker and the 100 ml beaker represent? The 50 ml beaker represented a “normal” heart, the heart of someone who does not exercise regularly. The 100 ml beaker represented a “strong” heart, the heart of someone who regularly performs cardiovascular exercise.
2. Our model represented how quickly each heart transferred blood during exercise. In our model, the heart rate or number of transfers per minute made from the liter pitcher to the graduated cylinder was the same for each heart.
Ask students: Under these conditions of equal heart rate, which heart transferred all of the blood in the shortest amount of time? The “strong” heart transferred blood quicker than the “normal” heart.
NOTE: Students may have difficulty conceptualizing their experiments in these terms. It is important that they be able to separate the concept of heart rate from the time it took to deliver all the blood to the muscle. Heart rate is the number of beats per minute. In the model, it was the number of transfers with either the 50 ml or 100 ml beaker in one minute.
Using the sample data for the “strong” heart:
Volume strong heart held = 100 ml
Total volume of blood = 1000 ml
Therefore, number of transfers made = 1000 ml ÷ 100 ml = 10 transfers Time to deliver blood = 0.6 min
Heart rate = 10 transfers ÷ 0.6 min = 16.6 transfers (beats) per minute
Sample data for “normal” heart:
Volume strong heart held = 50 ml
Total volume of blood = 1000 ml
Therefore, number of transfers made = 1000 ml ÷ 50 ml = 20 transfers Time to deliver blood = 1.25 min
Heart rate = 20 transfers ÷ 1.25 min = 16 transfers (beats) per minute
The design of the experiment resulted in approximately the same heart rate for the “normal” and “strong” hearts. Students then determined how long it would take each heart to deliver the same total volume of blood. Thus, their experiment asked the question, for the same heart rate, which heart can get blood to the muscles more quickly. Students should have concluded that the strong heart transferred the blood more quickly.
______________________________________________
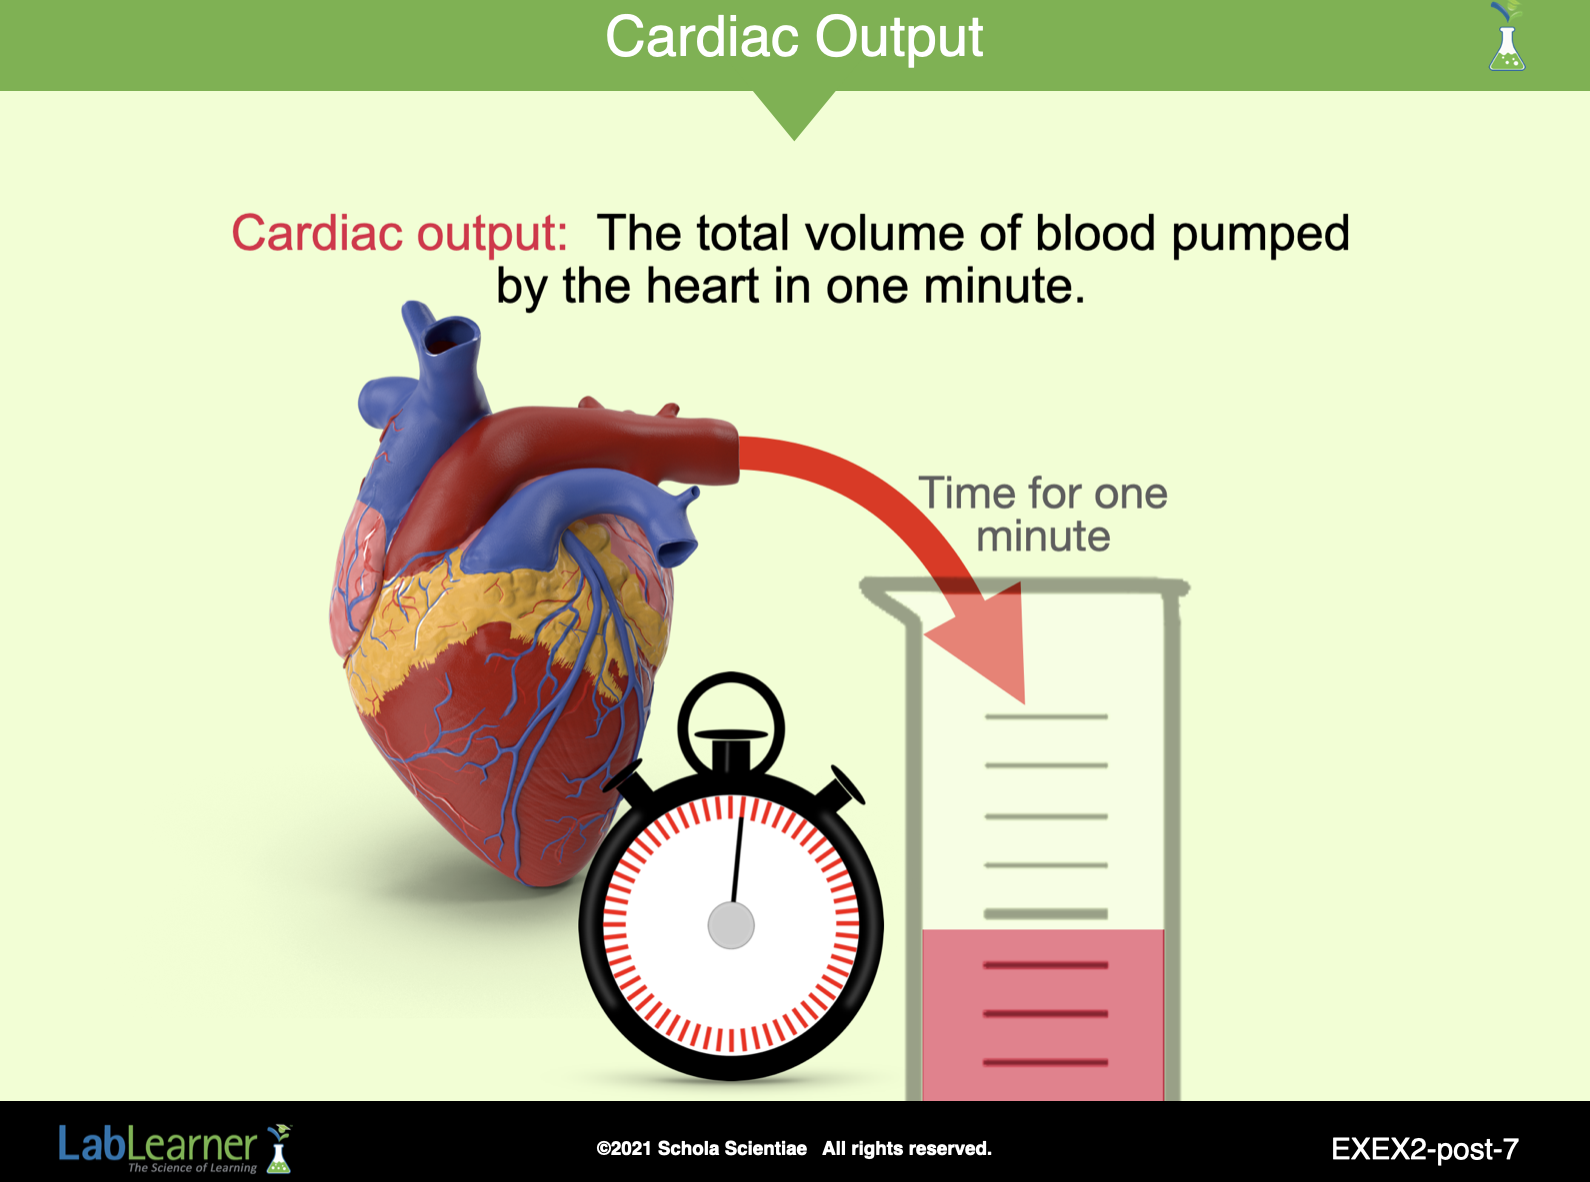
SLIDE VEXEX2-post-7
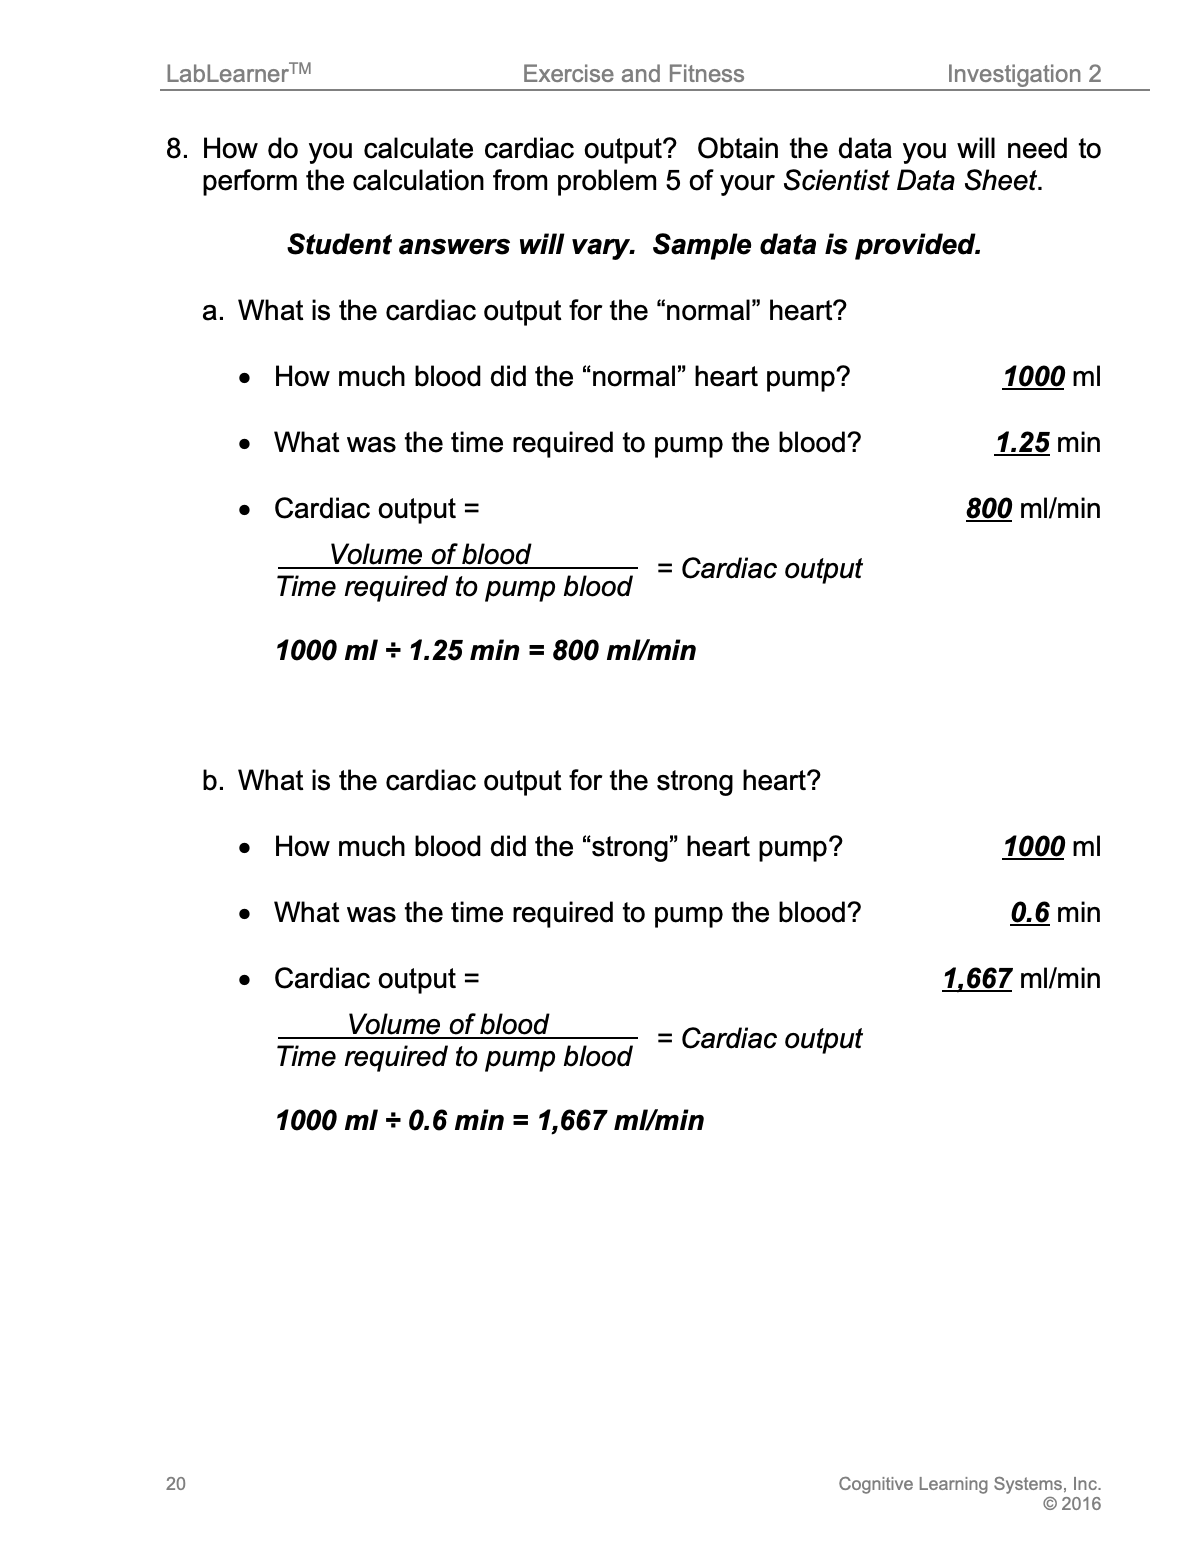
3. Ask students: Do you think there is a scientific term that describes how quickly the heart can pump a certain volume of blood? Yes. Cardiac output is the term that describes how quickly the heart can pump a certain volume of blood. Cardiac output describes the volume of blood the heart can pump per minute.
a. Ask students to locate Problem 8 of their Student Data Record. Tell them they will determine the cardiac outputs during exercise for the “strong” and “normal” hearts they used in the Lab.
b. Direct students to transfer the data for the volume of blood pumped and the time required to pump it and record it in the appropriate locations in Problems 8a and 8b.
c. Ask students: How can you calculate cardiac output? Student answers will vary. Cardiac output is the volume of blood pumped in one minute.

d. Direct students to calculate the cardiac output for the “strong” and “normal” heart from their model. Remind students that the model represents the two hearts during maximum exercise when both hearts have the same heart rate.
Normal heart = 1000 ml ÷ 1.25 min = 800 ml/min
Strong heart = 1000 ml ÷ 0.6 min = 1,667 ml/min
e. Ask students to compare the results of the two calculations. What conclusions can you determine from this data? During exercise, the “strong” heart pumped the same amount of blood as the “normal” heart at slightly more than twice the rate. The strong heart could provide the body with more oxygen than the normal heart. In other words, during a period of exercise, it took the “normal” heart longer to pump the same volume of blood as the “strong” heart.
f. Ask students: Why do you think the “strong” heart could pump more blood in the same amount of time as the “normal” heart? The stronger heart was larger than the normal heart. It could hold more blood than the normal heart, and therefore, could pump more blood with each beat than the normal heart.
g. Does the “strong” heart benefit the person’s cardiovascular system even when the person is not exercising? How? Even when a person with a strong heart is not exercising, but is at rest during the day, each beat of the heart delivers more blood to the body than a normal heart. Therefore, it has to beat less often or work less, to provide the body with the same amount of oxygen. As a result, the person with a strong heart will have a lower resting heart rate and the heart will work less over a lifetime.
______________________________________________
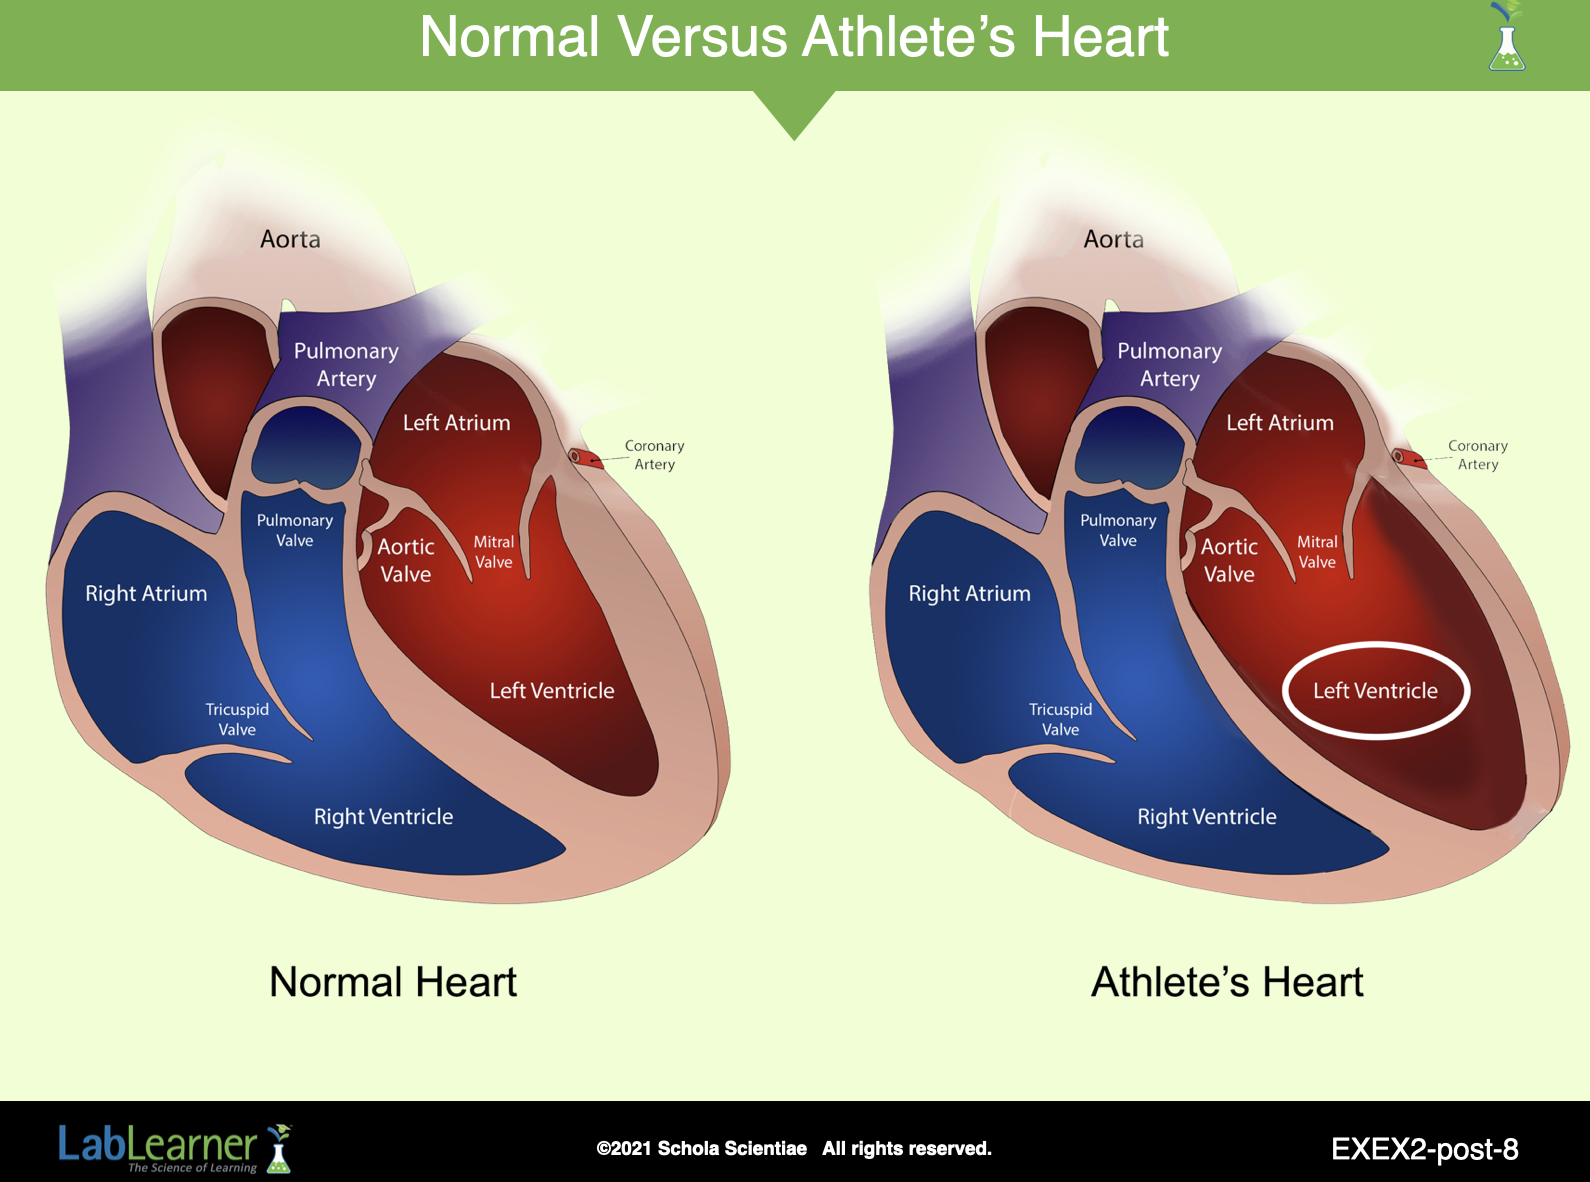
SLIDE VEXEX2-post-8
4. Ask students the question that follows and have them record their answer in Problem 9 of their Student Data Record.
a. Ask students: Based on your results, what can you conclude about the effects of regular cardiovascular exercise or training on the heart? With regular exercise, the strength and size of the heart increases, increasing the amount of blood it can move to the muscles with each beat or pump. Therefore, during exercise, the time it takes to deliver a certain amount of blood to the muscle decreases. As a result, muscles receive more blood, and more oxygen, in less time. During times of rest, a strong heart has to work less to provide the muscles with the same amount of oxygen, because it can deliver the same amount of blood with fewer beats. As a result, a person who trains has a lower resting heart rate than someone who does not exercise regularly.
b. Discuss what students wrote as answers, ensuring that they understand the concepts involved.
5. Ask students: Would you consider this a short-term or long-term benefit of exercise? Why? It is a long-term benefit because it does not occur immediately but after several weeks or months of exercise.
______________________________________________
SLIDE VEXEX2-post-9
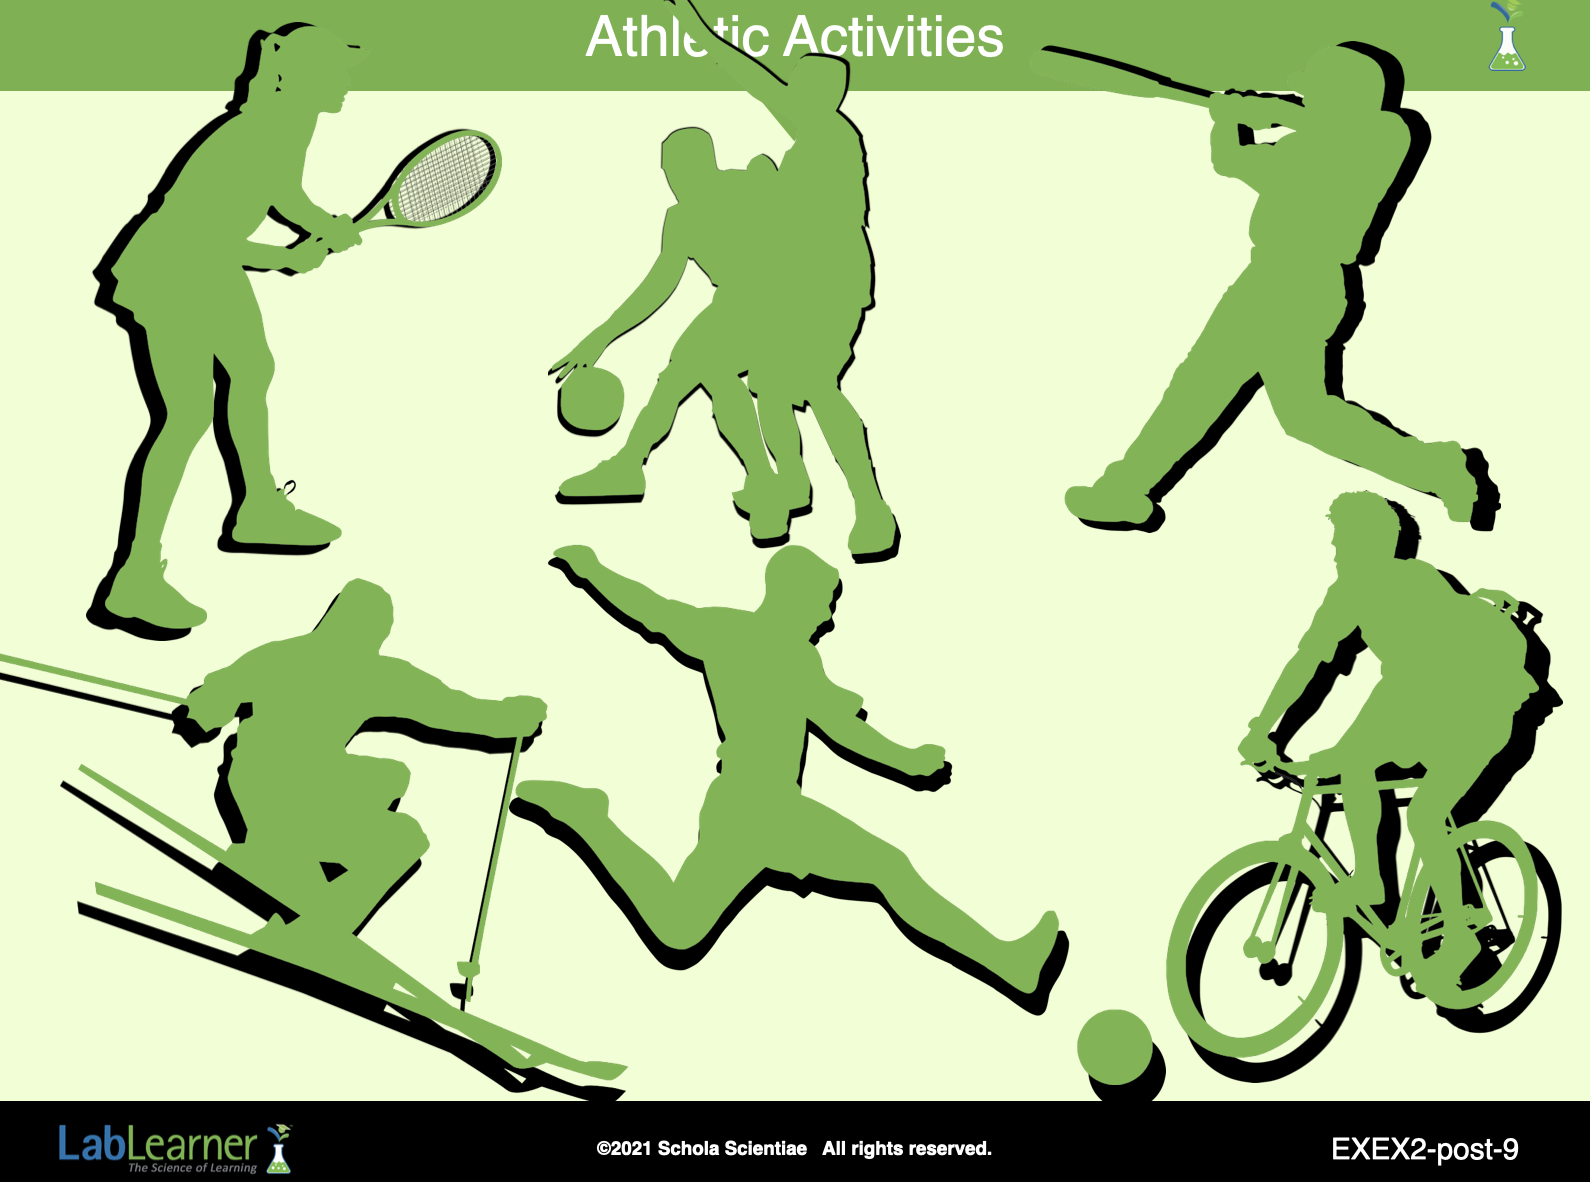
F. Encourage students to apply what they have learned to their own life by asking the questions that follow. Students may wish to refer to their Scientist’s Glossary during the discussion.
1. Ask students: Do you think cardiovascular training would make a difference in your fitness level? Yes. A regular exercise program that includes cardiovascular training would increase cardiovascular fitness.
2. Ask students: What type of exercises would increase your cardiovascular fitness? Student answers may vary. Exercises to increase cardiovascular fitness would include: jogging, jumping jacks, jumping rope, rollerblading, swimming, hiking, walking, rock climbing, stair climbing, aerobics, dancing, cross country skiing, rowing, hopscotch, etc.
3. Ask students: What do you think would increase your cardiovascular endurance? Cardiovascular training would help to increase cardiovascular endurance or the amount of time a person can perform exercises without feeling fatigued or winded. Training would help because it would lead to the ability of the heart to hold more blood, pump more blood with each beat, and transfer oxygen and nutrients to muscles more quickly. All of this would increase the time a person could perform an activity without feeling out of breath or fatigued. For example, to increase your cardiovascular endurance, you could perform any exercise that would increase your cardiovascular fitness, but slowly increase the amount of time you perform that exercise.
4. Encourage students to reflect on the activities in their Physical Fitness Log.
Ask students: Can you see a connection between those activities, training, and cardiovascular endurance? Students should begin to realize that the activities in the Physical Fitness Log are a training program designed to increase cardiovascular and muscular endurance. The students perform the same activities regularly but increase the duration over time.
______________________________________________

SLIDE VEXEX2-post-10
G. To complete this Investigation, tell students they will explore the importance of muscular and flexibility fitness in the next lesson. Questions they will explore include:
How does increased flexibility improve your physical fitness?
What leads to muscle fatigue?
KEYS: POSTLAB