Teacher Portal:
Earth’s Forces
Investigation 3 – PostLab
 PRINT IT
Use your browser to download a printable PDF as help during the slide presentation and to make additional notes. In your browser, go to File > Print and then choose to save as PDF.
NAVIGATE IT
Once the slide presentation is launched
- use your left and right arrows to advance or go back in the slide presentation, and
- hover your mouse over the left edge of the presentation to get a view of the thumbnails for all the slides so that you can quickly move anywhere in the presentation.
- Click HERE to launch the slide presentation for the CELL.
SHARE IT

SLIDE VEFORCE3-post-1
In Investigation Three, students have learned the important force of friction. In the next Investigation, they will learn how to actually measure the force of friction. Therefore, in this PostLab it is important that they understand the basic principles and concepts about friction:
- Friction acts in a direction opposite the direction of movement of an object.
- The property of surfaces affects the force of friction.
- Friction causes moving objects to slow down or stop.
______________________________________________

SLIDE VEFORCE3-post-2
Explain to students that before they can analyze the data collected in the Lab, they should first refresh their memory of what was done. One good way to do this is to use the Cognitive Tool, Summarize.
Ask a volunteer to describe what a summary is. A summary is a statement that contains the most important information while leaving out the details that are not important to understand what happened.
Tell students to look back at the trials they conducted in the Lab.
Ask students: What did we do in the first Trial? In the first trial, the acrylic cylinder was rolled down a ramp onto the lab bench surface.
Ask students: Can you summarize the second Trial? In the second trial, the acrylic cylinder was rolled down a ramp onto masking tape.
Ask students: Can you summarize the third Trial? In the third trial, the acrylic cylinder was rolled down a ramp onto sandpaper.
Ask students: What did all three trials help us to investigate? Why did we do this experiment? The three trials were designed to help students investigate the effect of varying surface type on the force of friction.
______________________________________________
SLIDE VEFORCE3-post-3
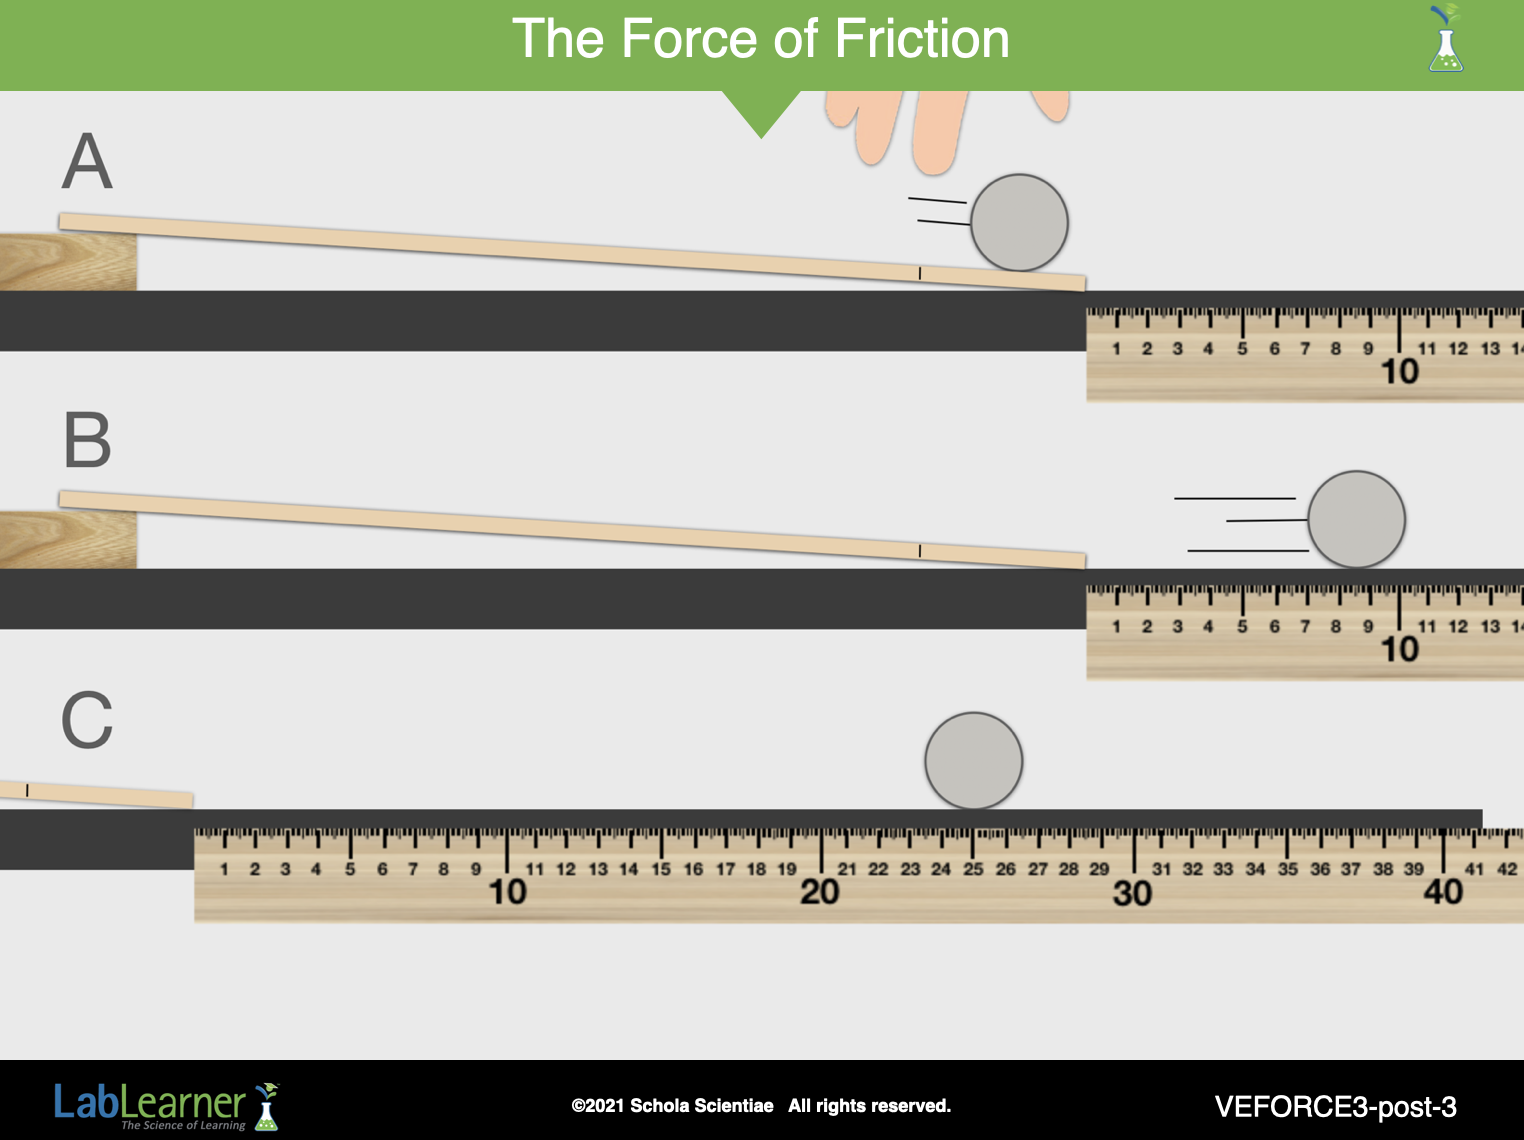
This slide shows the three important points during each downhill Trial:
A. The acrylic cylinder is released and begins rolling downhill.
B. The acrylic cylinder rolls along the flat surface of the lab bench.
C. The acrylic cylinder stops rolling.
The following few slides will look at the forces in action as the acrylic cylinder moves down the rule and onto the bench.
______________________________________________
SLIDE VEFORCE3-post-4
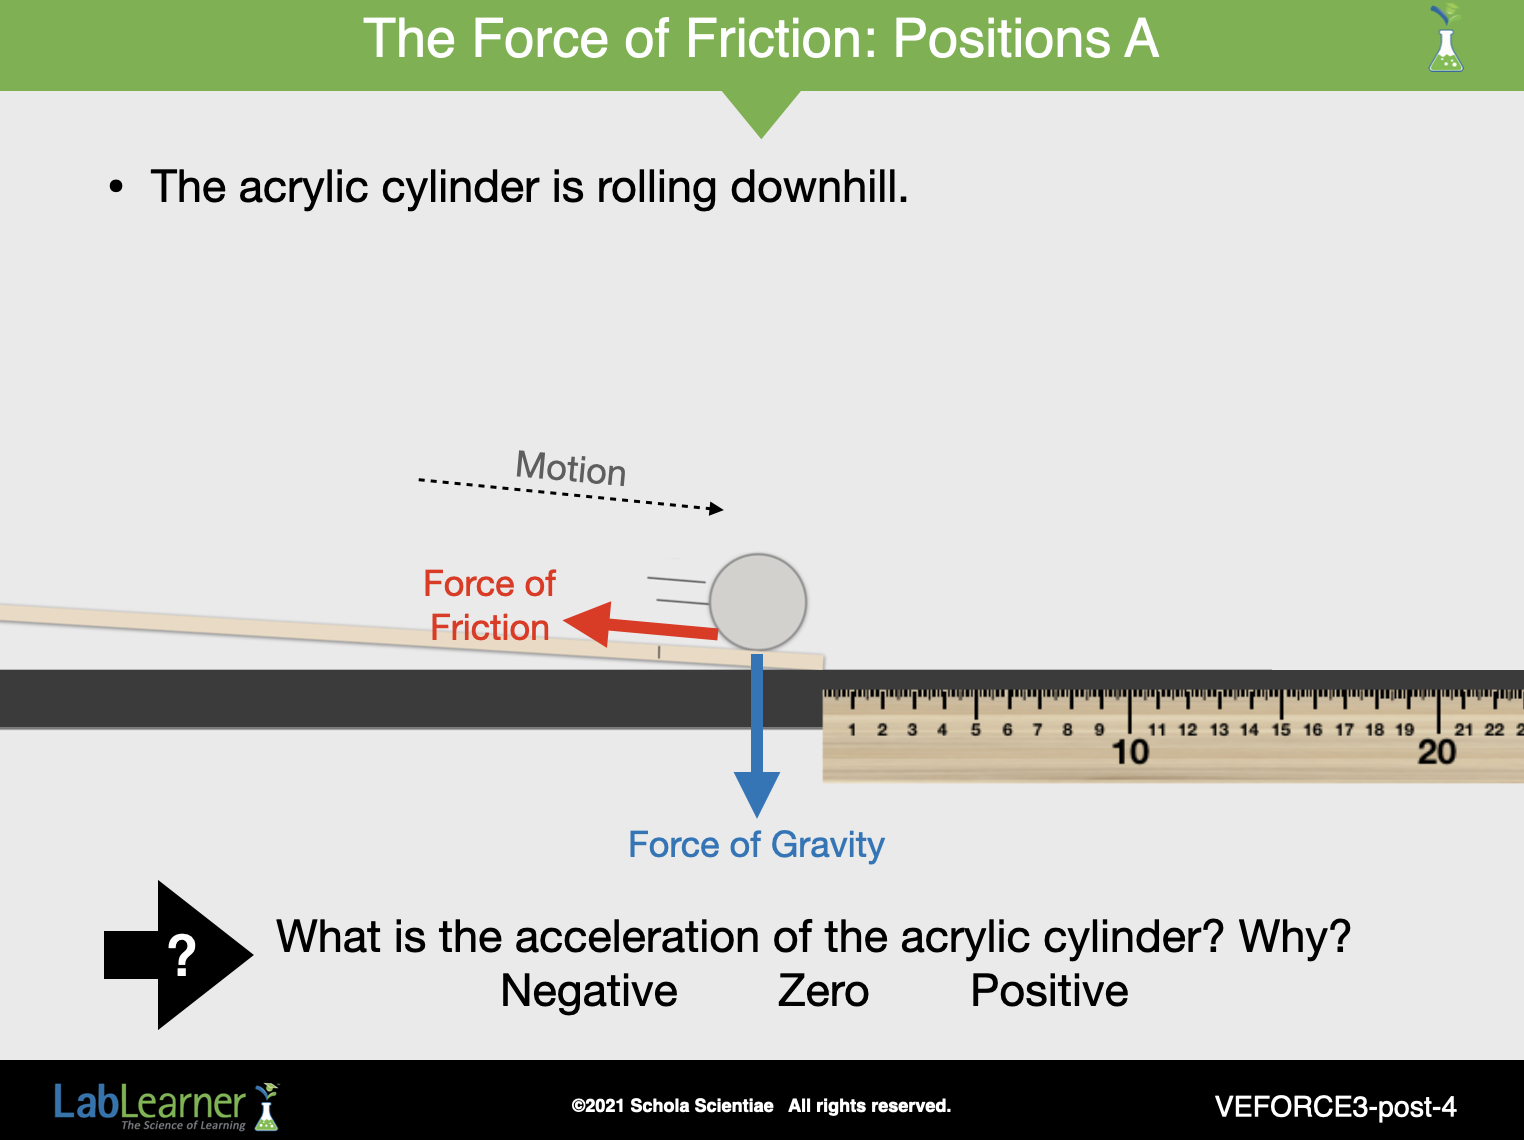
Continue the analysis by ensuring that students understand the evidence of forces that were present during the experiments. Begin by focusing on position A, when the acrylic cylinder started rolling down the ruler:
Ask students: What forces do you think were acting on the acrylic cylinder when it was traveling down the inclined ruler? Students should recognize that the forces of gravity and friction were present on the cylinder, once students had let go of it.
Ask students: How do you know that forces were acting on the acrylic cylinder? Evidence of forces was apparent in the motion of the acrylic cylinder.
Ask students: Were the forces balanced or unbalanced? How do you know? Students should recognize that the forces were unbalanced because the cylinder accelerated.

Acceleration of the acrylic cylinder in this slide was positive as it sped up after release.
______________________________________________
SLIDE VEFORCE3-post-5
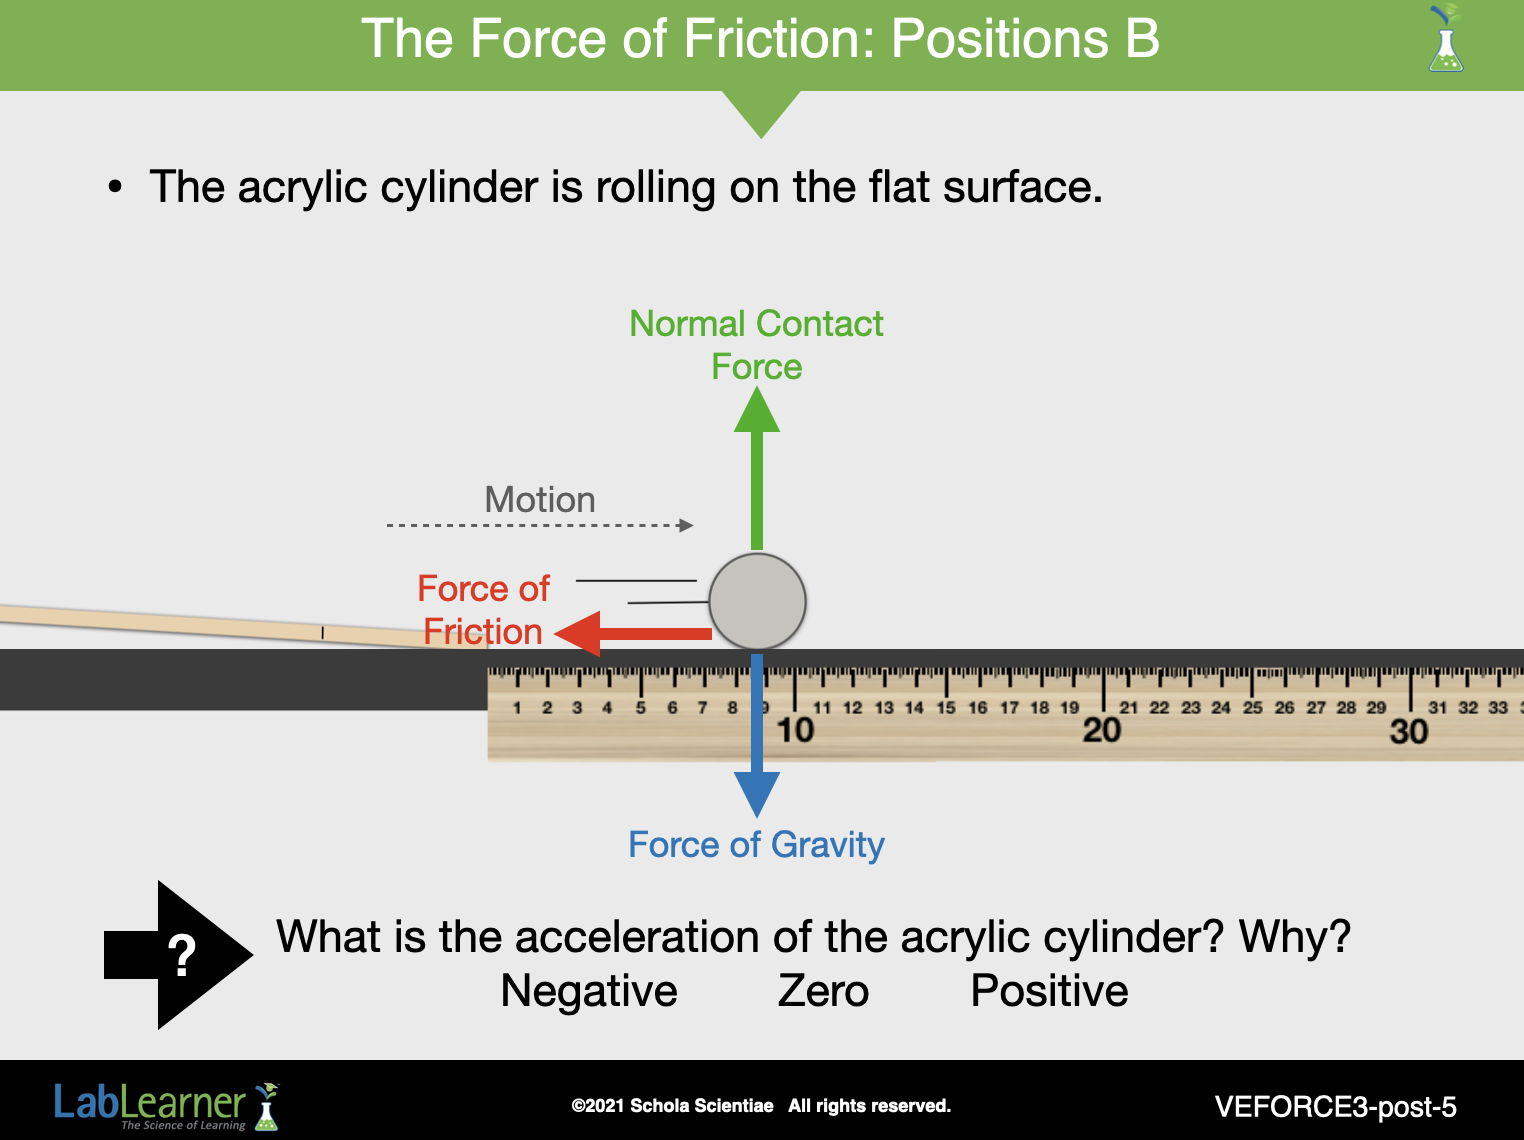
In this slide we focus on position B, when the acrylic cylinder rolled on the flat surface:
Notice: how the friction vector slightly changes direction from the previous slide, as the direction of motion changes direction when it leaves the inclined ruler and reaches the flat lab bench. Remember that the force of friction always acts in the opposite direction of the motion of a moving object and is parallel to the two surfaces.
Ask students: What forces do you think were acting on the acrylic cylinder when it was traveling down the inclined ruler? Students should recognize that the forces of gravity, normal contact force, and friction were present on the cylinder, as it rolled across the flat surface.
Ask students: How do you know that forces were acting on the acrylic cylinder? Evidence of forces was apparent in the motion of the acrylic cylinder.
Ask students: Were the forces balanced or unbalanced? How do you know? Students should recognize that the forces were unbalanced because the cylinder was accelerating.

Acceleration of the acrylic cylinder in this slide was negative as it began to slow down once on the flat surface. This slowdown eventually resulted in a complete stop in the movement of the cylinder.
______________________________________________
SLIDE VEFORCE3-post-6
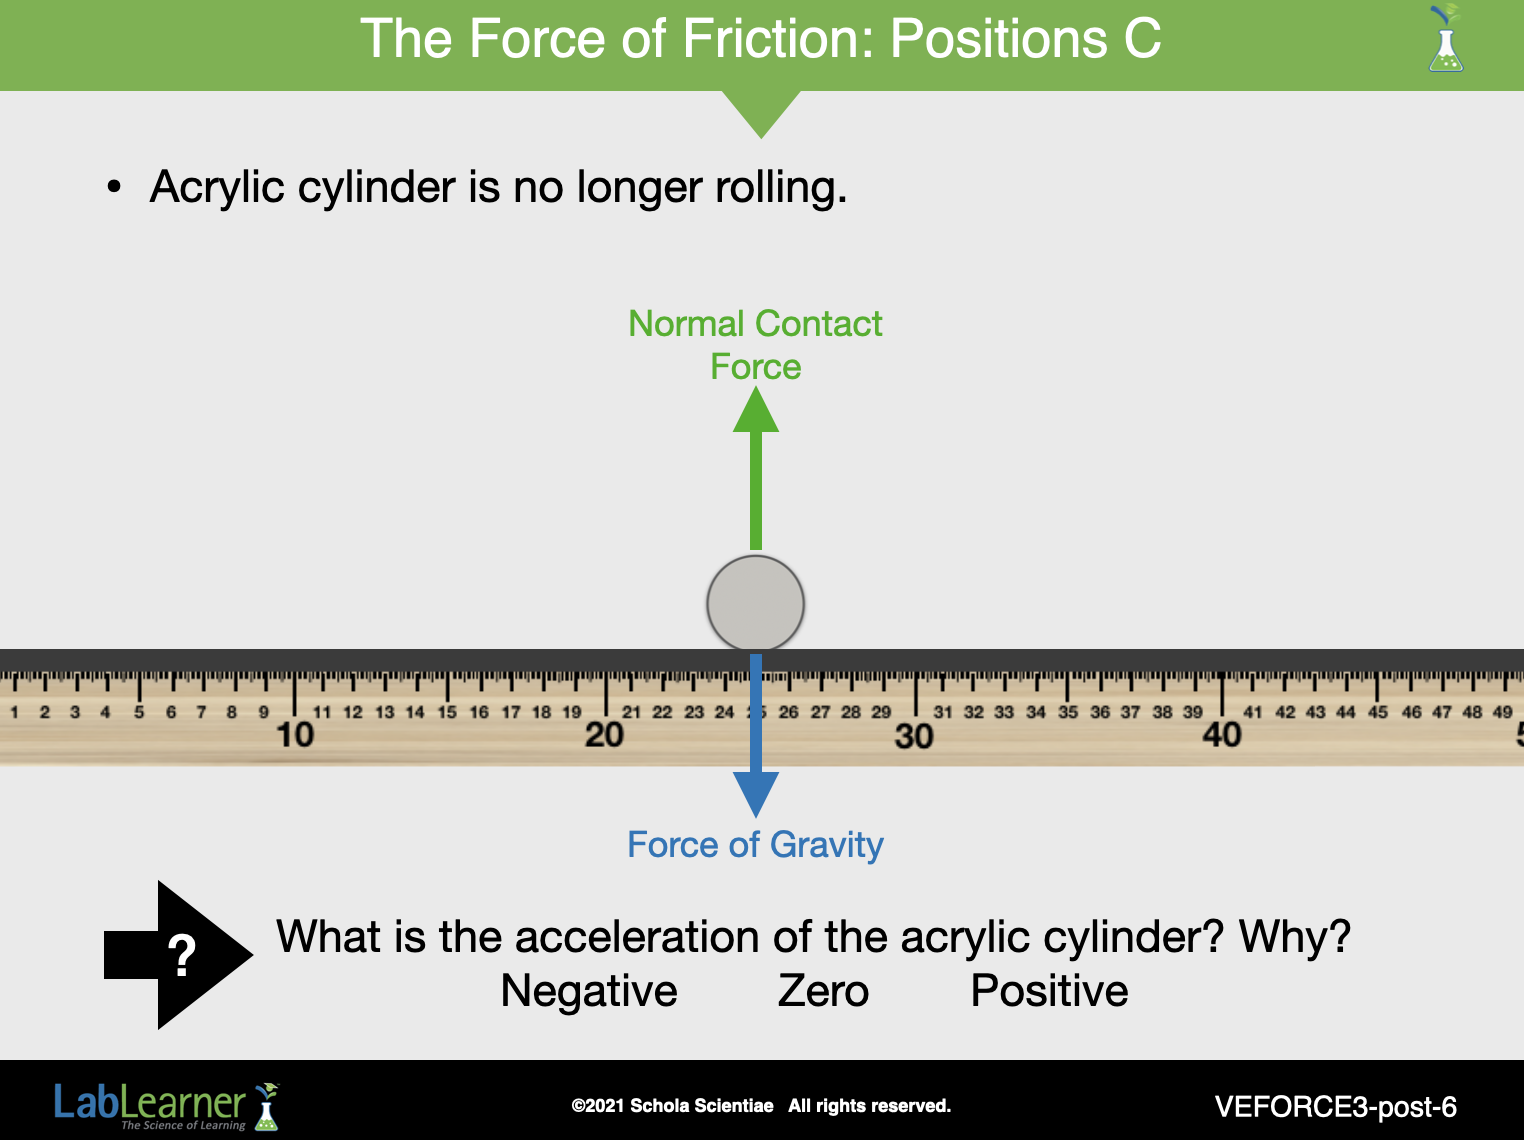
In this slide we focus on position C when the acrylic cylinder stopped rolling:
Ask students: What forces do you think were acting on the acrylic cylinder when it came to rest on the flat surface? Students should recognize that the forces of gravity and normal contact force were present on the cylinder.
Ask students: Were the forces balanced or unbalanced? How do you know? Students should recognize that the forces were balanced because the cylinder no longer was accelerating.

The acceleration of the acrylic cylinder in this slide is zero because there was no acceleration. The cylinder was stationary at this point.
______________________________________________

SLIDE VEFORCE3-post-7
Begin to analyze each trial by turning students’ attention to the Table in Problem 4 of their Student Data Records. As a first step, use each of the three “runs” in each trial, to calculate the average distance traveled. The following steps are intended as a guide for students’ calculations:
1. Divide the class into five cooperative groups. If possible, students should sit with the same students with whom they conducted the experiments in the Lab.
2. Direct students’ attention to Problem 4 in their Student Data Record, and in particular to the first trial, in which the acrylic cylinder ran onto the table top.
a. Explain that students need to calculate the average distance traveled. Remind students that the average is also called the mean for a set of data. Ask students: How can we calculate the average distance traveled? Students should recognize that the average may be calculated by summing the distances and dividing by three.
b. Ask: What was the average distance traveled by the cylinder on the table top? Depending on their data, groups’ answers will vary.
3. Allow students time to calculate the average distance traveled for the remaining two trials.Then review answers as a class.
a. Ask students: On which surface did the cylinder travel the furthest distance? Students should indicate that the cylinder traveled the furthest on the table top.
b. Ask students: On which surface did the cylinder travel the least distance? Students should indicate that the cylinder traveled the least distance on the sandpaper.
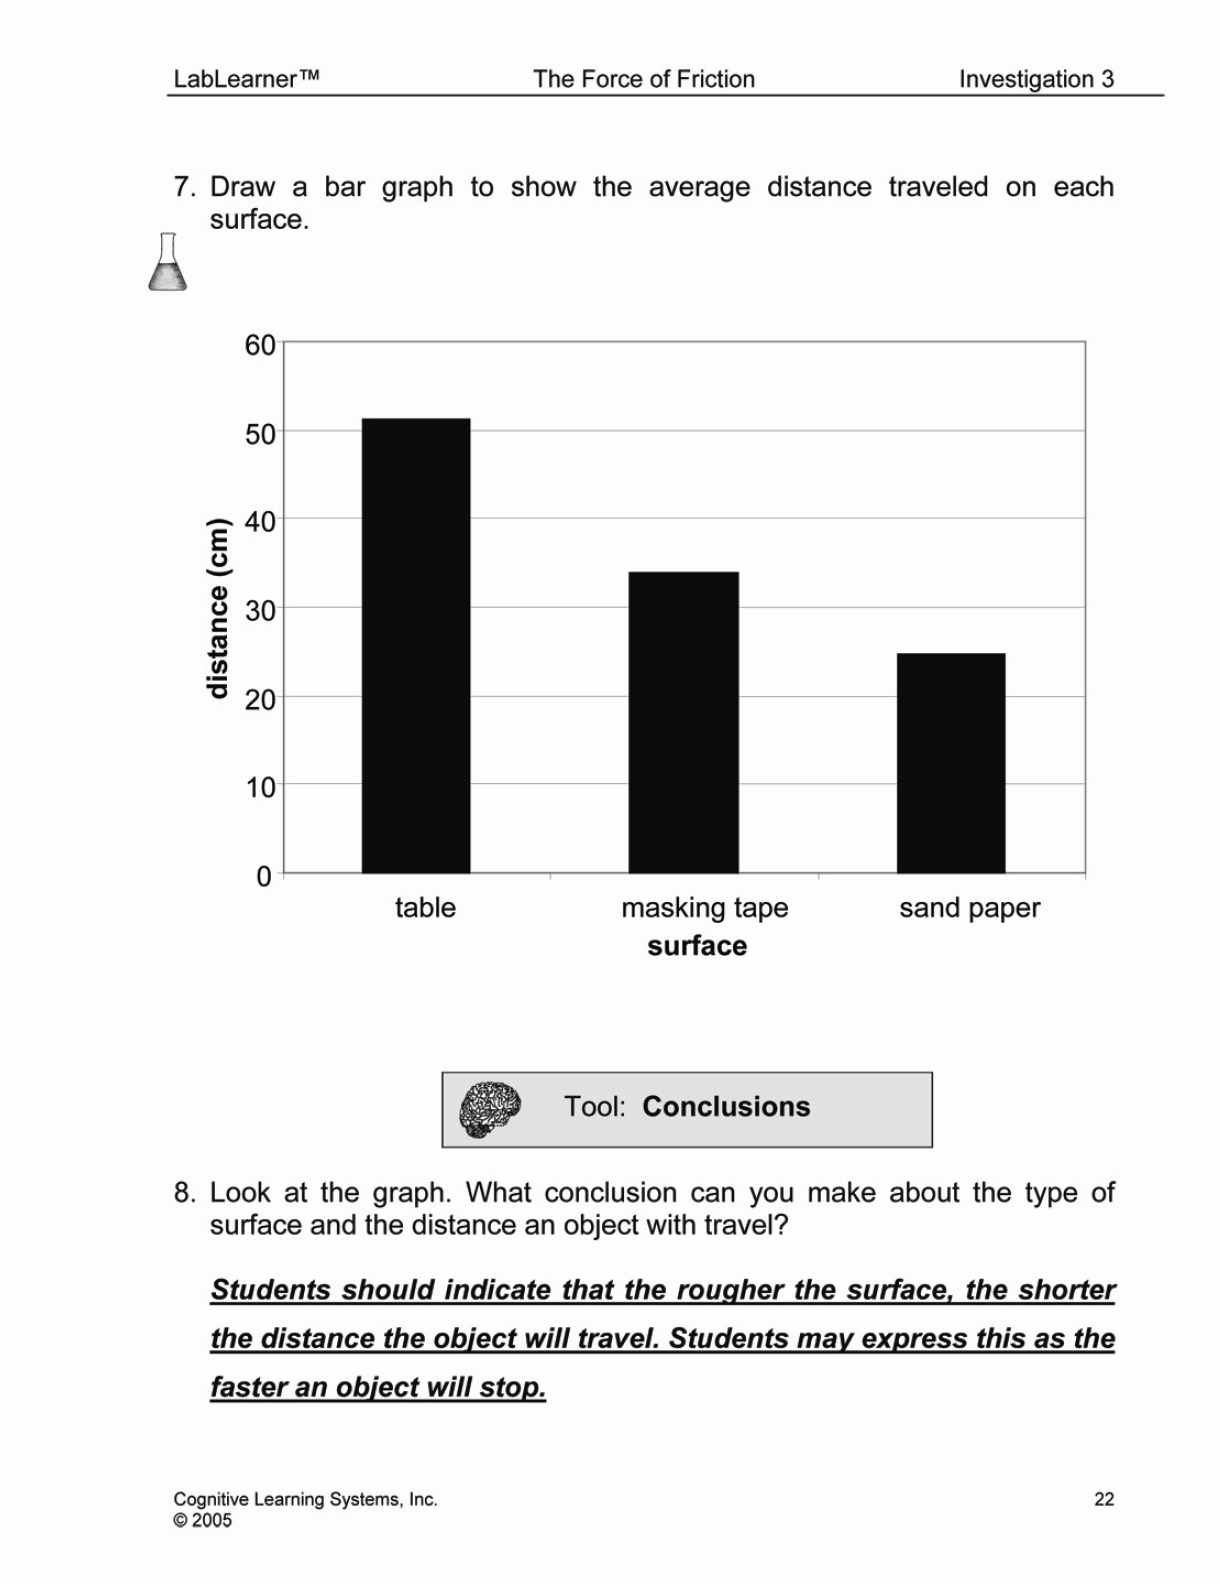
4. Ask students if they can think of a way to present their data, to show the different distances that the cylinder traveled in each trial. Student answers may vary. Guide students towards the creation of a bar graph.
5. Guide students to construct a bar graph in Problem 7 of their Student Data Records. If necessary, remind students of the steps in the Procedural Tool, Creation and Completion of a Bar Graph.
6. Students should record their conclusions in Problem 8 of their Student Data Record.
______________________________________________
SLIDE VEFORCE3-post-8
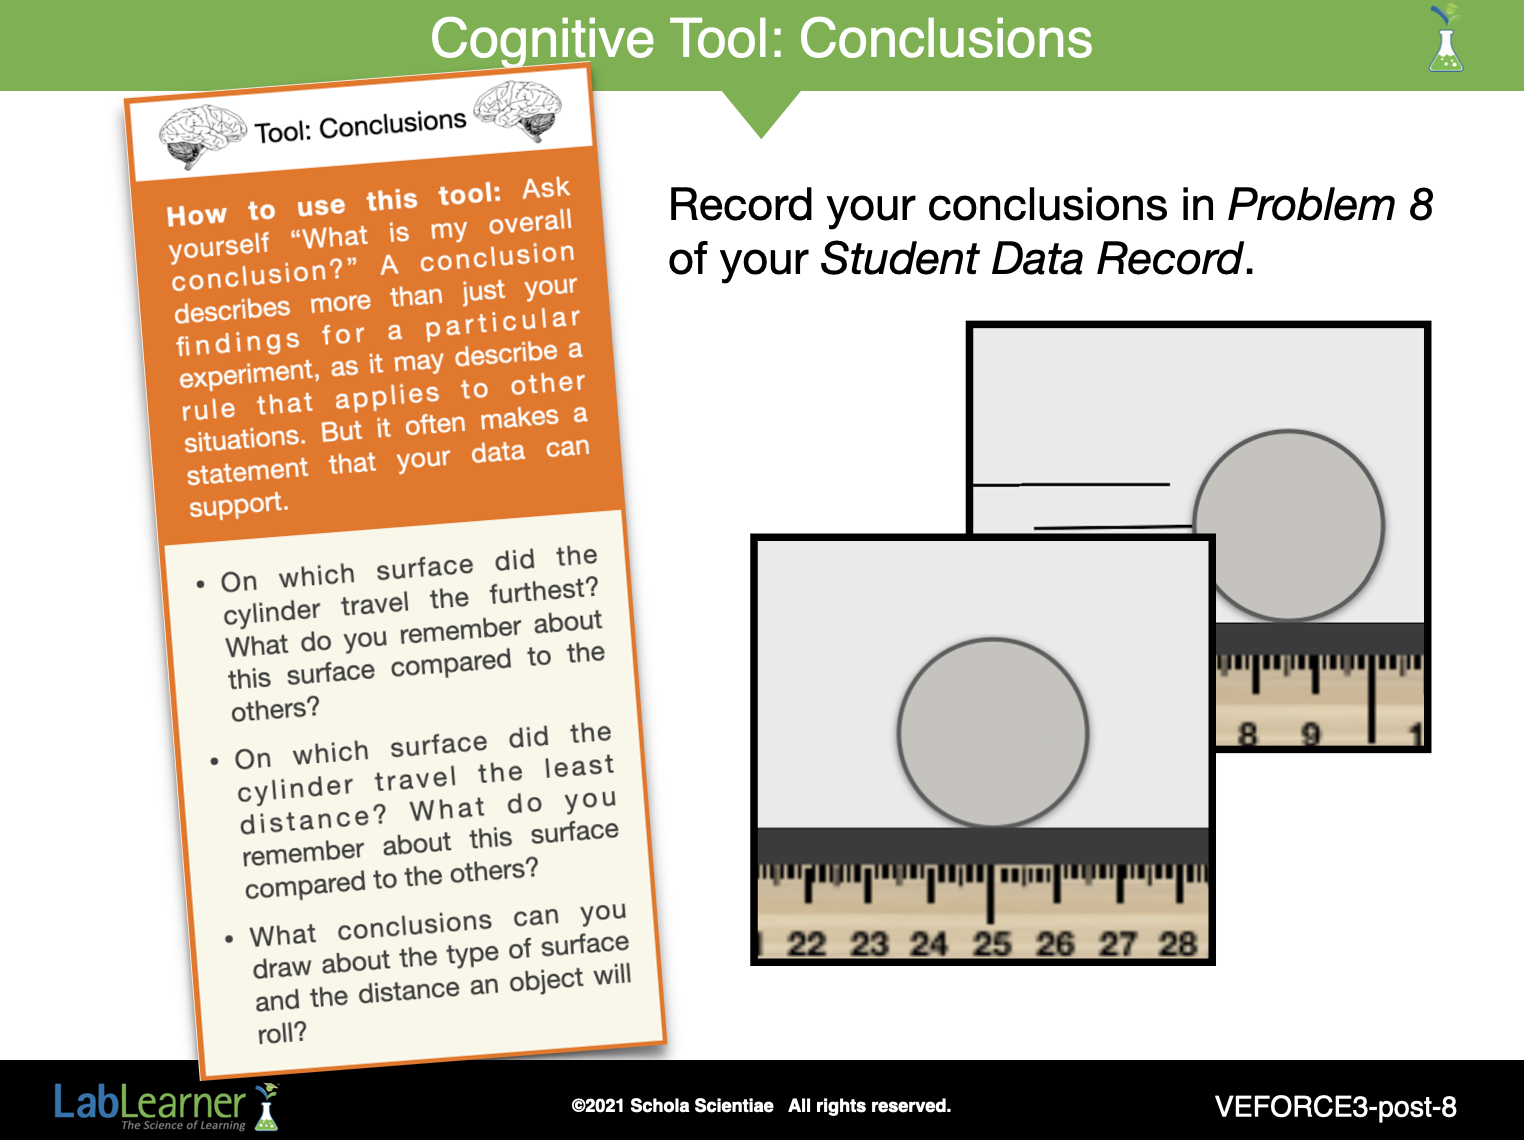
Direct students to review their bar graphs. Remind students that graphs can be useful in helping them draw Conclusions about data.
Ask students: On which surface did the cylinder travel the furthest? What do you remember about this surface compared to the others? The cylinder traveled the furthest on the lab table. It was smoother than the other surfaces.
Ask students: On which surface did the cylinder travel the least distance? What do you remember about this surface compared to the others? The cylinder traveled the least distance on the sandpaper. It was rougher than the others.
Ask students: What conclusion can you draw about the type of surface and the distance an object will roll? The smoother the surface, the farther the object will roll.
______________________________________________
SLIDE VEFORCE3-post-9
Explore the reasons for the results students obtained, using terms pertaining to frictional forces.
NOTE: The “SCREECH!” and tire tracks on this slide point to the involvement of friction between rubber tires and a concrete road.
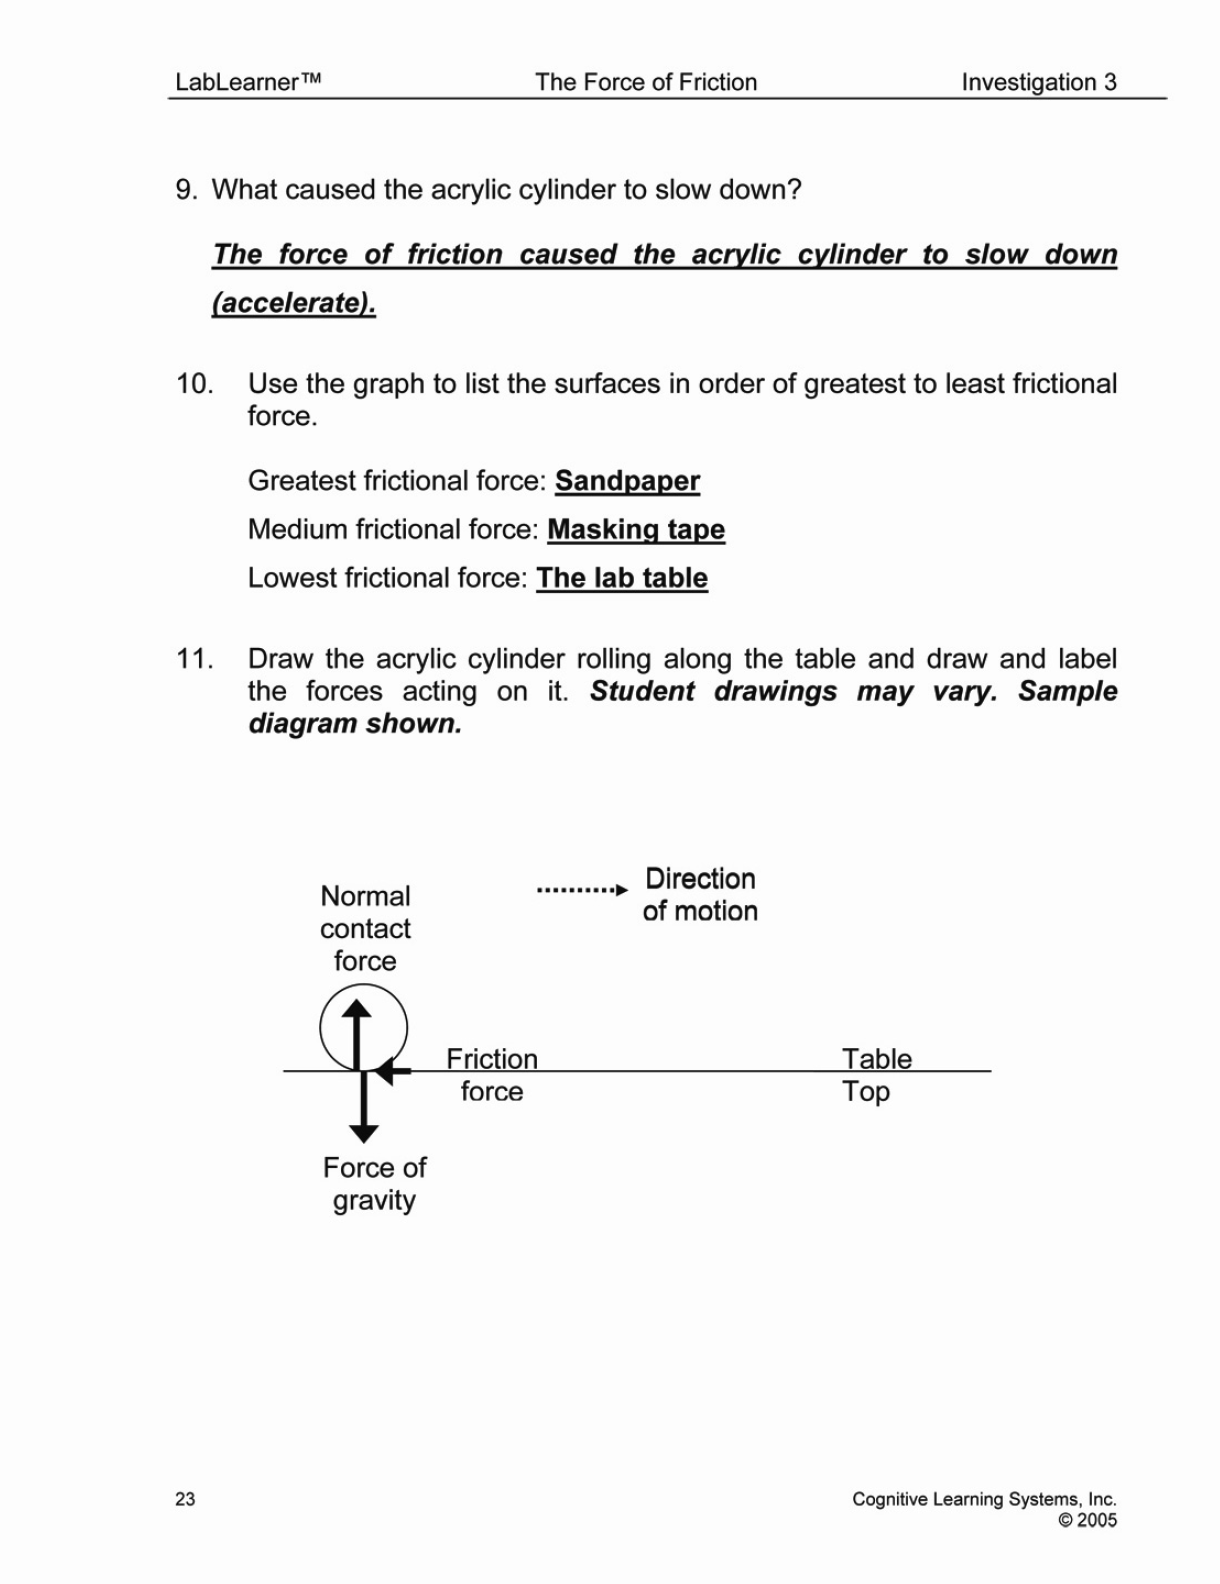
Ask students: In each trial, what caused the acrylic cylinder to slow down? The force of friction caused the acrylic cylinder to slow down (accelerate).
-
- Students should record their answers in Problem 9 in their Student Data Record.
- Explain that as the acrylic cylinder was let go at the same point on the ruler, the cylinder had the same speed as it started moving along the three different surfaces.
- Remind students that forces are necessary in order to slow down an object, but that slowing down is still a type of acceleration.
Ask students: Which surface slowed the acrylic cylinder down the fastest? How do you know? The sandpaper slowed the acrylic cylinder down the fastest, as was evident by the least distance traveled.
Explain that slowing down in a shorter distance requires a greater rate of acceleration. It also requires a greater force.
Ask students: If the sandpaper slowed the acrylic cylinder down in a shorter distance, do you think that the contact between them resulted in a greater force, lesser force, or an equal force, than the masking tape or the lab table? Students should realize that contact between the cylinder and sandpaper resulted in a greater force than that which resulted from the cylinder and masking tape, or cylinder and lab table.
Tell students that another way to think about this is to say that the sandpaper caused the greatest amount of acceleration. Since acceleration requires a force, the sandpaper caused the greatest force of friction.
Direct students to use their bar graph to list the surfaces in order of greatest to least frictional force. Students may record their answers in Problem 10 of their Student Data Record.
Finally, revisit students’ predictions from Problem 3. Ask the class to compare their predictions to the data in the graph and their answer to Problem 10. Discuss whether their predictions matched the data or not.
______________________________________________
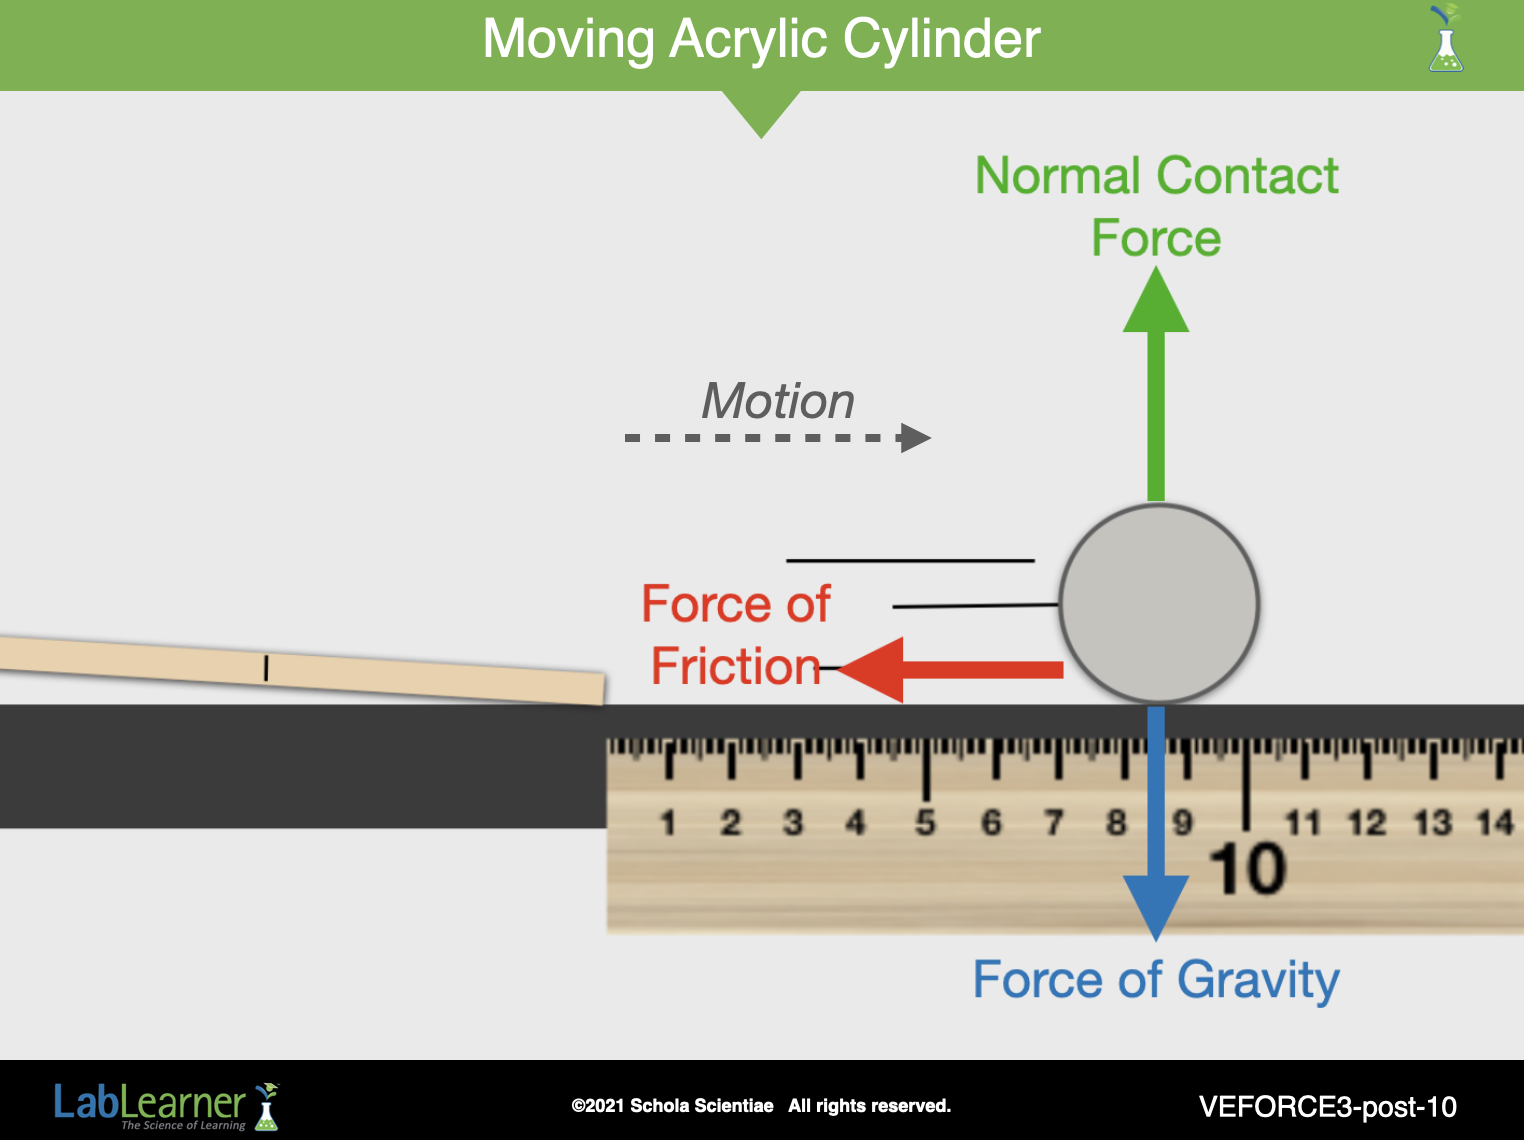
SLIDE VEFORCE3-post-10
Use this diagram to be certain students understand the nature, direction, and magnitude of the forces of friction and gravity that were present when the cylinder was rolling across the flat surface.
Ask: What forces are drawn on the diagram? Students should recognize the force of gravity, the normal contact force, and the force of friction.
Ask: In what direction is gravity acting? According to the diagram, gravity is a force acting downwards.
Ask: In what direction is the normal contact force acting? According to the diagram, the normal contact force is acting upwards.
Ask: In what direction is the frictional force acting? Students should recognize that the frictional force acts in a direction that directly opposes the direction of motion.
Ask: Why does the cylinder slow down? The cylinder slows down because the forces are unbalanced, and because the force of friction is acting in the opposite direction of motion.
______________________________________________
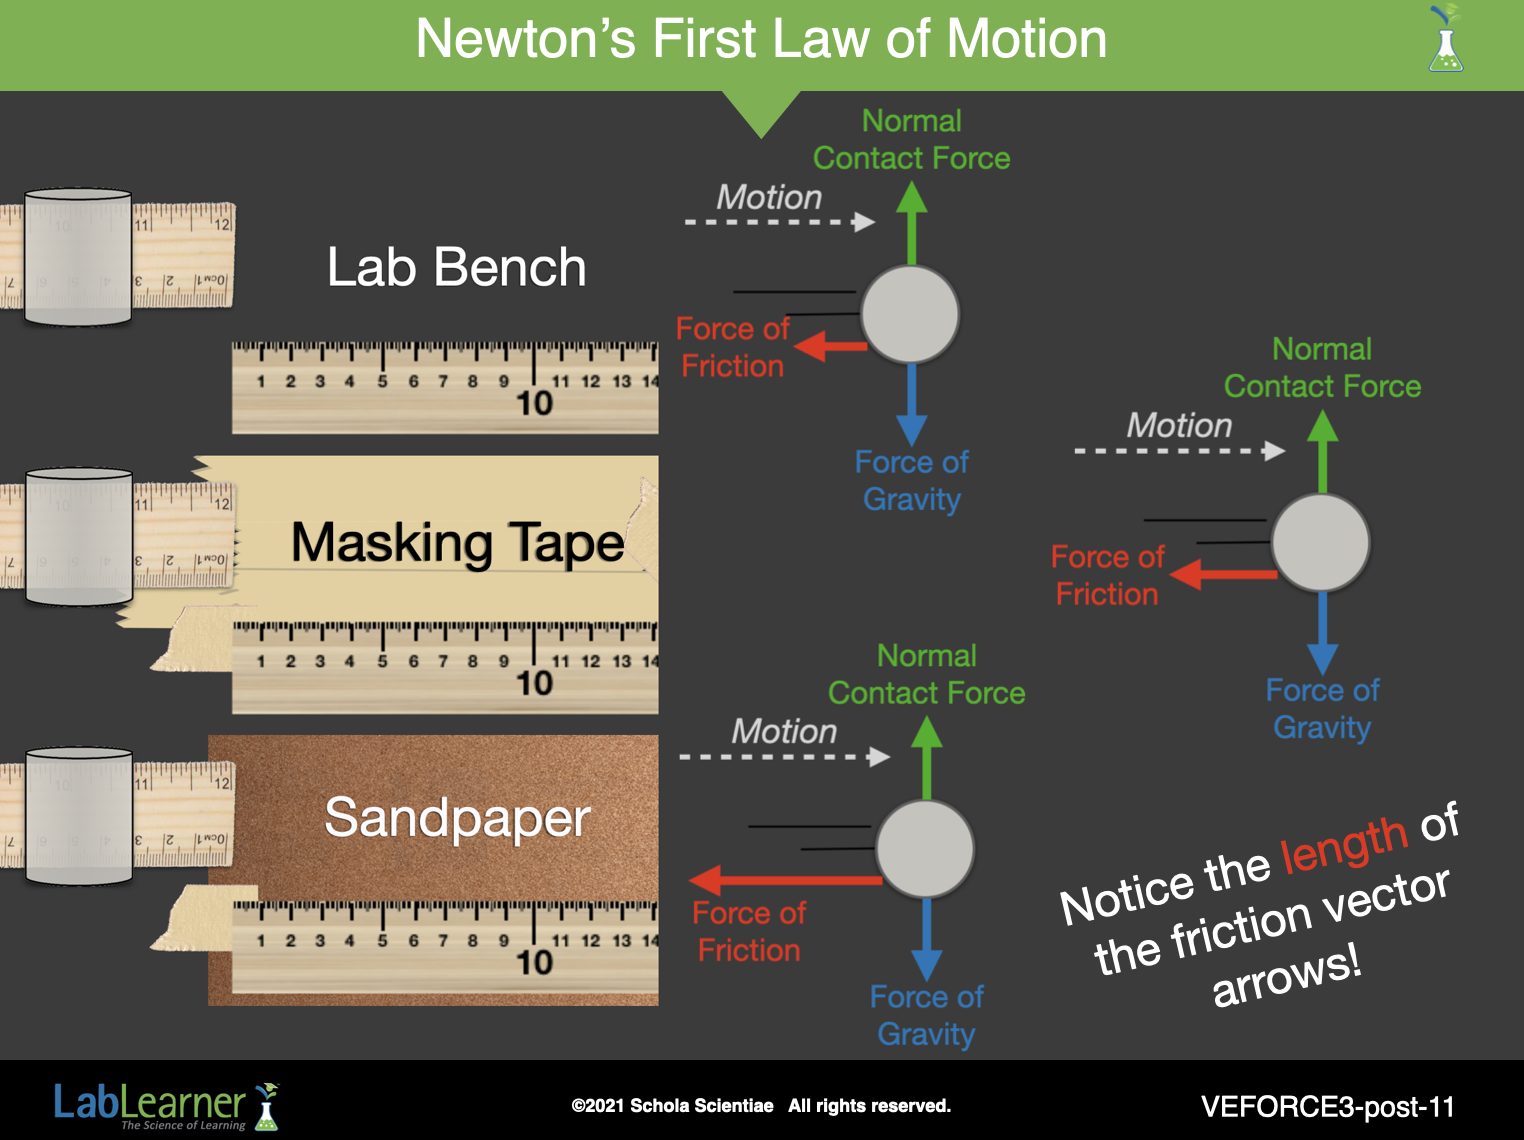
SLIDE VEFORCE3-post-11
Explain to students that this diagram depicts the acrylic cylinder when it was rolling along the lab table surface after leaving the ruler ramp.
Ask students: How could we change this diagram to show forces are acting on the acrylic cylinder when it is rolling on the masking tape? Student answers may vary. If necessary, assist students by asking them about each force in turn and whether it has changed.
Assist students in realizing that the only change is in the magnitude of the force of friction. NOTICE: that the friction vector arrow for the masking tape Trial (Trial 2) is longer, and therefore has a greater magnitude, than the friction arrow on the lab bench surface.
Ask students: How could we change this diagram to show forces are acting on the acrylic cylinder when it is rolling on the sandpaper? Student answers may vary. If necessary, assist students by asking them about each force in turn and whether it has changed.
Assist students in realizing that the only change is in the magnitude of the force of friction. NOTICE: that the friction vector arrow for the sandpaper Trial (Trial 3) is longer, and therefore has a greater magnitude, than the friction arrow on the masking tape surface.
Direct students to copy down the diagram in Problem 11 of their Student Data Record. Student drawings will vary. Ensure that students label the surface on which the acrylic cylinder is rolling, and check for an appropriate length of the arrow depicting frictional force.
______________________________________________
KEYS: LAB/POSTLAB