Teacher Portal:
Earth’s Forces
Investigation 2 – PostLab
 PRINT IT
Use your browser to download a printable PDF as help during the slide presentation and to make additional notes. In your browser, go to File > Print and then choose to save as PDF.
NAVIGATE IT
Once the slide presentation is launched
- use your left and right arrows to advance or go back in the slide presentation, and
- hover your mouse over the left edge of the presentation to get a view of the thumbnails for all the slides so that you can quickly move anywhere in the presentation.
- Click HERE to launch the slide presentation for the CELL.
SHARE IT
SLIDE VEFORCE2-post-1
The most essential content of this Investigation and lab experience is for students to learn that:
-
- things speed up as they fall and that this increased speed is called acceleration.
- the mass of a falling object does not affect its speed or rate of fall
- the rate of increase in speed during fall is due to the force of gravity and, on Earth, is 9.8 m/s2.
Begin the PostLab analysis by reminding students of the procedures conducted in the lab and the questions that the procedures were designed to answer.
______________________________________________

SLIDE VEFORCE2-post-2
Explain to students that before they can analyze the data collected in the Lab, they should first refresh their memory of what was done. One good way to do this is to use the Cognitive Tool, Summarize. The Summarize tool can be used as follows.
Ask a volunteer to remind the class what a summary is. A summary is a statement that contains the most important information, while leaving out the details that are not important to understanding what happened.
Ask students to summarize the first Trial. Student summaries may vary. The first trial asked students to create a ball from modeling clay and to time the number of seconds it took for the ball to drop from three different heights.
Ask students to summarize the second Trial. Student summaries may vary. The second trial was a partial replication of the first trial, except that the mass of the ball was greater than in the first trial.
______________________________________________
SLIDE VEFORCE2-post-3
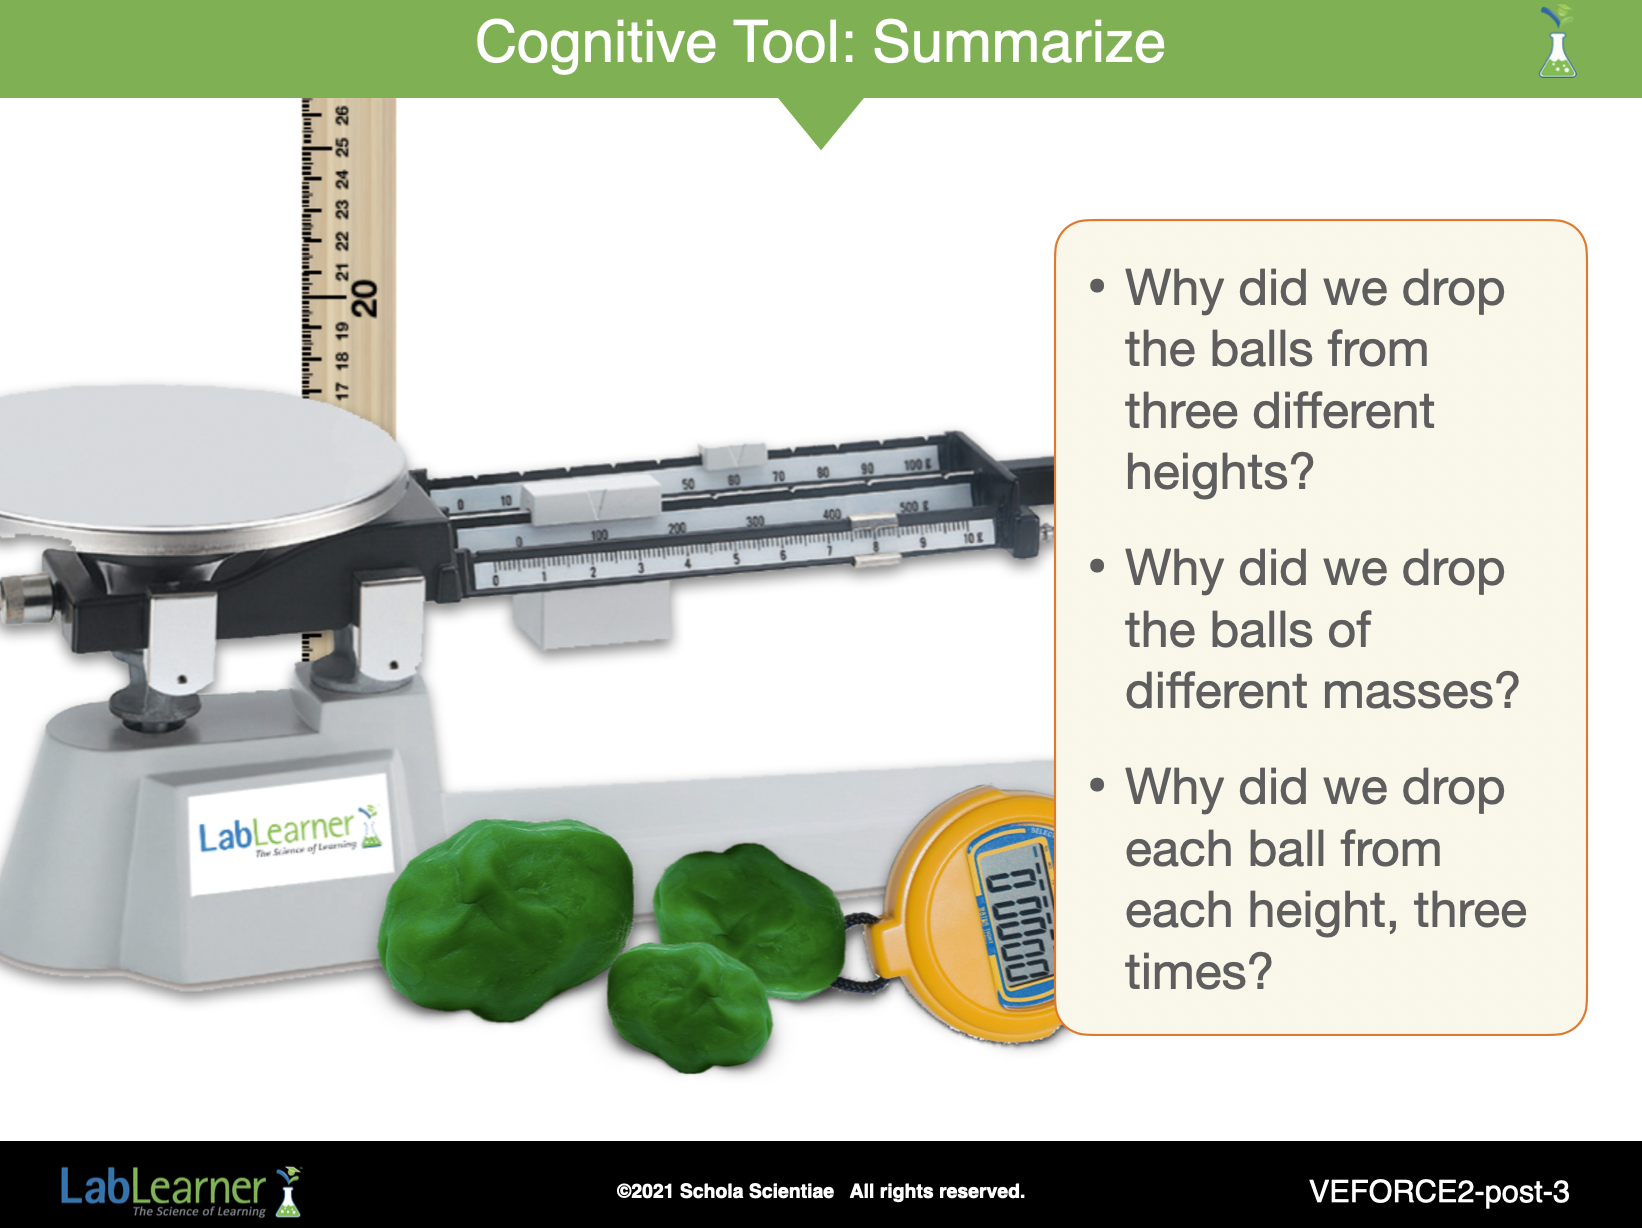
The following questions are intended to check students’ understanding of the reason behind the lab procedure:
Ask students: Why did we drop the balls from three different heights? Student answers may vary. Three heights were chosen to answer the question of whether the time taken to fall to the ground, varies with the initial height from which an object is dropped.
Ask students: Why did we drop balls of two different masses? Student answers may vary. Two balls of two different masses were used in order to examine the effect of the force of gravity on the acceleration of objects with varying masses.
Ask students: Why did we drop each ball from each height, three times? Student answers may vary. Three “runs” or samples of data were collected in part due to the large probability of error, due to the difficulty with timing the drops accurately.
Ask students if they remember the questions that the lab was designed to help them answer. The questions included: How does gravity cause acceleration? Can acceleration due to gravity be calculated?
Explain to students that they should continue to think about these questions as they should be able to answer them at the end of the Post-Lab.
______________________________________________
SLIDE VEFORCE2-post-4
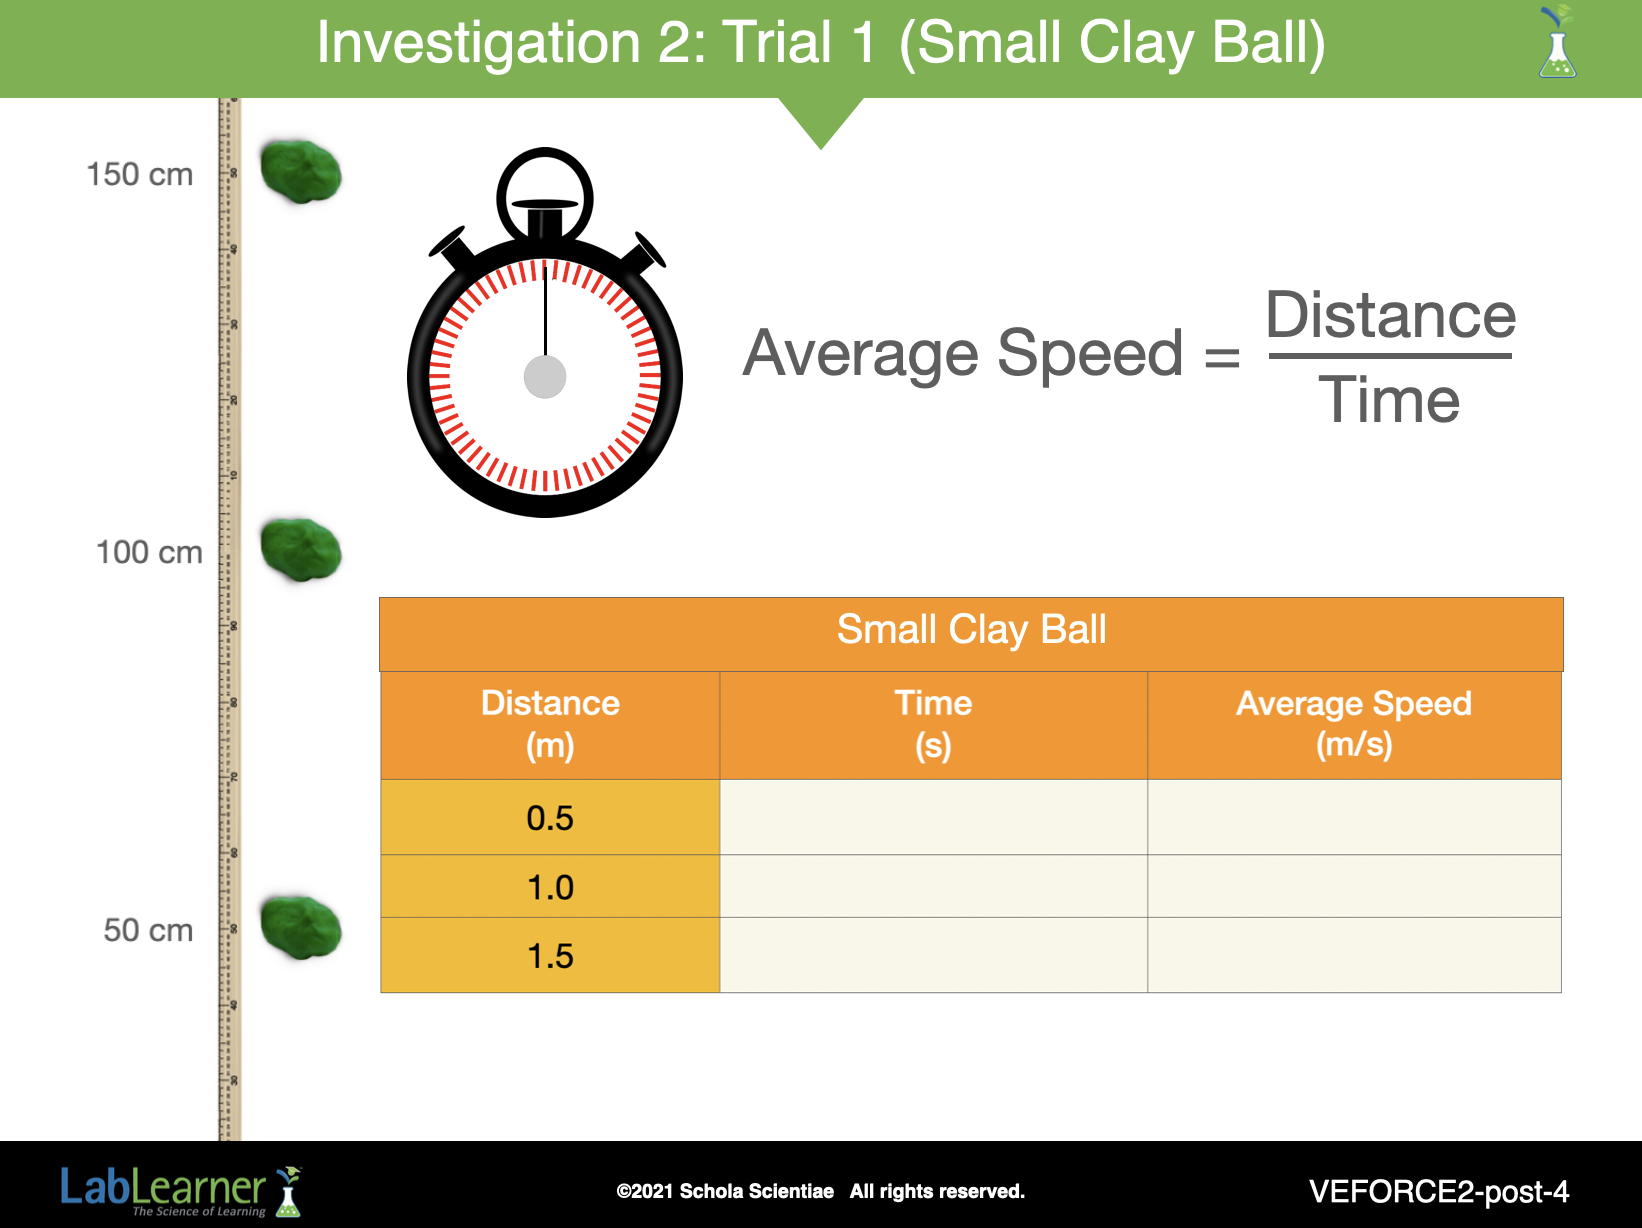
The first step is to calculate the average time taken to reach the ground for the smaller ball. Direct students’ attention to the Table in Problem 5 of the Student Data Record. Students should find the sum of the time taken for the ball to drop to the ground, then divide by three. Students should record this number as the average time taken, in the final row of the Table in Problem 5. Repeat the calculation for the data from each drop height.
Students should then transfer the number in each case, to the Table in Problem 11 of their Student Data Record.
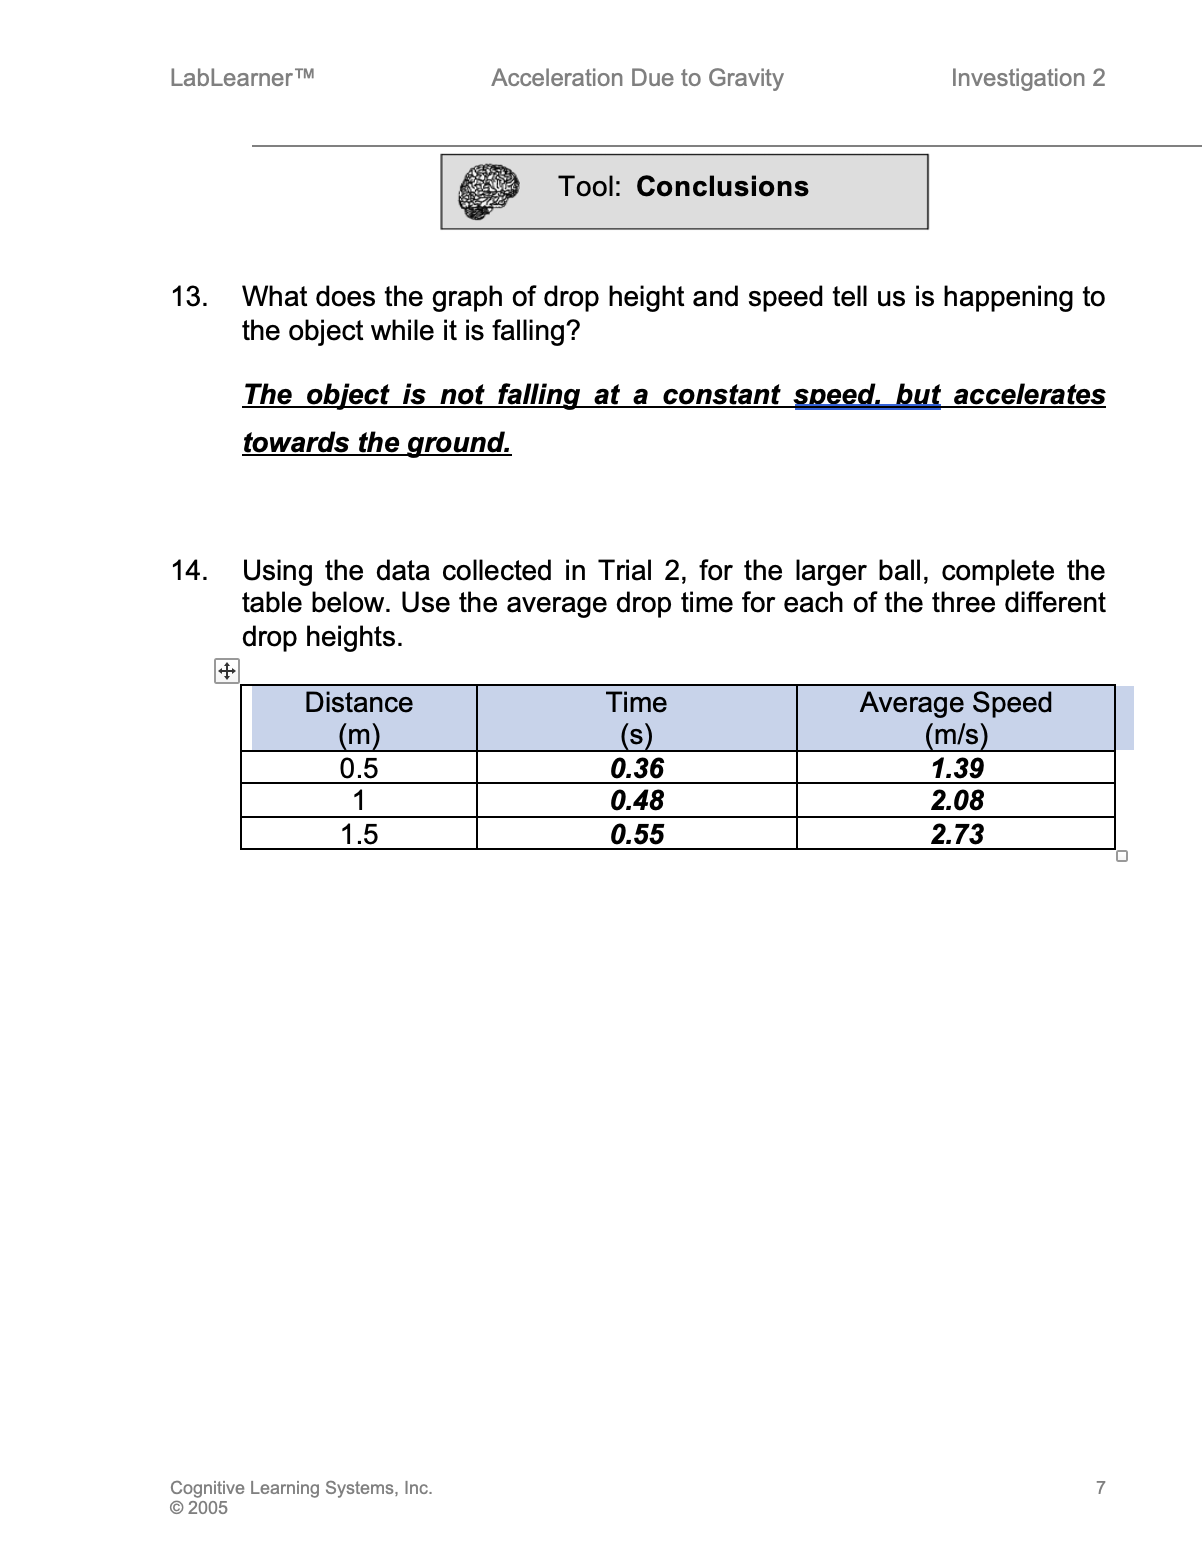
Assist students in calculating the average speed of the smaller ball from each drop height. (Note: The term average speed is used because the object is not moving at a constant speed).
Average speed = Distance/Time
Ask students if they can think of a way to show their data using a graph. Student answers may vary.
______________________________________________
SLIDE VEFORCE2-post-5
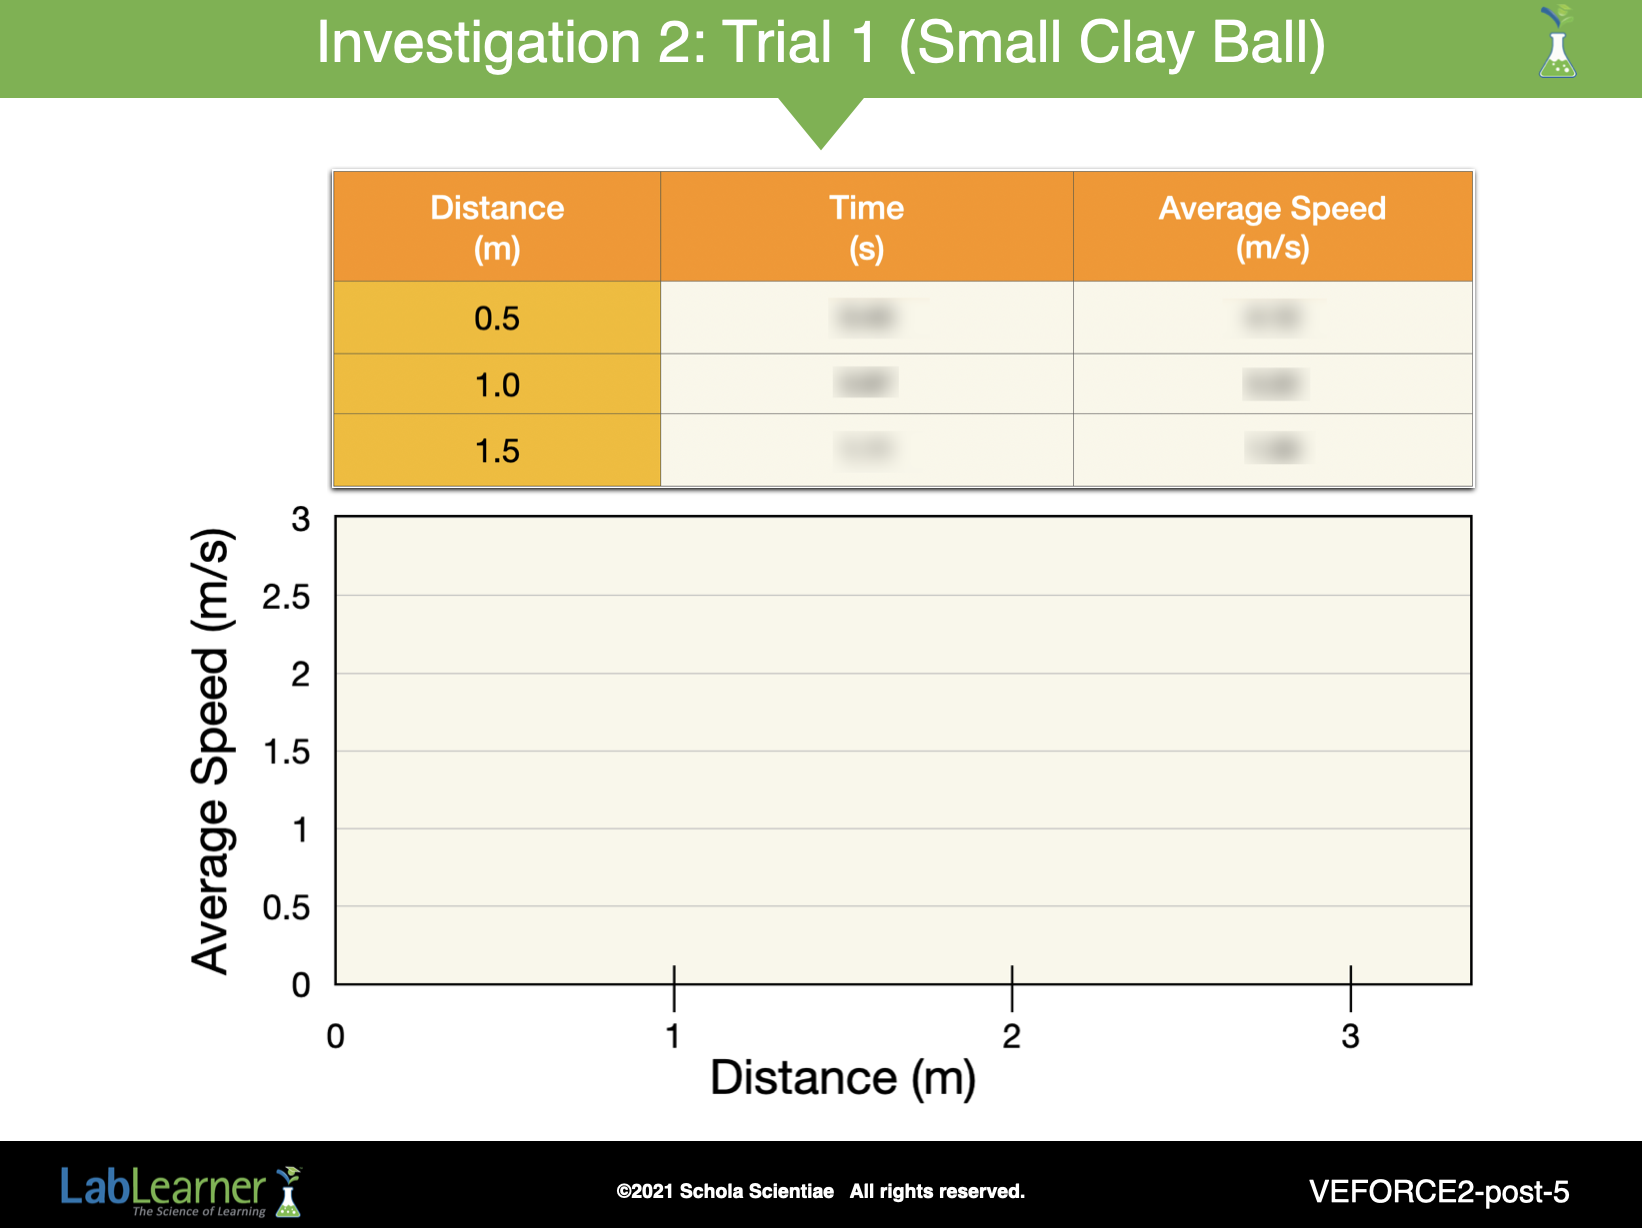
Guide students in the construction of a line graph in the blank space in Problem 11 of the Student Data Record. Remind students of the steps in Creating a Line Graph from the Procedural Toolbox, if necessary.
- Draw an x-axis and a y-axis.
- Decide which variable to plot on the x-axis and which variable to plot on the y-axis.
- Label the axes appropriately.
- Decide the beginning and ending numbers to place on the x-axis and y-axis. The numbers should allow all the points to be plotted on the graph.
- Decide the scale for each axis.
- Graph the data and connect the points with a line.
______________________________________________
SLIDE VEFORCE2-post-6
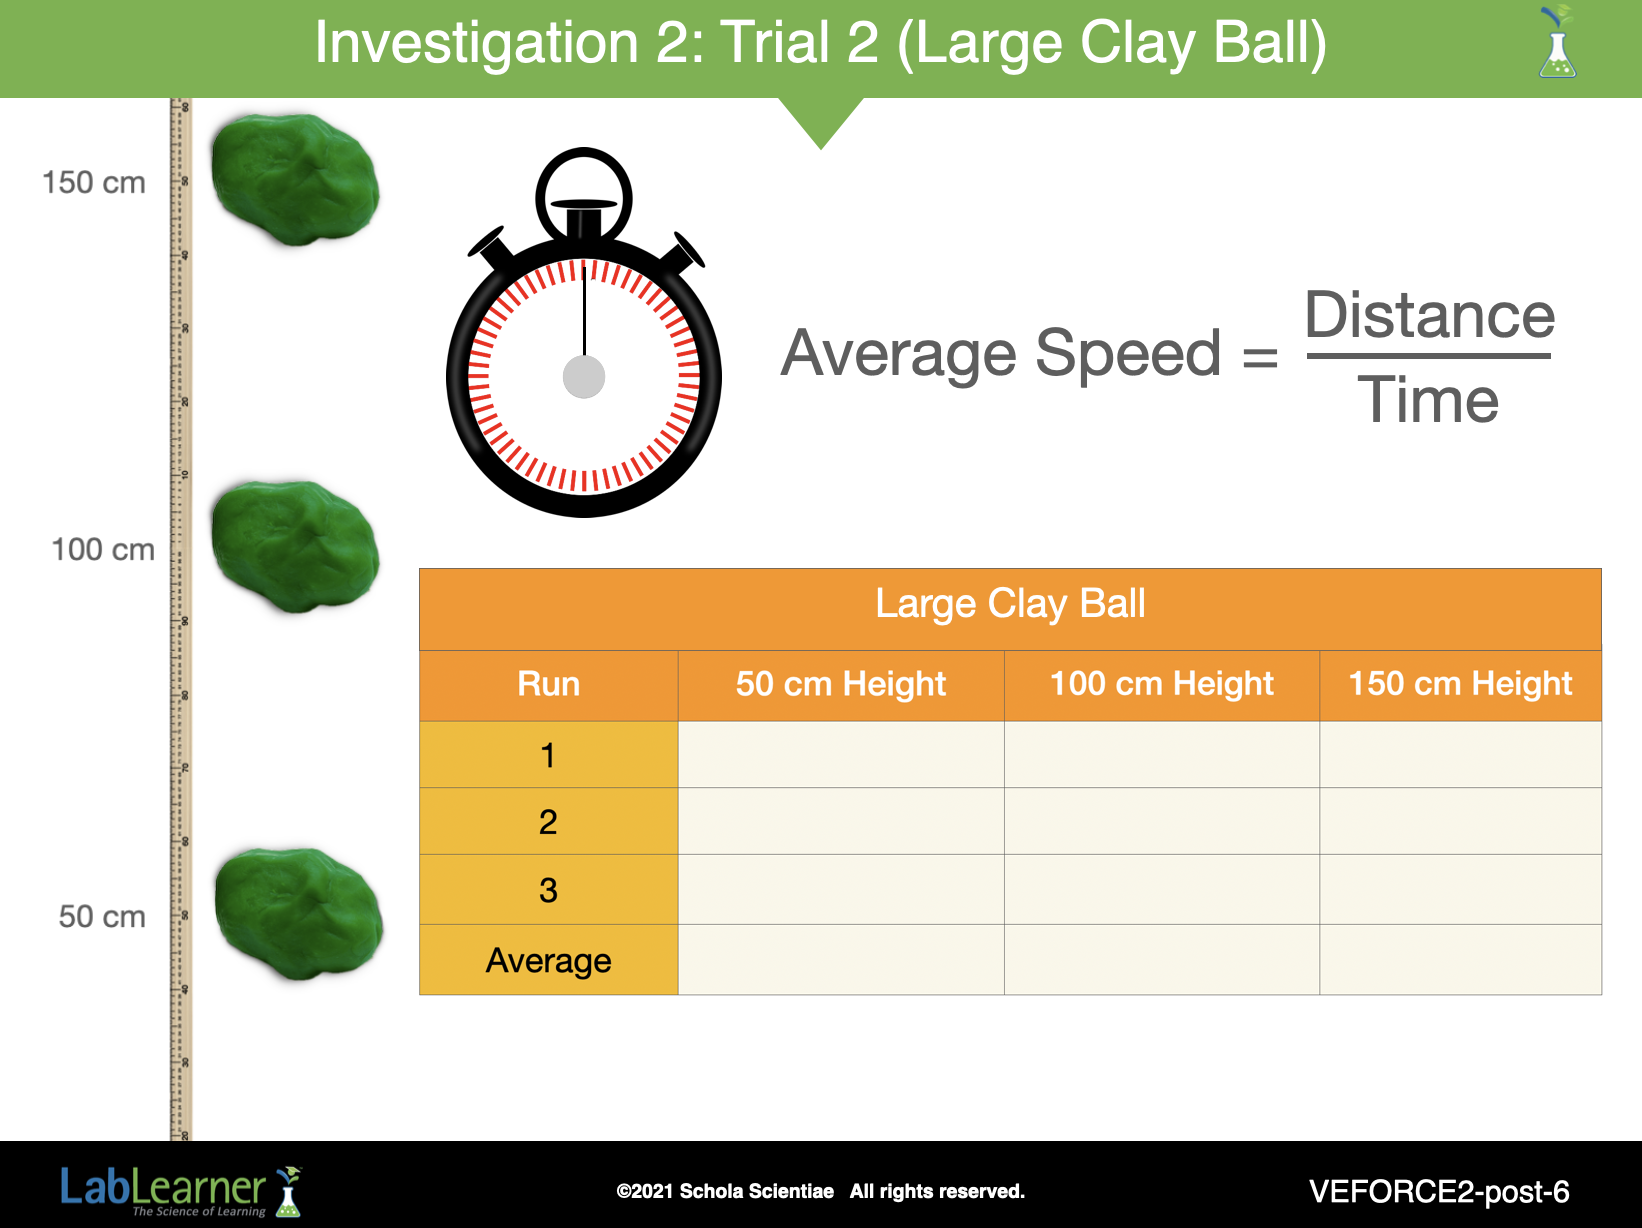
Analyze the data students recorded in Trial 2 in the same manner as they did for Trial 1 data, this time recording their data in Problem 10f of their Student Data Record.
Students should then transfer the number in each case, to the table in Problem 14 of their Student Data Record.
Assist students in calculating the average speed of the larger ball from each drop height.
Average speed = Distance/Time
Ask students if they can think of a way to show their data using a graph. Student answers may vary.
______________________________________________

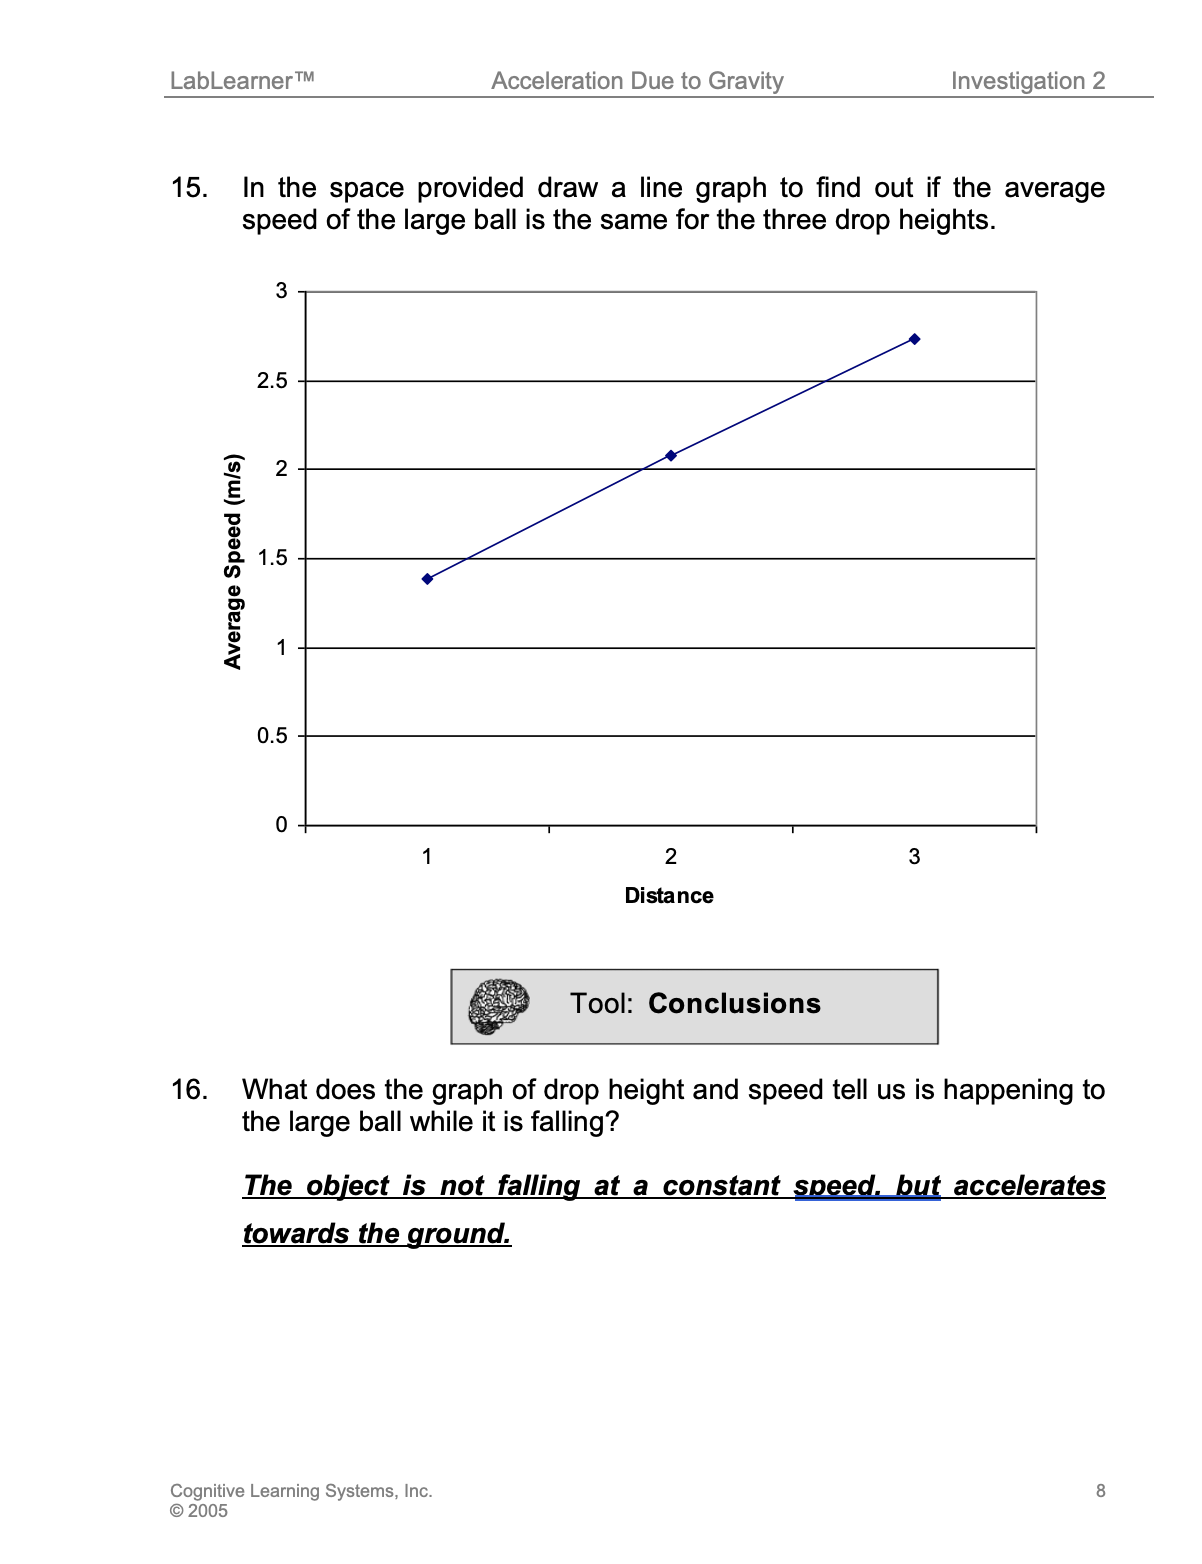
SLIDE VEFORCE2-post-7
Guide students in the construction of a line graph in the blank space in Problem 15 of the Student Data Record. Remind students of the steps in Creating a Line Graph from the Procedural Toolbox, if necessary.
- Draw an x-axis and a y-axis.
- Decide which variable to plot on the x-axis and which variable to plot on the y-axis.
- Label the axes appropriately.
- Decide the beginning and ending numbers to place on the x-axis and y-axis. The numbers should allow all the points to be plotted on the graph.
- Decide the scale for each axis.
- Graph the data and connect the points with a line.
______________________________________________
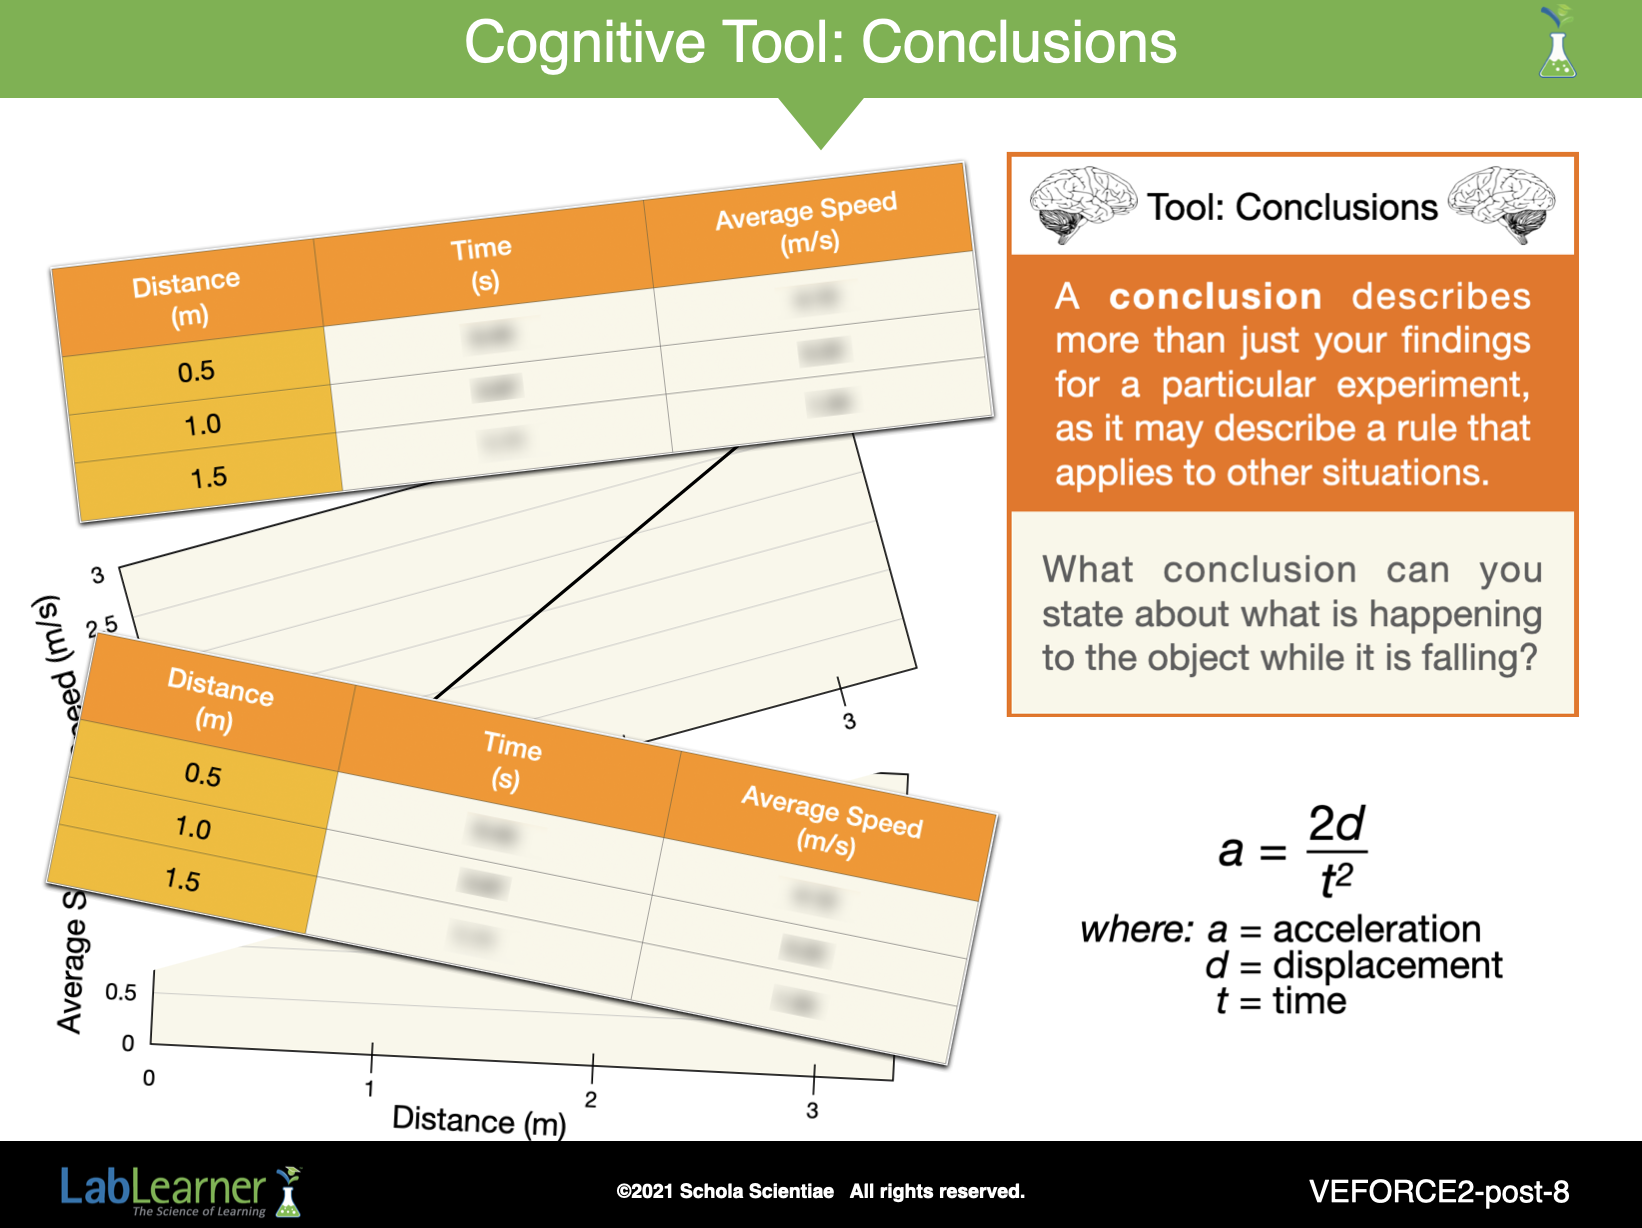
SLIDE VEFORCE2-post-8
Lead students into a discussion of the implications of their data, by introducing calculation of acceleration due to gravity.
Ask students to review the definition of acceleration from their Scientist’s Glossary.
“Acceleration: speeding up, slowing down or changing direction”
Ask the class whether the definition matches their data from the Lab. Students should indicate that their data shows that the balls speeded up towards the ground, which is evidence of acceleration.
Ask students: Were the forces on the ball balanced or unbalanced? How do you know? Students should indicate that the forces were unbalanced, as it accelerated. Unbalanced forces cause an acceleration.
Ask: Which force was acting on the ball once it was falling? Students should indicate that gravity was the only force acting on each ball once it was falling.
______________________________________________
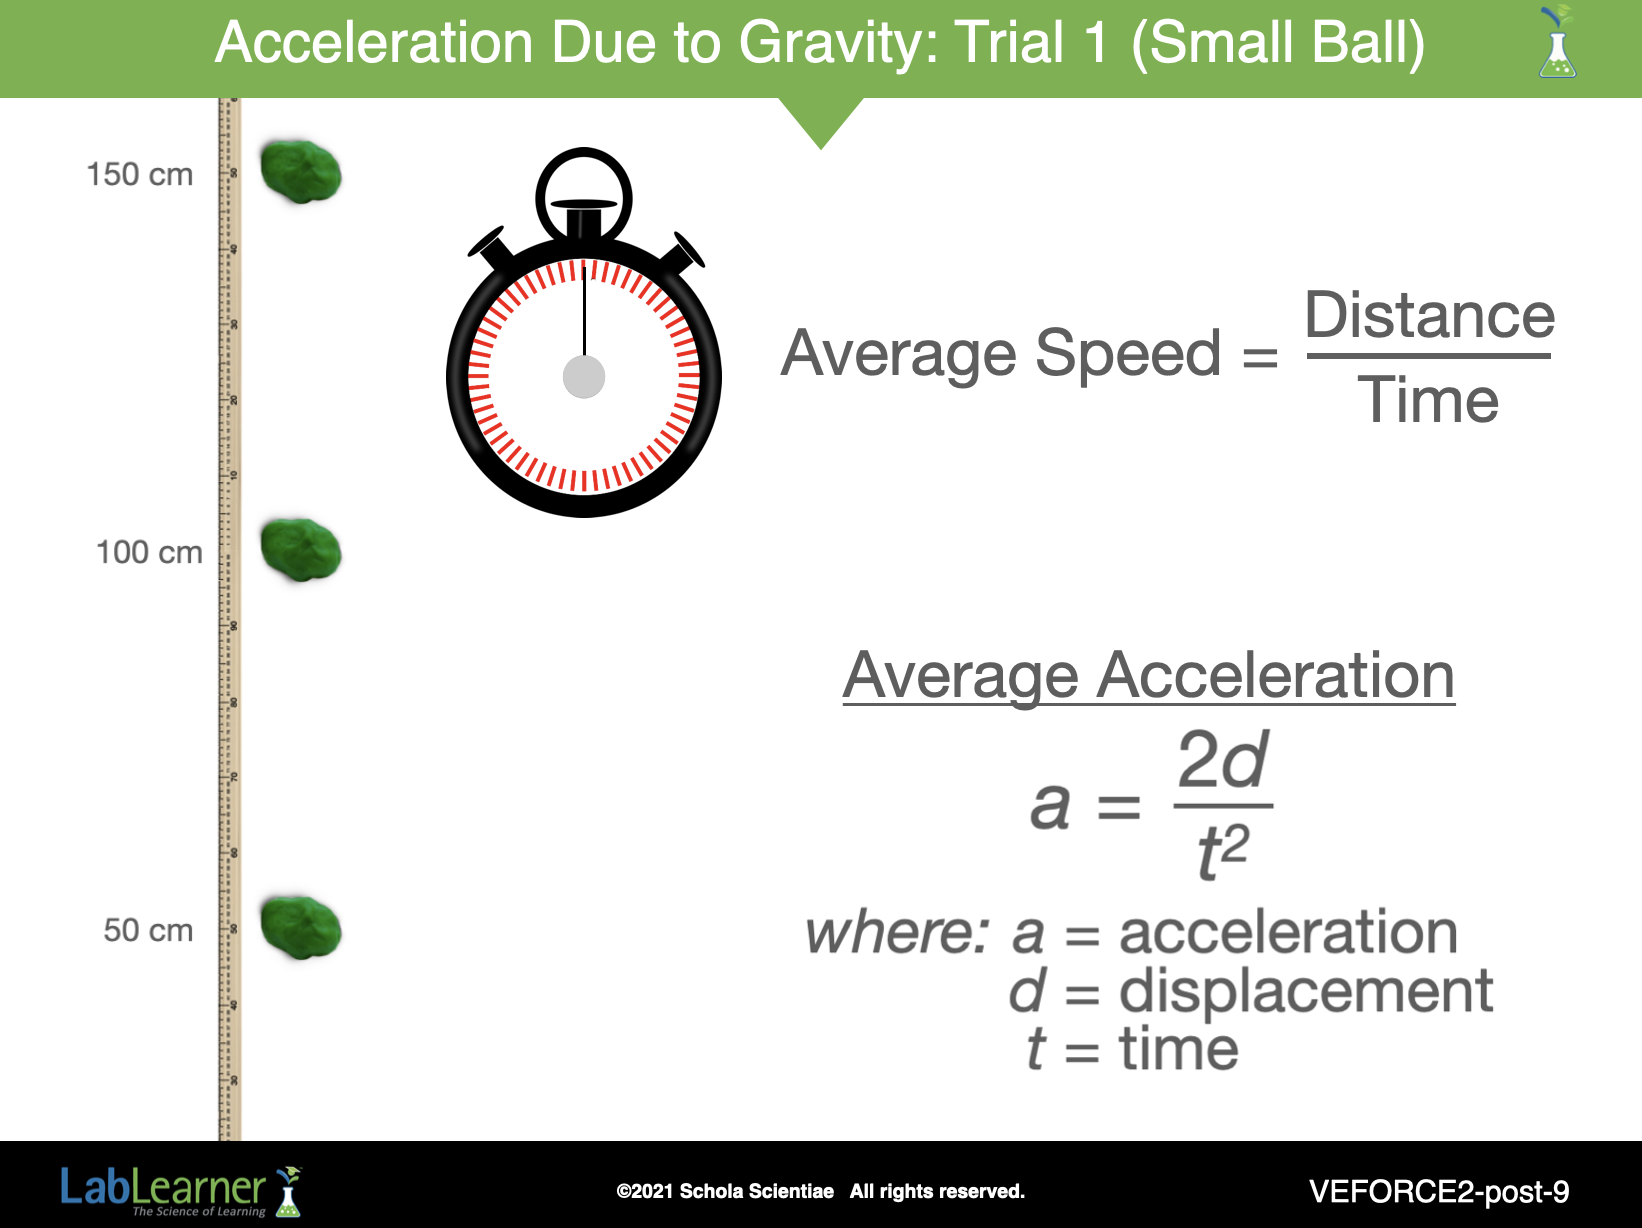
SLIDE VEFORCE2-post-9
Trial ONE Analysis:
Explain to the class that acceleration due to gravity can be calculated and that their experiments have gathered all the data needed to do this.
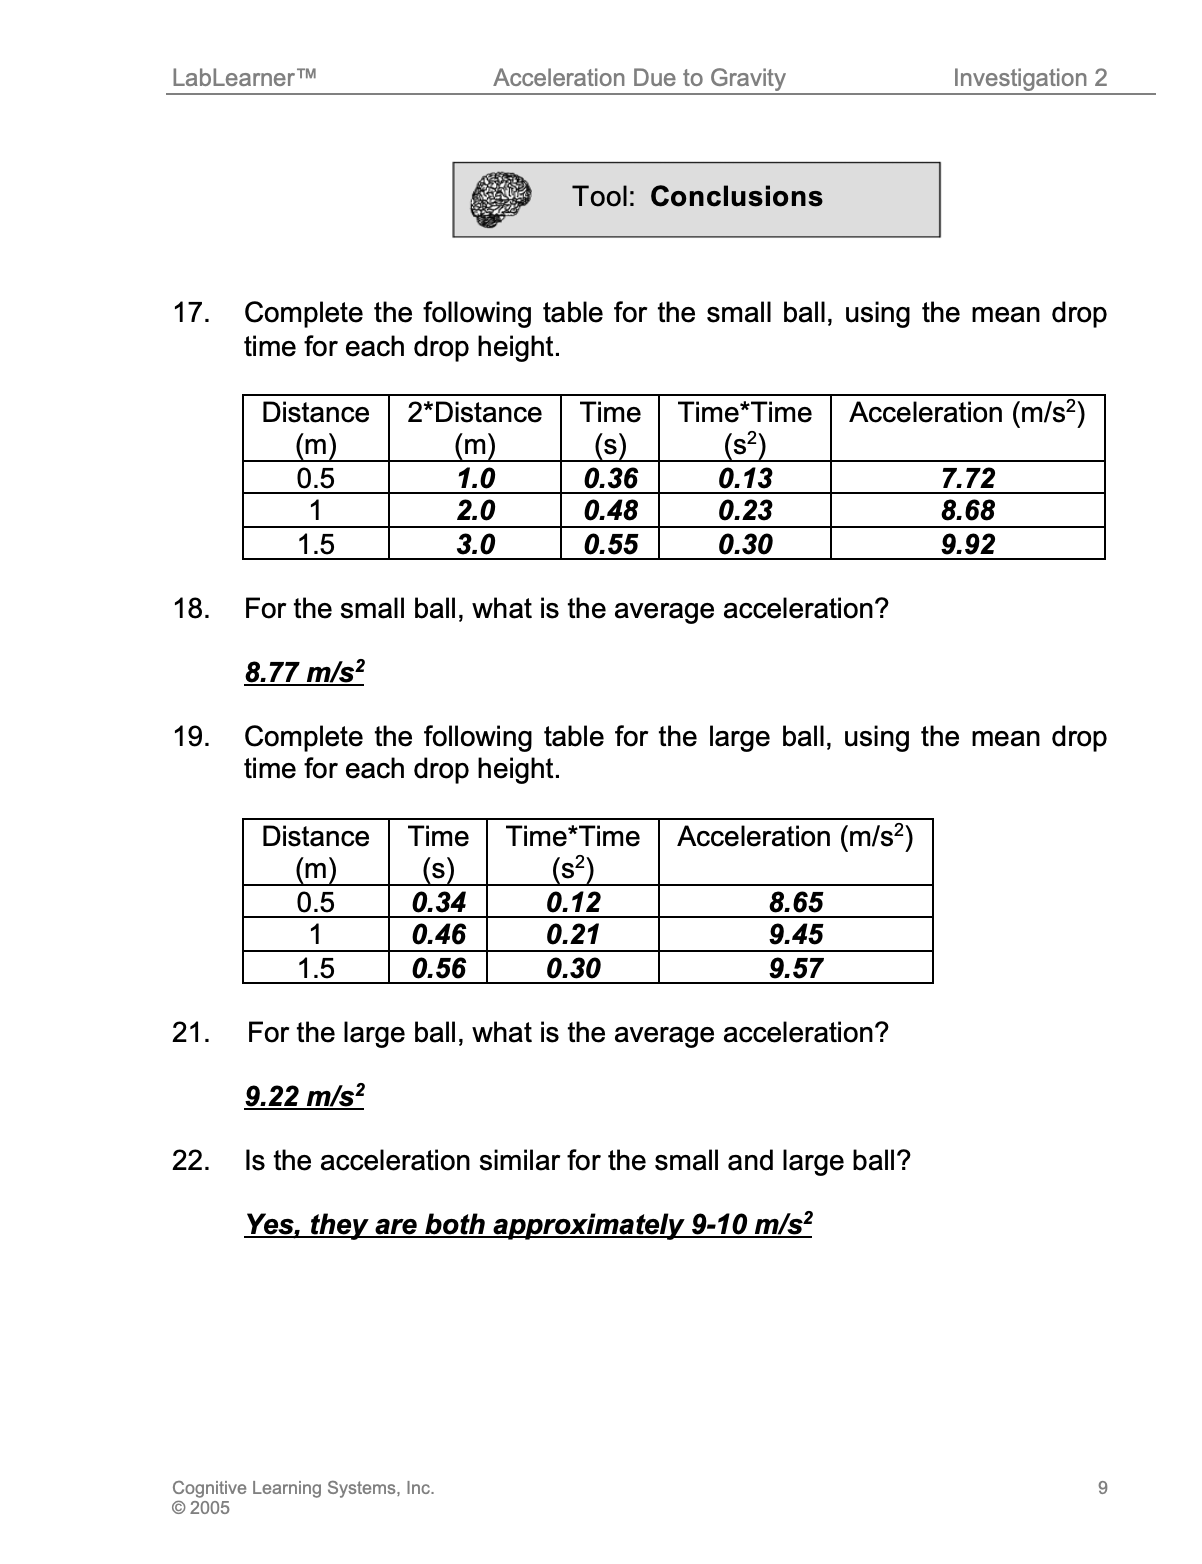
Tell students that they will first calculate the acceleration due to gravity, or by how much the ball was speeding up every second, for the first (small) ball. To compute acceleration, guide students through the following steps. Students may record their calculations in the Table in Problem 17 of their Student Data Record. If possible, allow students to use a calculator to assist them with their calculations:
-
- First, multiply the distance that each ball was dropped by 2. Record this in the “2 x Distance” column in the table.
- Next, record the average time taken for the smaller ball to drop each distance. Record this in the “Time” column in the table.
- Square the time taken and record this in the “Time x Time” column in the Table. If students have not learned to square numbers, simply tell them to multiply the time by the time.
- Finally, calculate average acceleration by dividing the “2 x Distance” column by the “Time x Time” column.
Students should then calculate the average acceleration by finding the sum of the three numbers and dividing by three.
Students should record their answers in Problem 18 of the Student Data Record.
Assist students in conceptually understanding what their answer means. For example, help students to understand that for every second that the ball was falling, it was accelerating (or speeding up) by 9.8 meters per second. After the first second, it reached a speed of 9.8 meters per second, but at the end of the next second, it had reached a speed of 19.6 meters per second.
______________________________________________
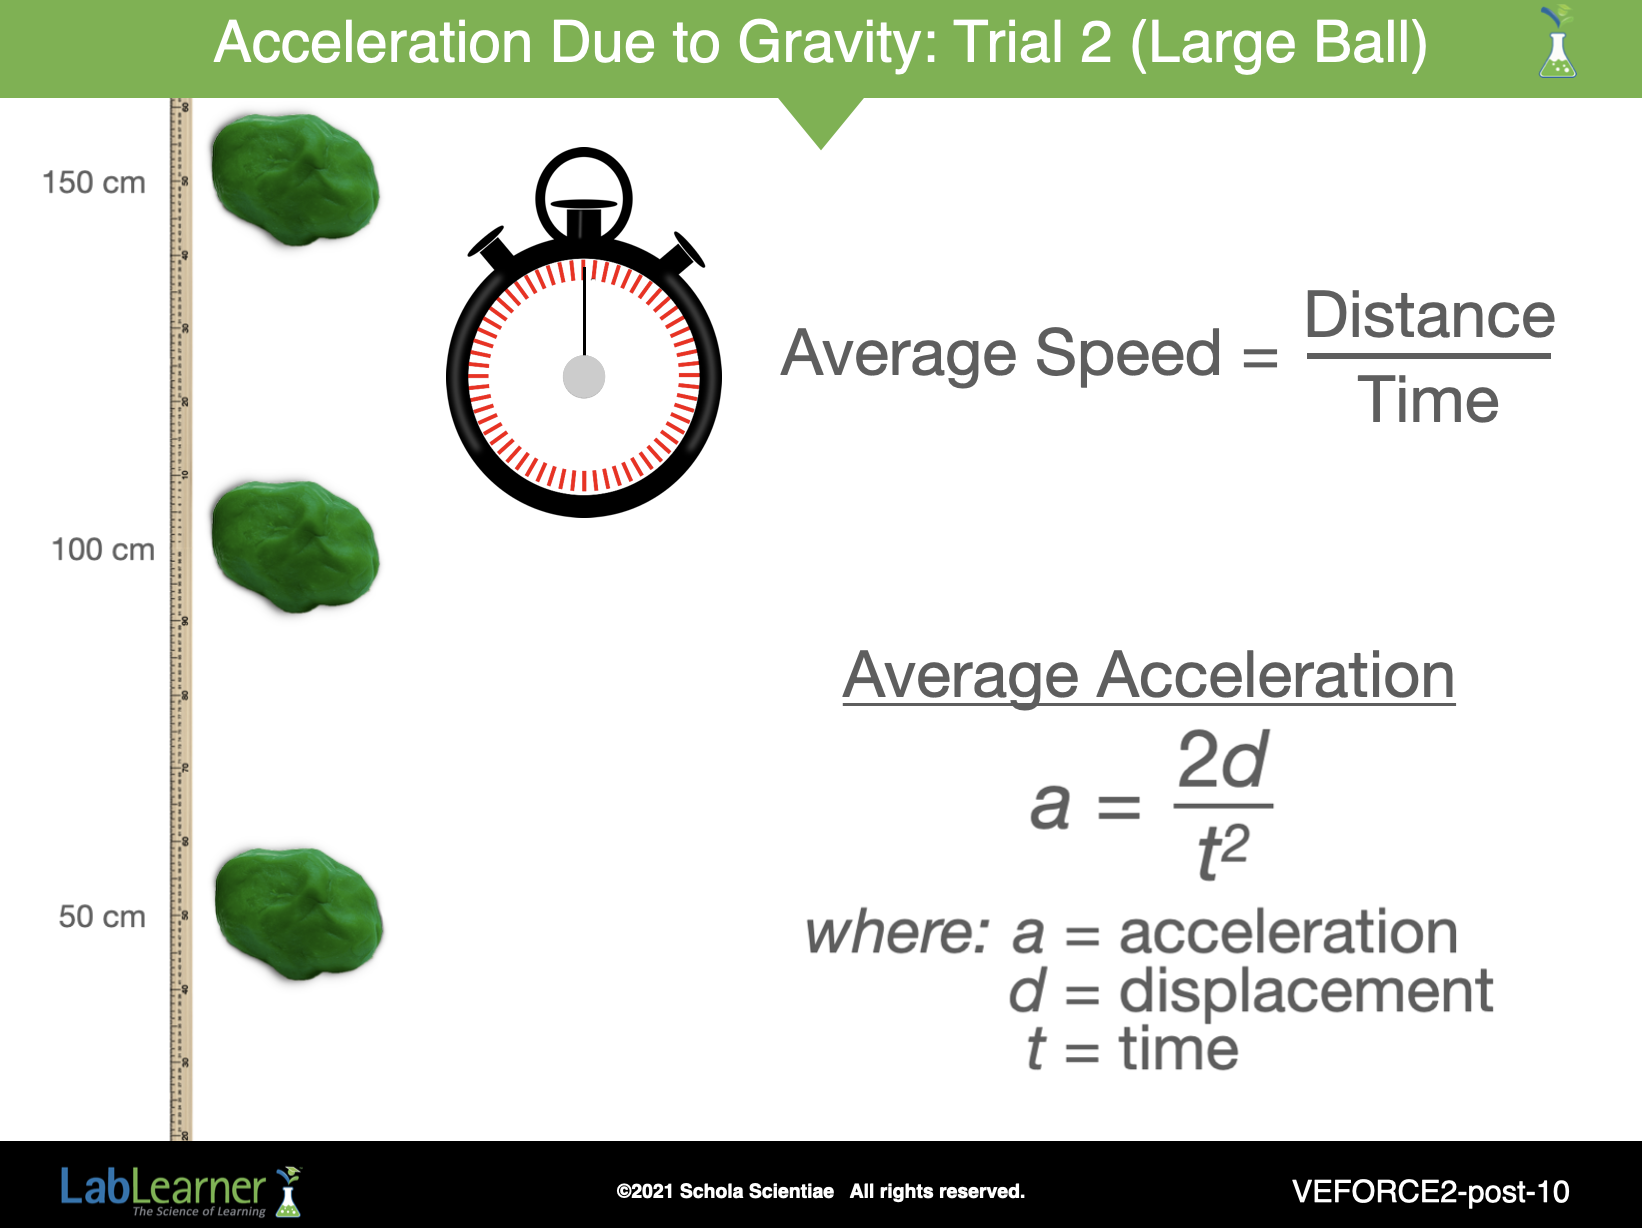
SLIDE VEFORCE2-post-10
Trial TWO Analysis:
Lead students through a similar analysis of Trial 2 data, in which a ball with a greater mass was dropped.
Tell students that they will next calculate the acceleration due to gravity, or by how much the ball was speeding up every second, for the second (large) ball. To compute acceleration, guide students through the following steps. Students may record their calculations in the Table in Problem 19 of their Student Data Record. If possible, allow students to use a calculator to assist them with their calculations:
-
- First, multiply the distance that each ball was dropped by 2. Record this in the “2 x Distance” column in the table.
- Next, record the average time taken for the smaller ball to drop each distance. Record this in the “Time” column in the table.
- Square the time taken and record this in the “Time x Time” column in the Table. If students have not learned to square numbers, simply tell them to multiply the time by the time.
- Finally, calculate average acceleration by dividing the “2 x Distance” column by the “Time x Time” column.
Students should then calculate the average acceleration by finding the sum of the three numbers and dividing by three.
Students should record their answer in Problem 20 of the Student Data Record.
Assist students who may have erroneous predictions, as they may demonstrate some confusion at their results. Students should indicate that the acceleration due to gravity is the same (or very similar) for each ball.
______________________________________________
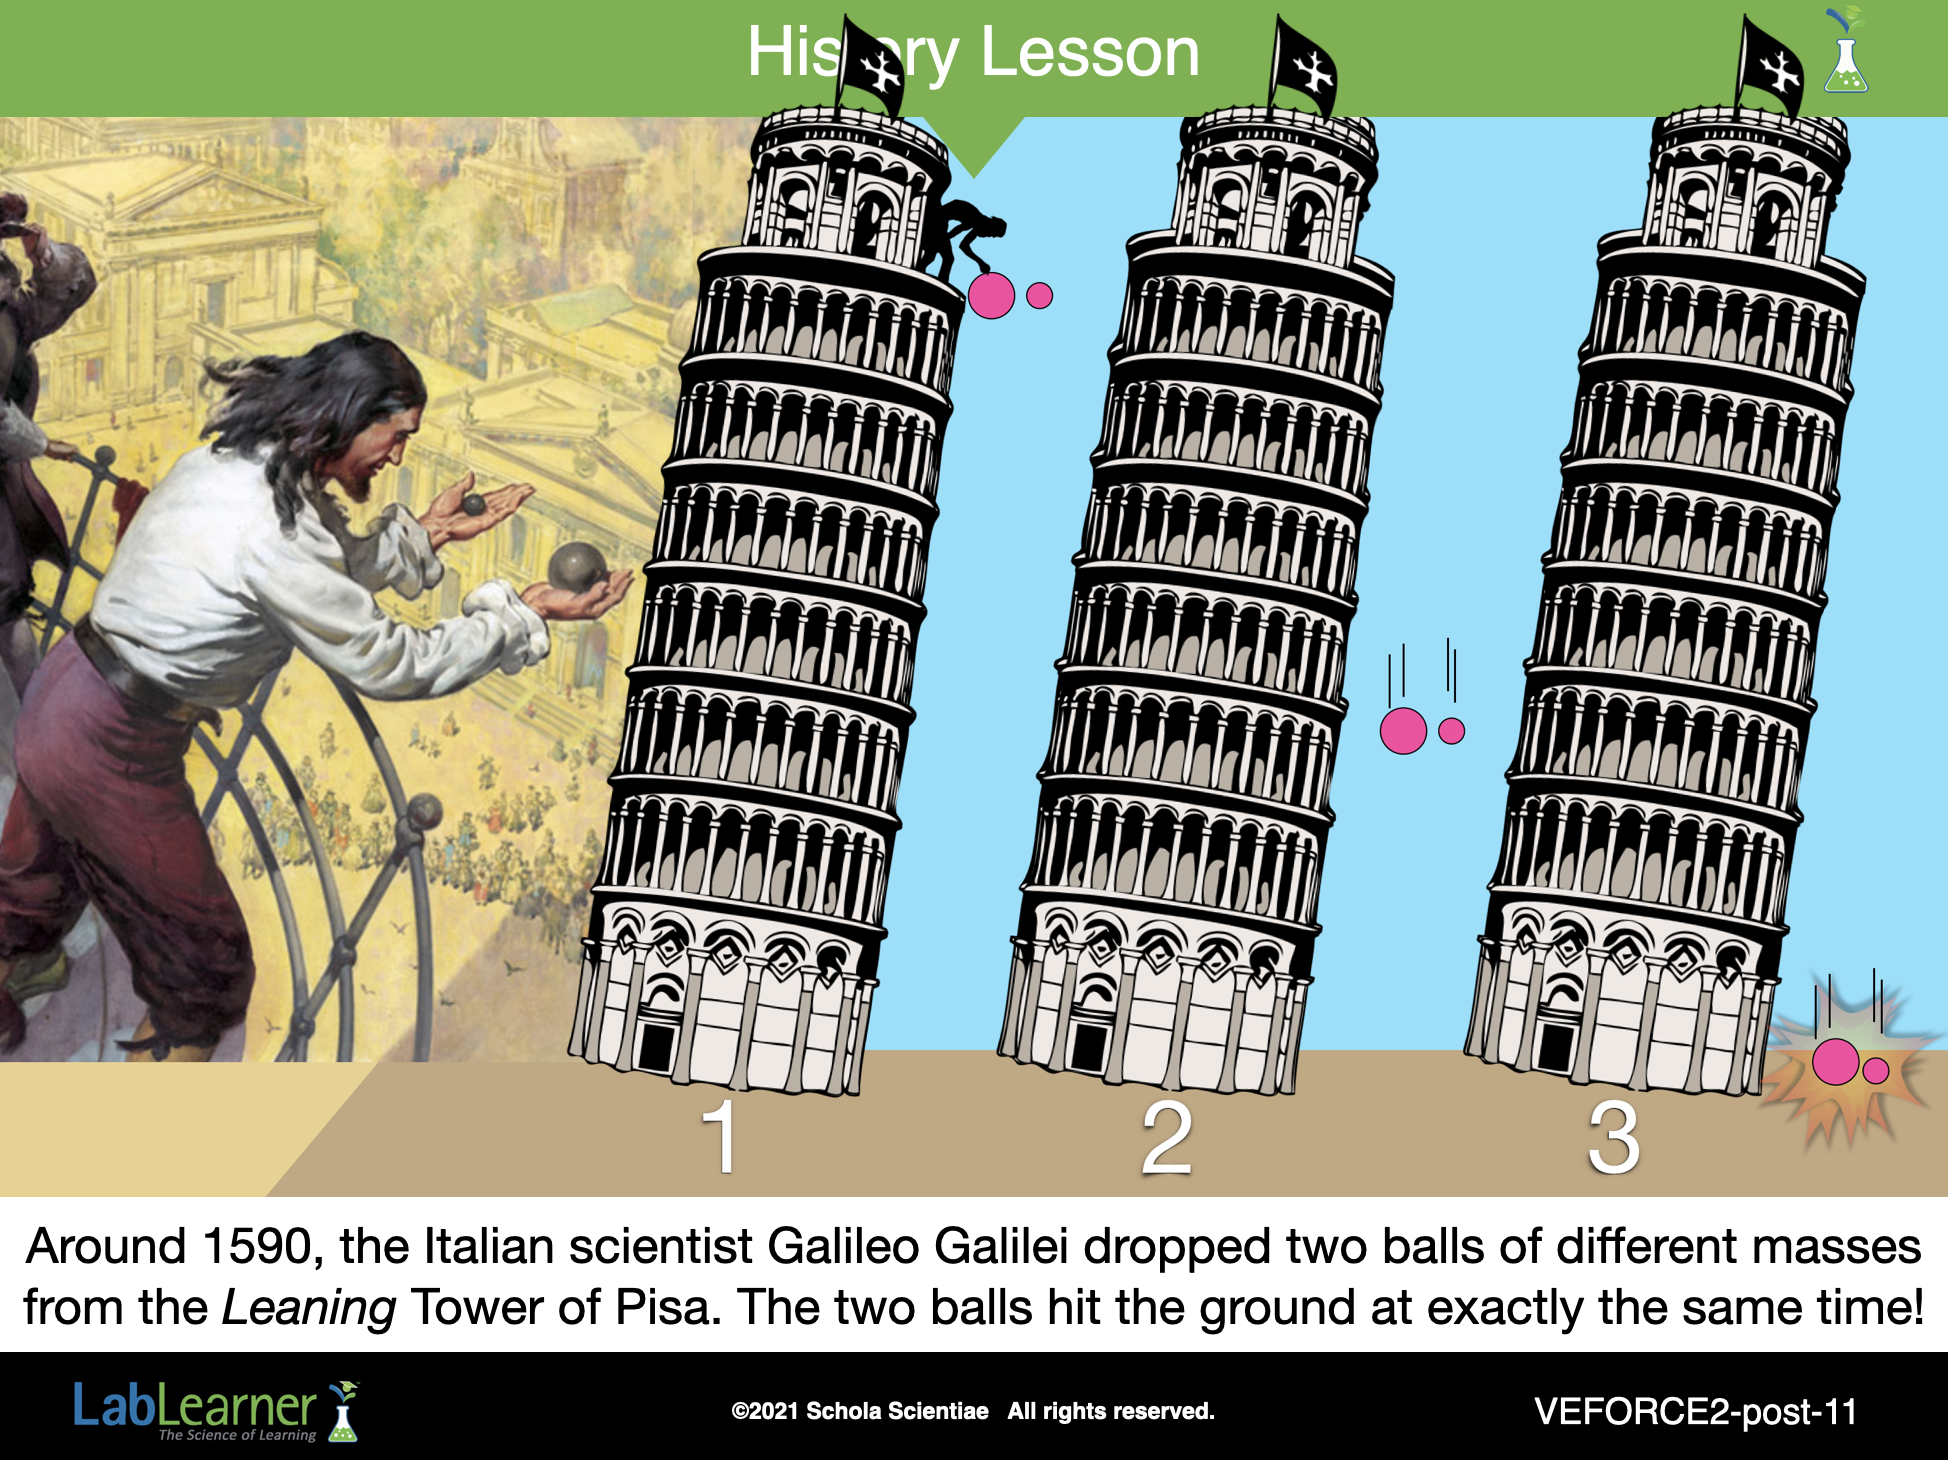
SLIDE VEFORCE2-post-11
This final slide gives credit to the Italian scientist, Galileo Galilei (1564-1642). He was only about 26 years old at the time of this famous investigation. This simple experiment completely changed the way scientists viewed physics and paved the way for further experiments on falling bodies, which, in turn, lead to the laws of gravity later expanded upon by Isaac Newton in England a number of years later.
In the experiments in Earth’s Forces Investigation Two, students essentially repeated this historic experiment when they timed the fall of the different-sized clay balls.
If it is possible and can be safely supervised, the teacher may wish to do a direct repeat of the Galileo experiment with two different masses dropped in a stairwell, off a balcony, or other height while timed with a stopwatch. Extreme care must be taken if such a demonstration is contemplated as students will also fall at 9.8 m/s2 if they are not careful!
KEYS: LAB/POSTLAB