Teacher Portal:
Exploring Ecosystems
Investigation 1 – PostLab
 PRINT IT
Use your browser to download a printable PDF as help during the slide presentation and to make additional notes. In your browser, go to File > Print and then choose to save as PDF.
NAVIGATE IT
Once the slide presentation is launched
- use your left and right arrows to advance or go back in the slide presentation, and
- hover your mouse over the left edge of the presentation to get a view of the thumbnails for all the slides so that you can quickly move anywhere in the presentation.
- Click HERE to launch the slide presentation for the CELL.
SHARE IT
SLIDE VECOSYS1-post-1
This was the first Investigation of the LabLearner CELL Exploring Ecosystems. In it, students learned about food chains and food webs.
______________________________________________
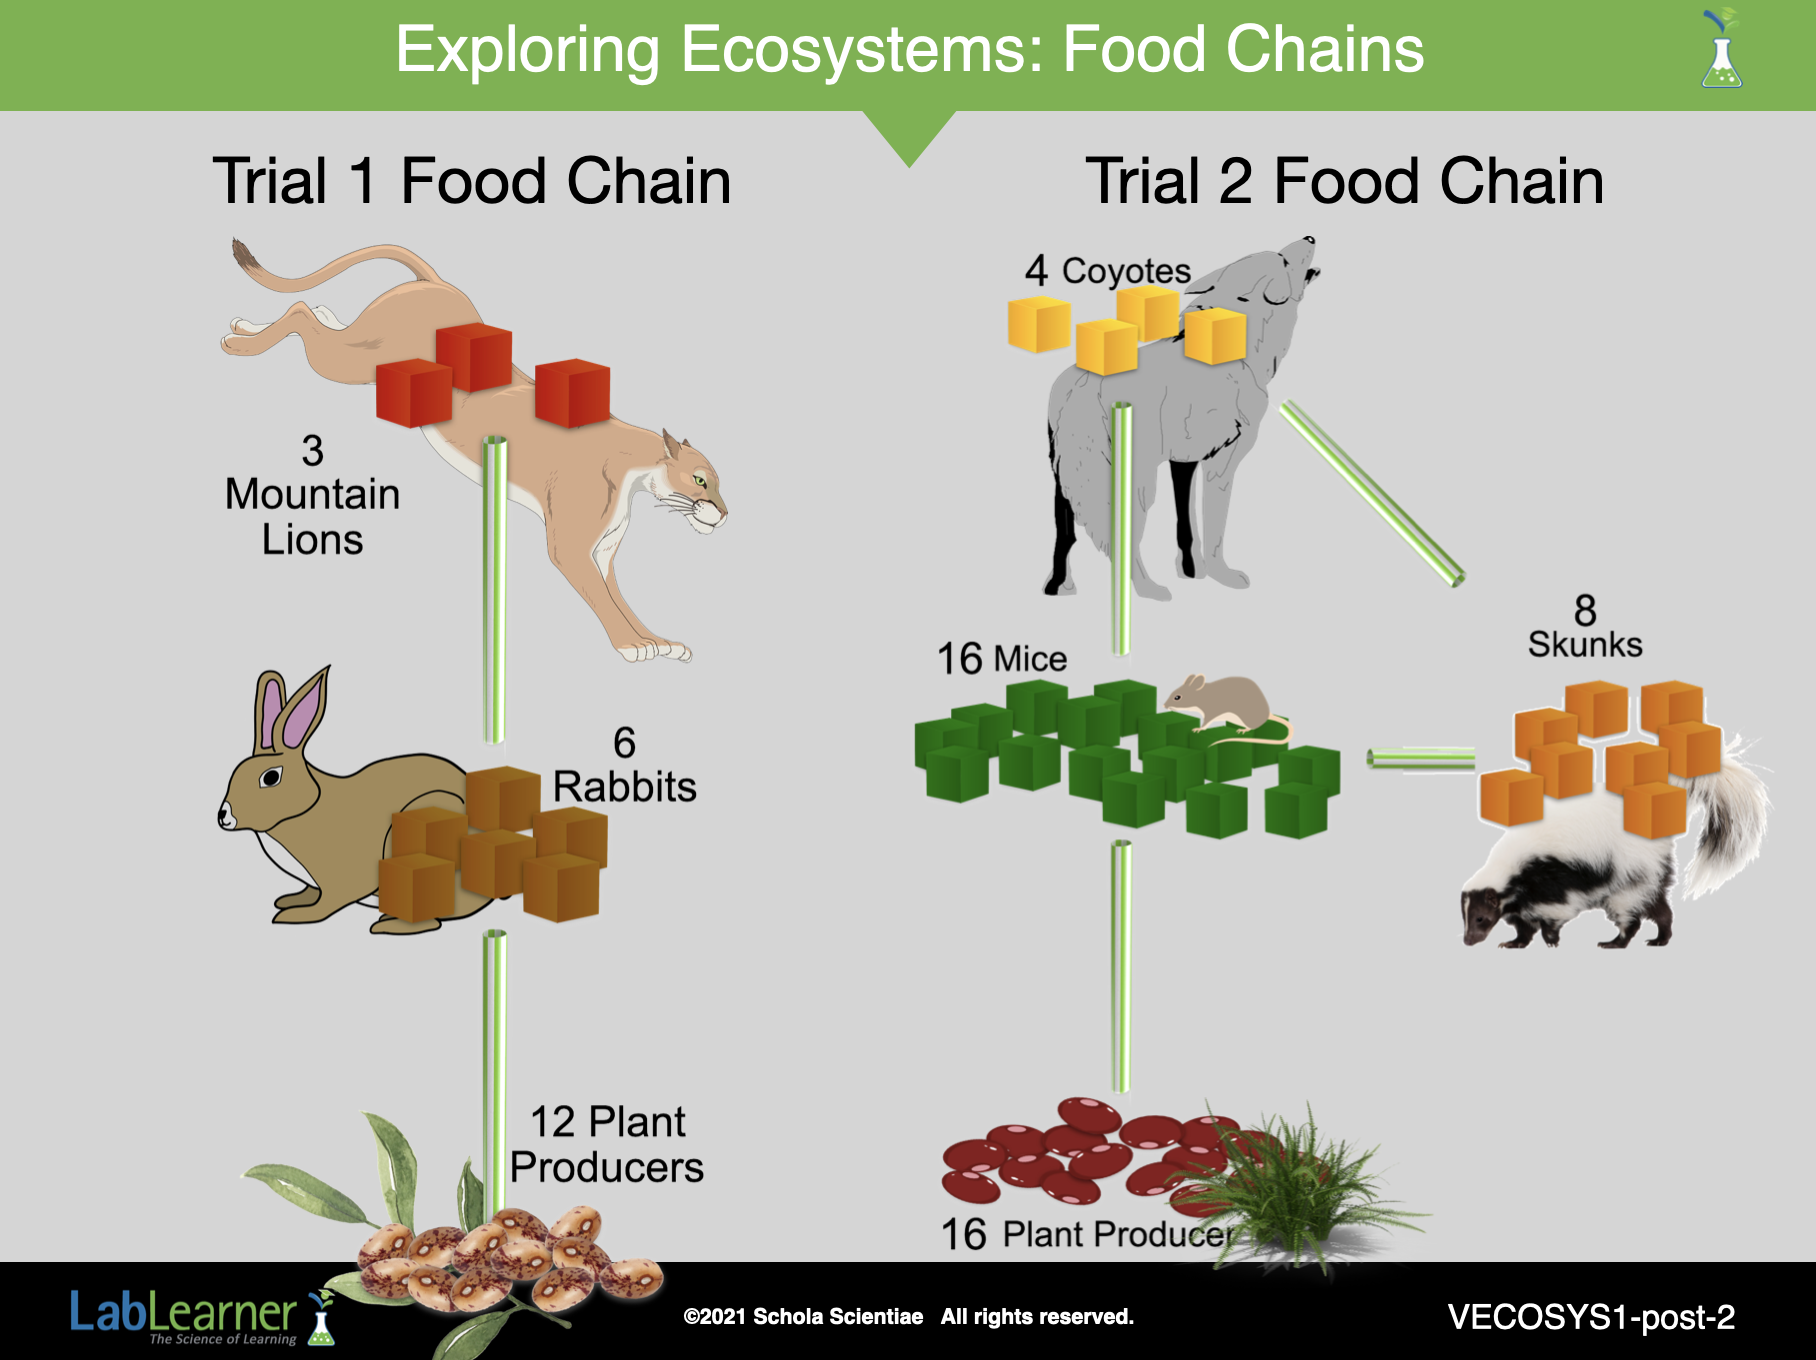
SLIDE VECOSYS1-post-2
A. Begin the analysis of the Lab by helping students to remember the experiments they conducted. The following problems may be helpful in prompting student discussion.
1. Ask students: What did you investigate in the Lab? Students investigated the interaction of organisms in a food web through the creation of model food chains and a food web. They also looked at the effect of a change in the environment on one of the food chains.
2. Ask students: What questions were explored in the Lab? Students should recall that the Lab was designed to show a method of calculating the numbers of producers, herbivores, carnivores and omnivores that could exist in a given ecosystem.
3. Ask students: Can you summarize what you did in the experiments? Students should indicate that they modeled a food web in an ecosystem. Pinto beans and kidney beans were used to model two producers in the ecosystem. Students then determined how many herbivores the producers could support, and the number of carnivores and omnivores that herbivores could support. Students determined what would happen if a drought killed off the producer of a food chain. They also determined how the number of organisms supported would change when the food web was created.
______________________________________________
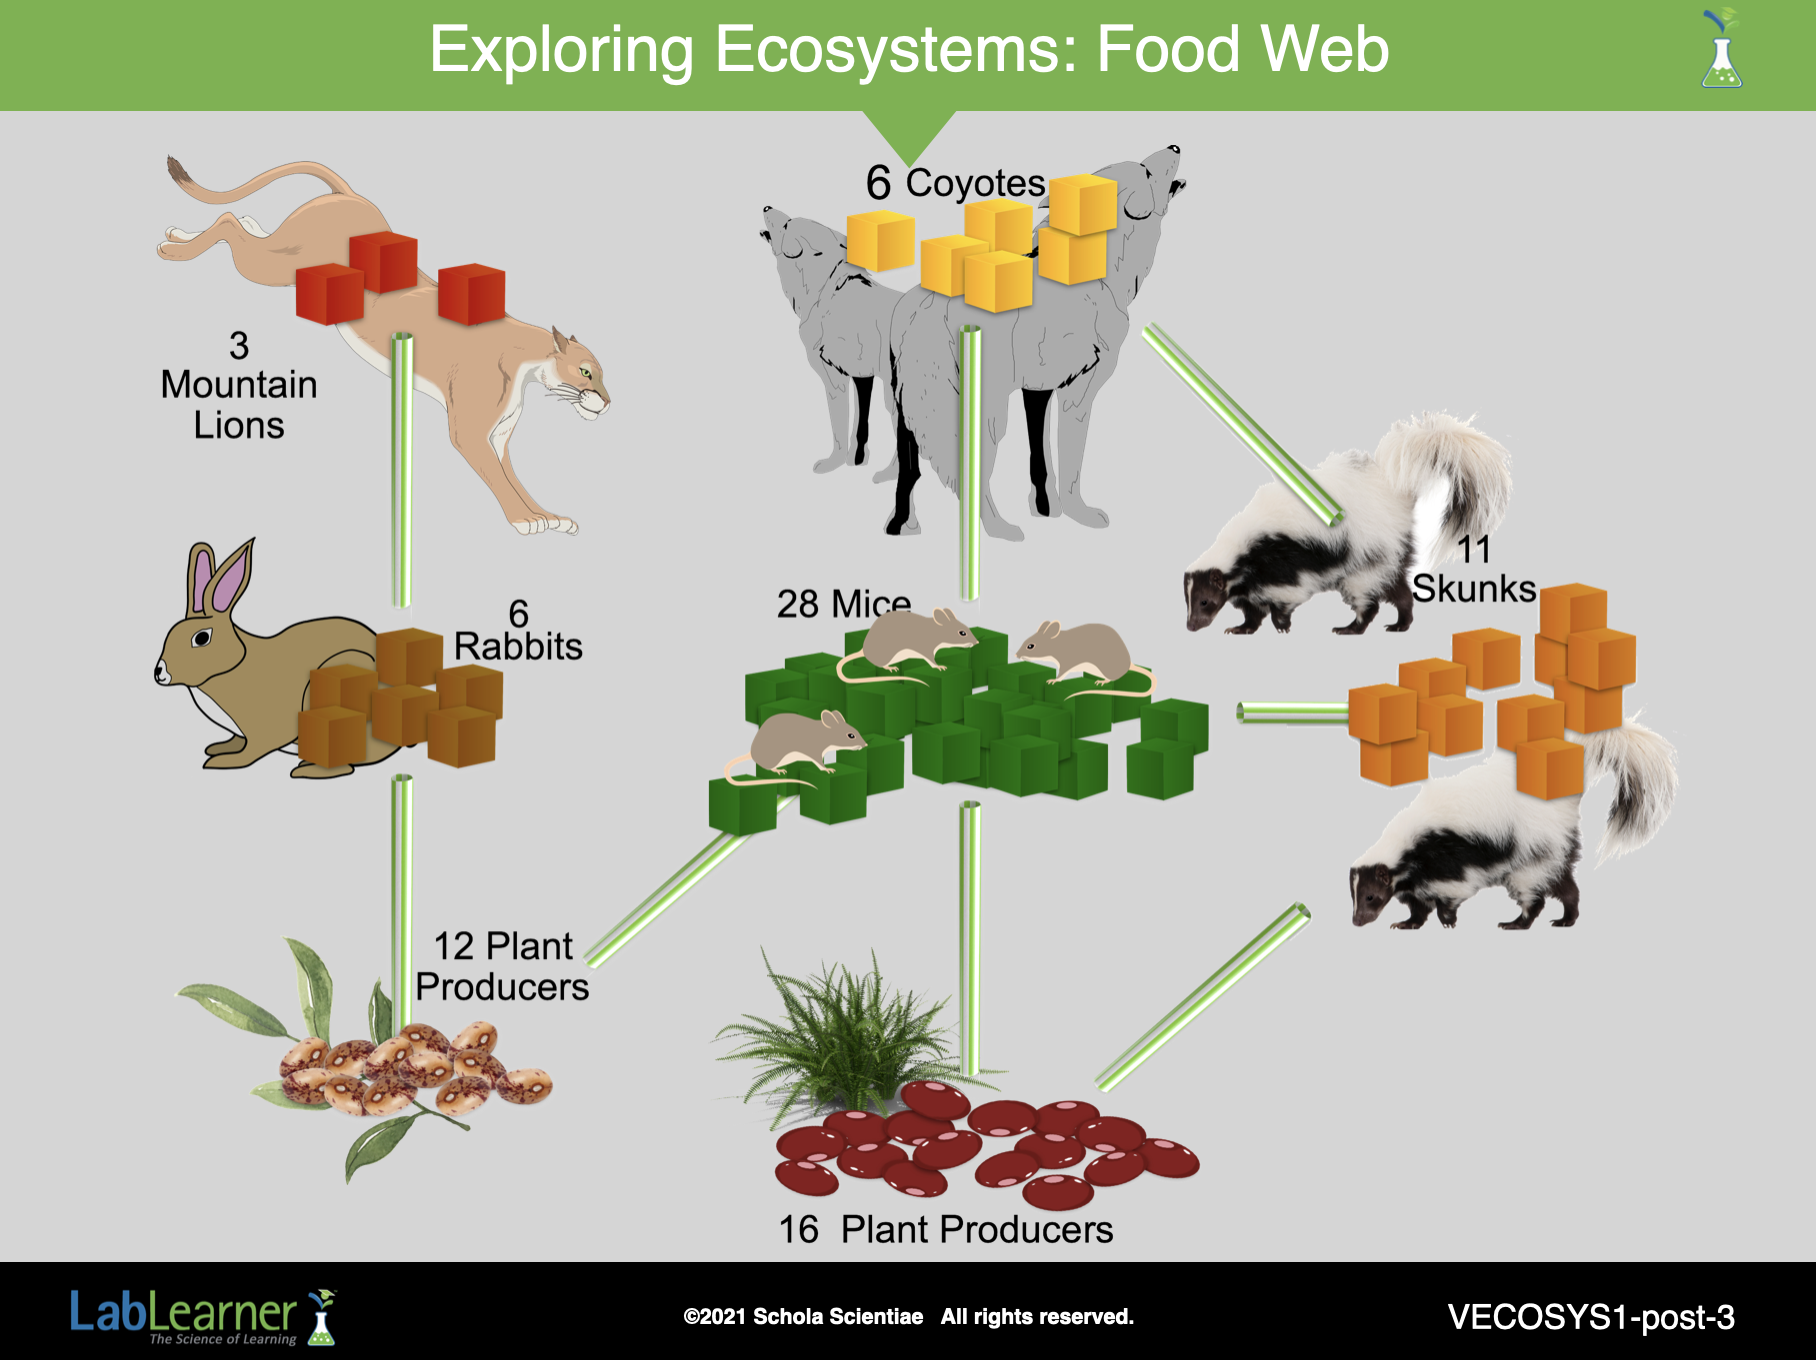
SLIDE VECOSYS1-post-3
B. Review the models and what each represented in order to help students understand the interactions of organisms in ecosystems. Use the following problems to aid in initiating student discussion. Students may wish to refer to the Scientist’s Glossary and the Scientist Data Record during the discussion.
1. Ask students: What are producers? How did you represent producers in the model food chains? Producers are organisms that make their own food, such as plants. In the Trial 1 food chain, the producers were represented by pinto beans. In the Trial 2 food chain, the producers were represented by kidney beans.
2. Ask students: What are herbivores? How were herbivores represented in the model food chains? Herbivores are organisms that eat only plants. The rabbits were represented by brown gram cubes and the mice were represented by green gram cubes in the food chain models.
3. Ask students: What are carnivores? How were carnivores represented in the food chains? Carnivores are organisms that eat animals. Mountain lions were represented by red gram cubes and coyotes were represented by yellow gram cubes in the food chain models.
4. Ask students: What are omnivores? How were omnivores represented in the food chains? Omnivores are organisms that eat both plants and animals. Skunks were represented by orange cubes in the Trial 2 food chain.
5. Ask students: How did you determine how many organisms the ecosystem could support? Students determined how many of each type of organism the ecosystem could support mathematically. Students used the amount of food biomass available for each type of organism and divided it by the amount of food each individual organism needed to survive. This yielded the number of each organism that could be supported by the available food supply.
6. Ask students: The drought was a change in the environment. How did the drought affect the food chains? Were both food chains affected? Explain. The drought was an extended period of time without sufficient rainfall, and it caused all of the pinto beans (producers) to die. This only affected the Trial 1 food chain because none of the organisms in the Trial 2 food chain needed pinto beans for food.
______________________________________________
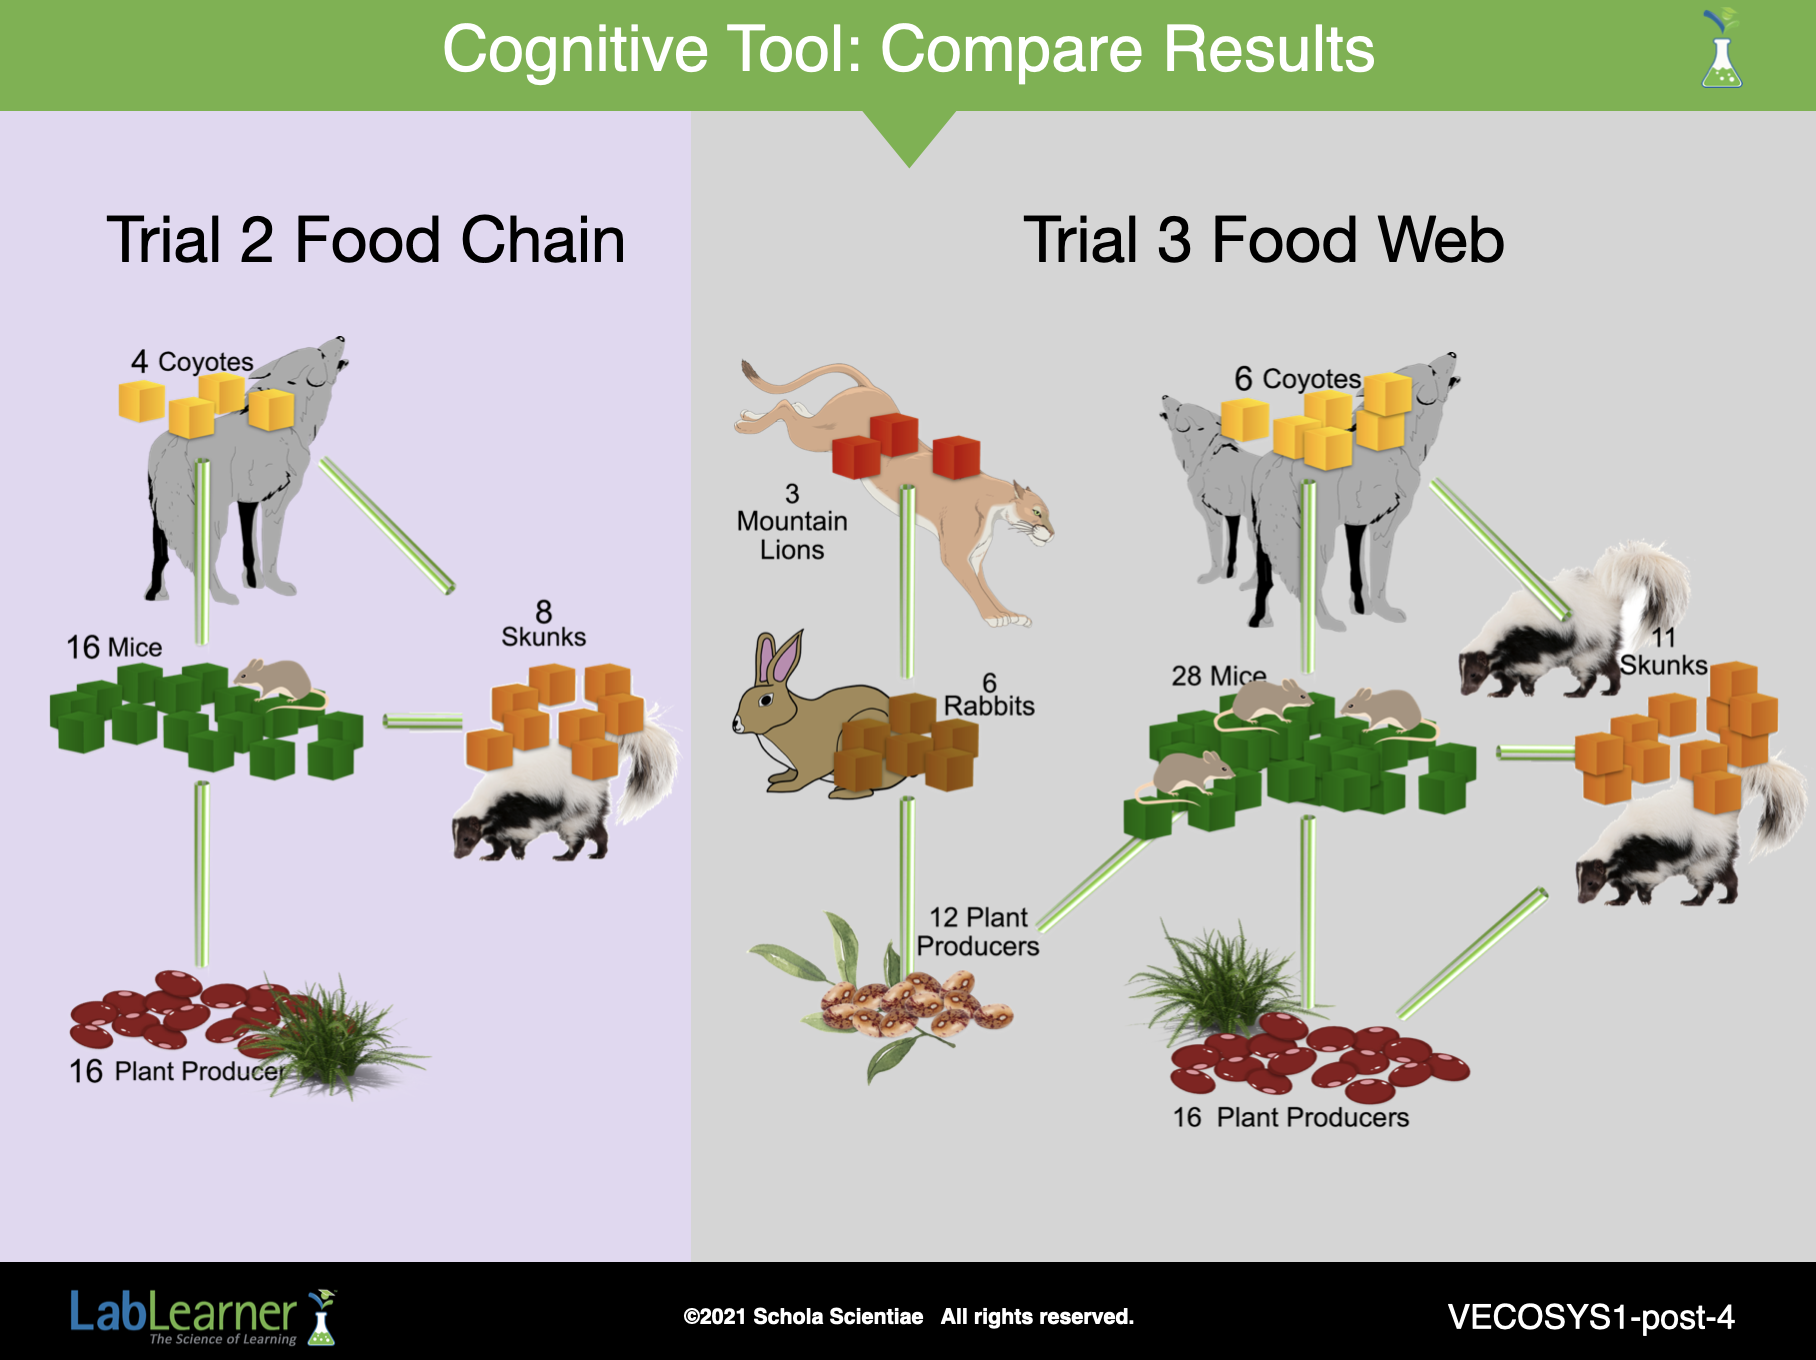
SLIDE VECOSYS1-post-4
C. Read Problem 10 in the Student Data Record or ask for a student volunteer to read the problem aloud.
- Introduce the Cognitive Tool, Compare Results.
2. Students should record their Compare Results answers in Problem 10 of their Student Data Records.
______________________________________________
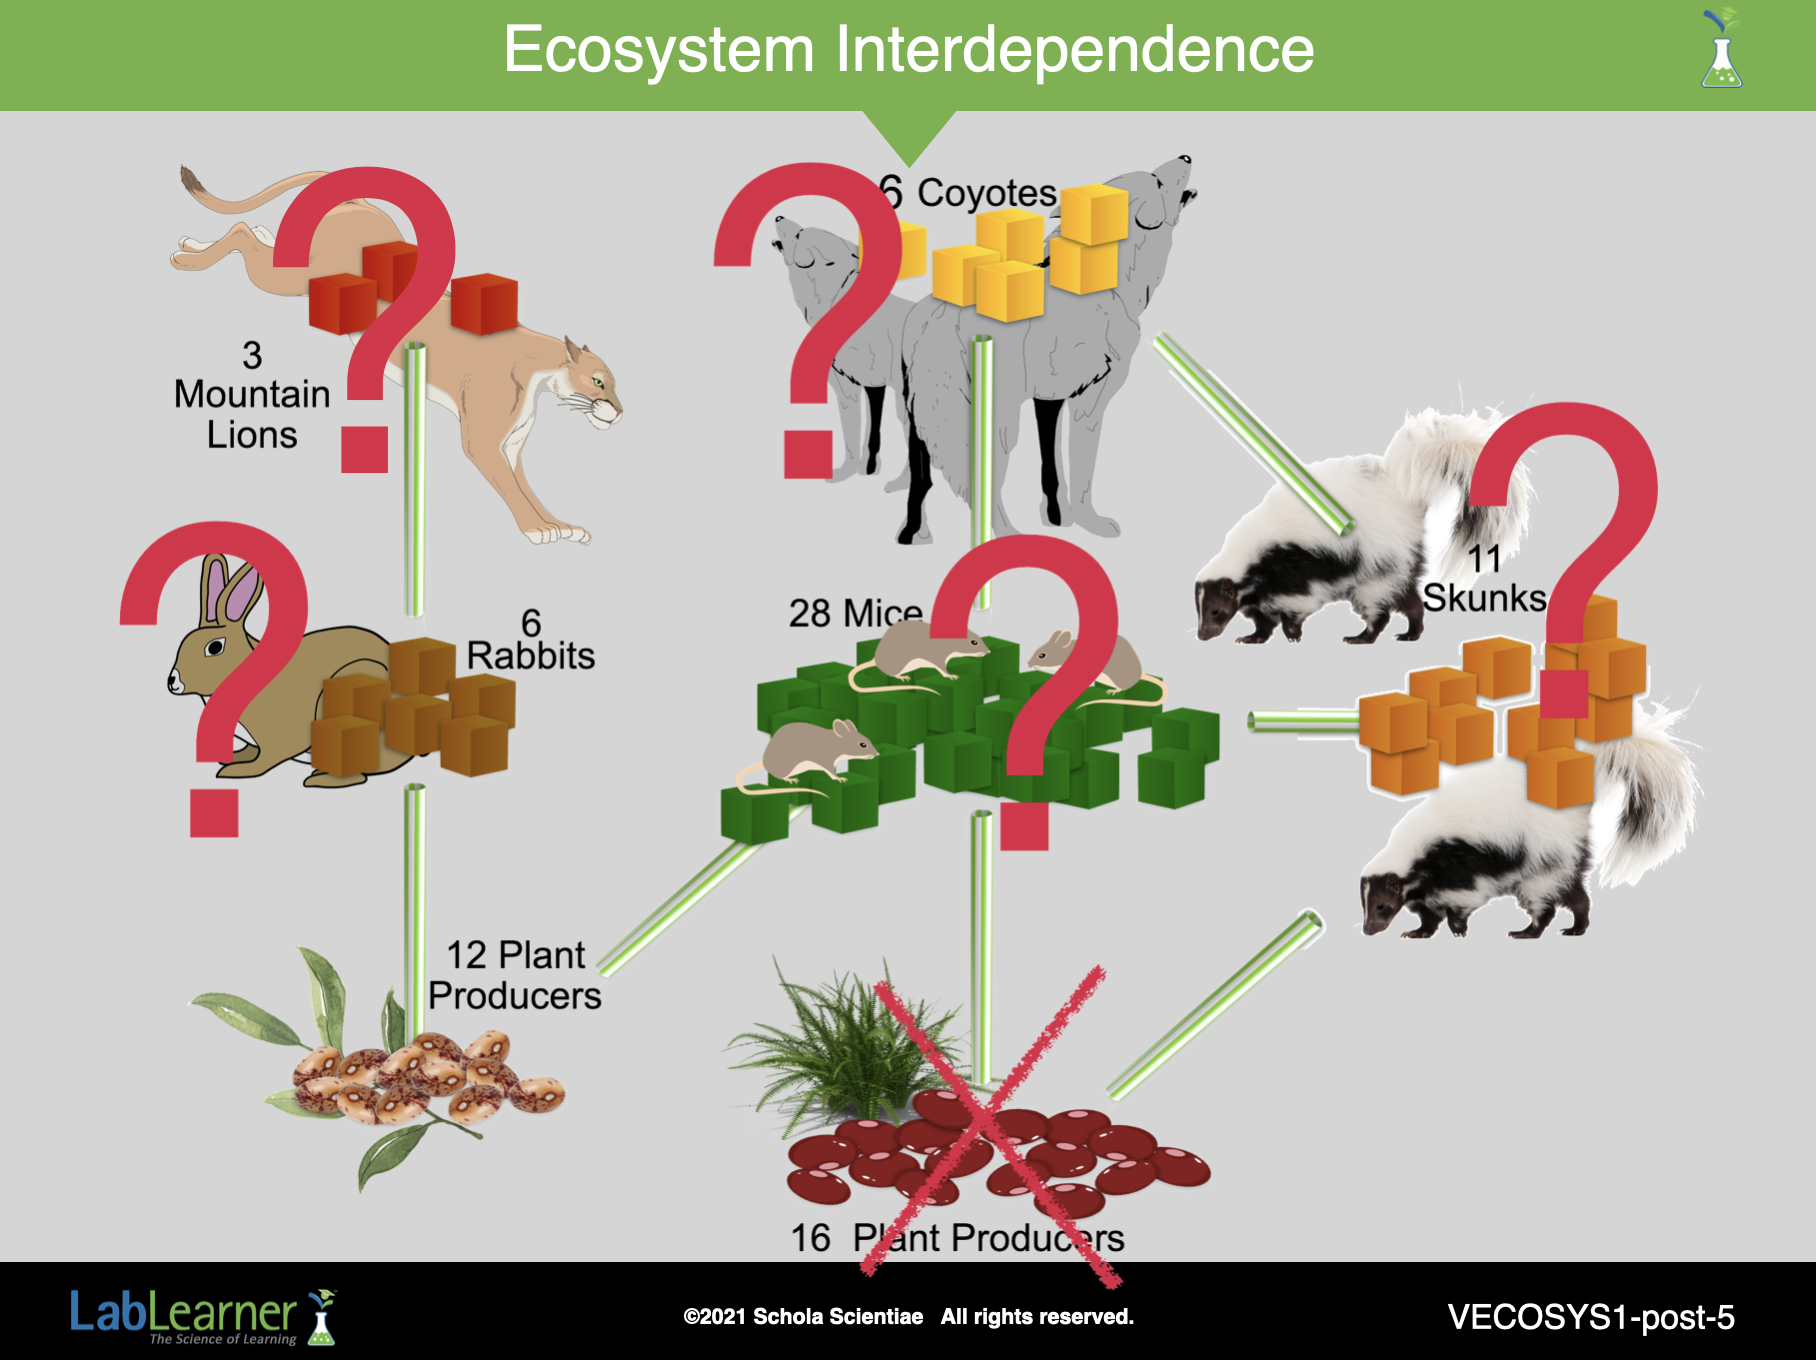
SLIDE VECOSYS1-post-5
D. Explain the concept of interdependence to the students:
Interdependence is the relationship among organisms in a food web. Any change in one organism affects the other organisms.
1. Ask students to refer to the diagram of the food web in Problem 9j of the Student Data Record.
2. Tell students that a plant disease kills all of the kidney beans. Point out to students that this is similar to the drought in the Lab portion of the core experience, however this time the environmental change impacts more than a single food chain because of the increased interdependence of the organisms on each other in the food web.
Direct students to answer Problems 11a-f in the Student Data Record:
a. Ask students: How does the plant disease affect the food supply for the mouse population? The plant disease removes part of the available food for the mouse population. The mice can still use pinto beans for food.
b. Ask students: Do the mice compete with any other organisms for the food that is left in the ecosystem? Yes, the mice compete with the rabbits for the pinto beans.
c. Tell students that each mouse needs 1 gram of pinto beans and each rabbit needs 2 grams of pinto beans to survive.
Ask students: Are there enough pinto beans to support all of the rabbits and mice in the food web? No, there are not enough pinto beans to support both the entire mouse and rabbit populations.
d. Ask students: How does the loss of kidney beans affect the mouse population in the food web? Student answers may vary. The only food now available to the mice is pinto beans. This is not enough food to support all of the rabbits and all of the mice, so one or both populations will suffer. The mouse population will decline if the mice cannot successfully compete with the rabbits for food.
e. Ask students: How does the loss of kidney beans affect the rabbit population in the food web? Student answers may vary. There are not enough pinto beans to support both the rabbit population and the mouse population, so one or both populations will suffer. The rabbit population will decline if the rabbits cannot successfully compete with the mice for food.
f. Ask students: How does the loss of kidney beans affect the skunk and coyote population? Student answers may vary. The skunks no longer have kidney beans for food, but they can eat more mice to survive. If the mouse population begins to decline due to the loss of kidney beans, the population of skunks will decrease. The coyotes eat both skunks and mice. However, both the skunk and mouse populations are affected by the loss of kidney beans and may begin to decline. If the decline in both populations is great enough, there may not be enough mice and skunks to support the coyote population.
3. Ask students: How did the effects of the plant disease show the interdependence of organisms in the food web? The plant disease didn’t just affect the kidney beans, it also affected the mouse, skunk, and coyote populations. The mice and skunks both lost part of their food source. The loss of kidney beans even had an effect on organisms that did not eat kidney beans. Because the mice had less food, the population decreased. This meant there was less food for skunks and the coyotes that depended on the mice for food. Because the mice were forced to eat just pinto beans, they competed with the rabbits for food. Thus less food was available for the rabbits and for the mountain lions that depended on the rabbits for food. A change in one organism (kidney beans) affected many other organisms. Thus interdependence of all of the organisms in the food web is demonstrated.
______________________________________________
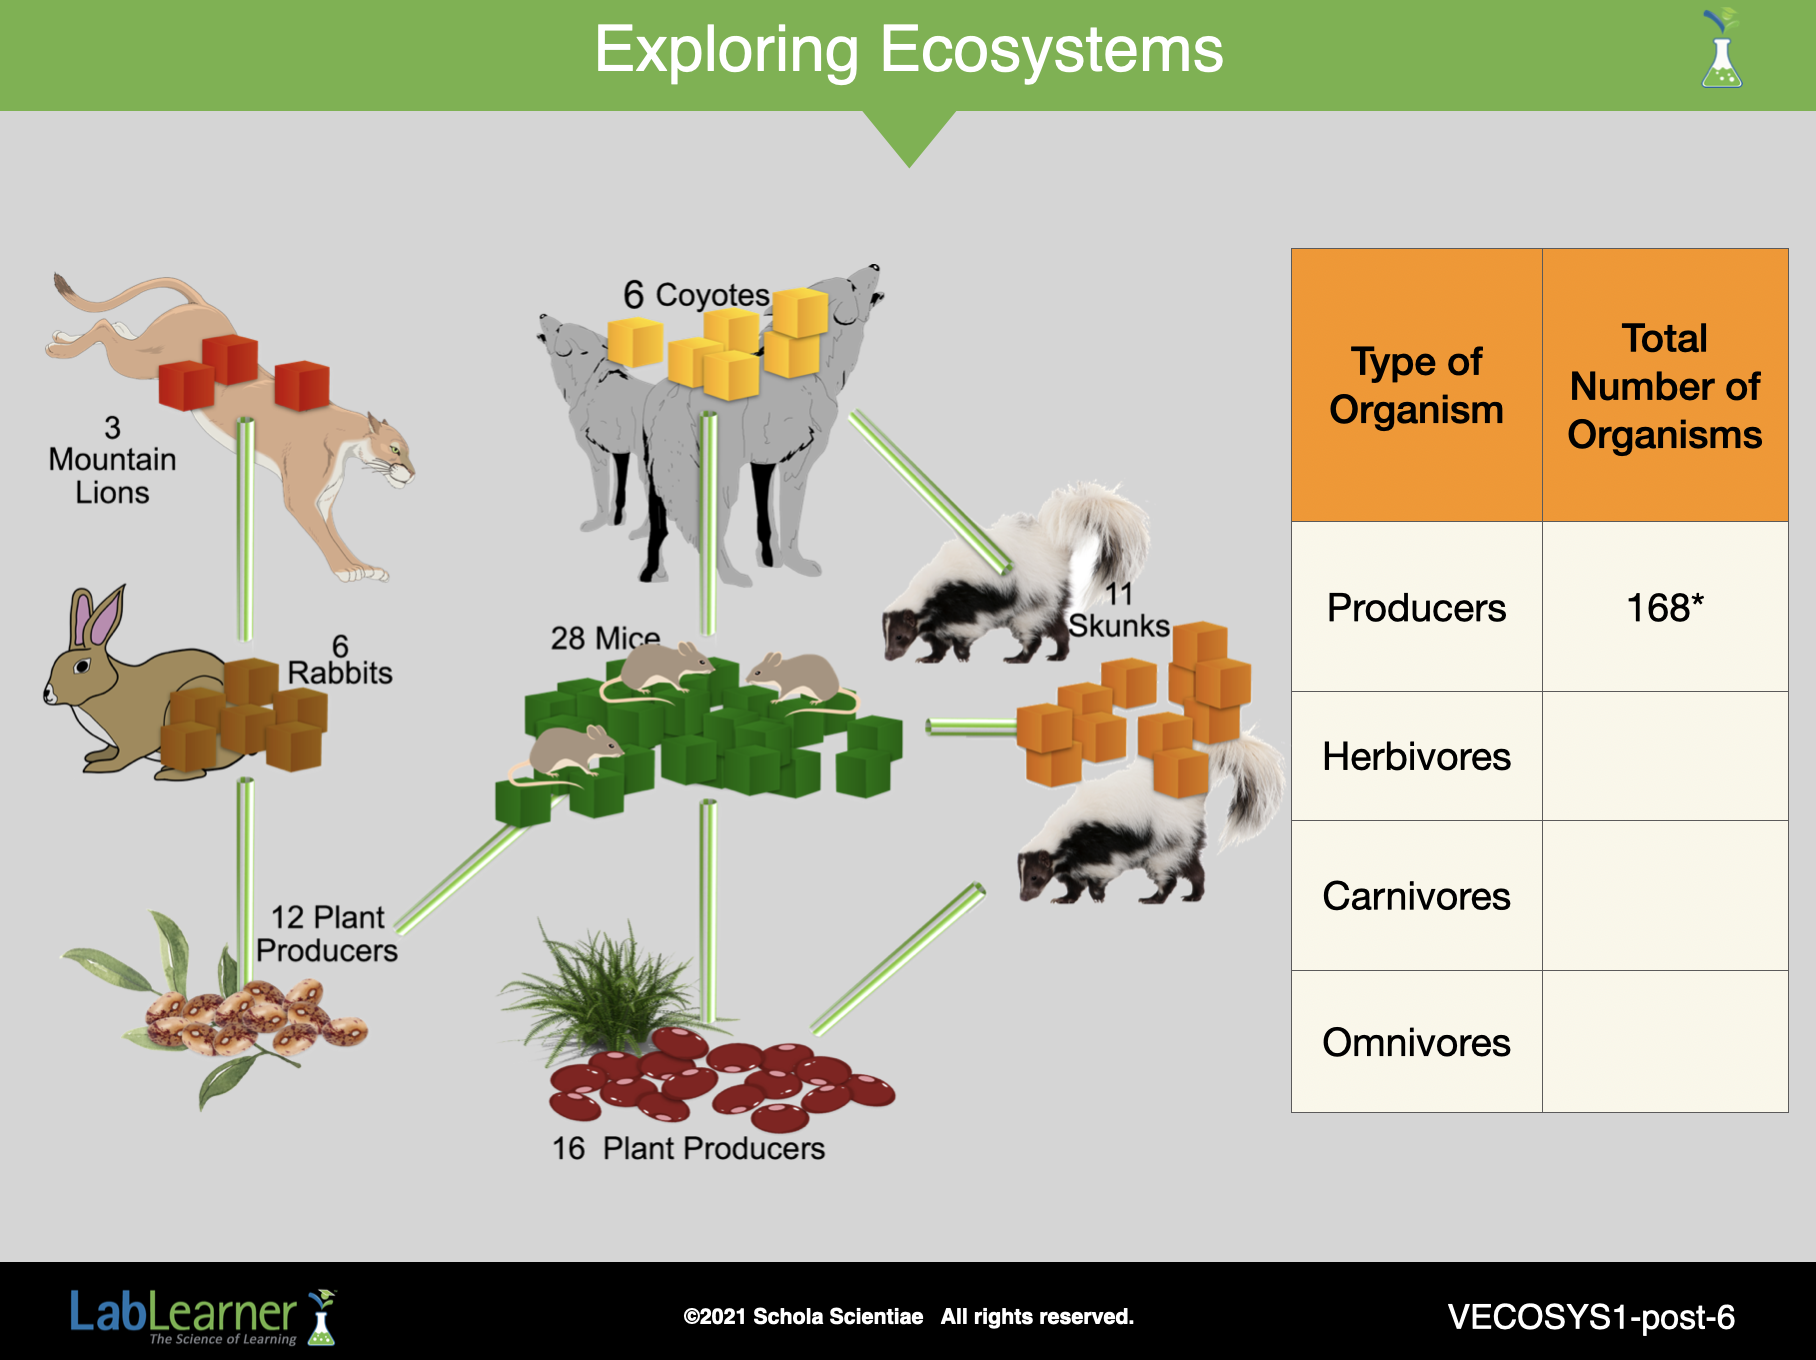
SLIDE VECOSYS1-post-6
E. Direct students to use the information from the food web to complete the data table in Problem 12. If necessary, support student reasoning through the calculations by completing the table as a class.
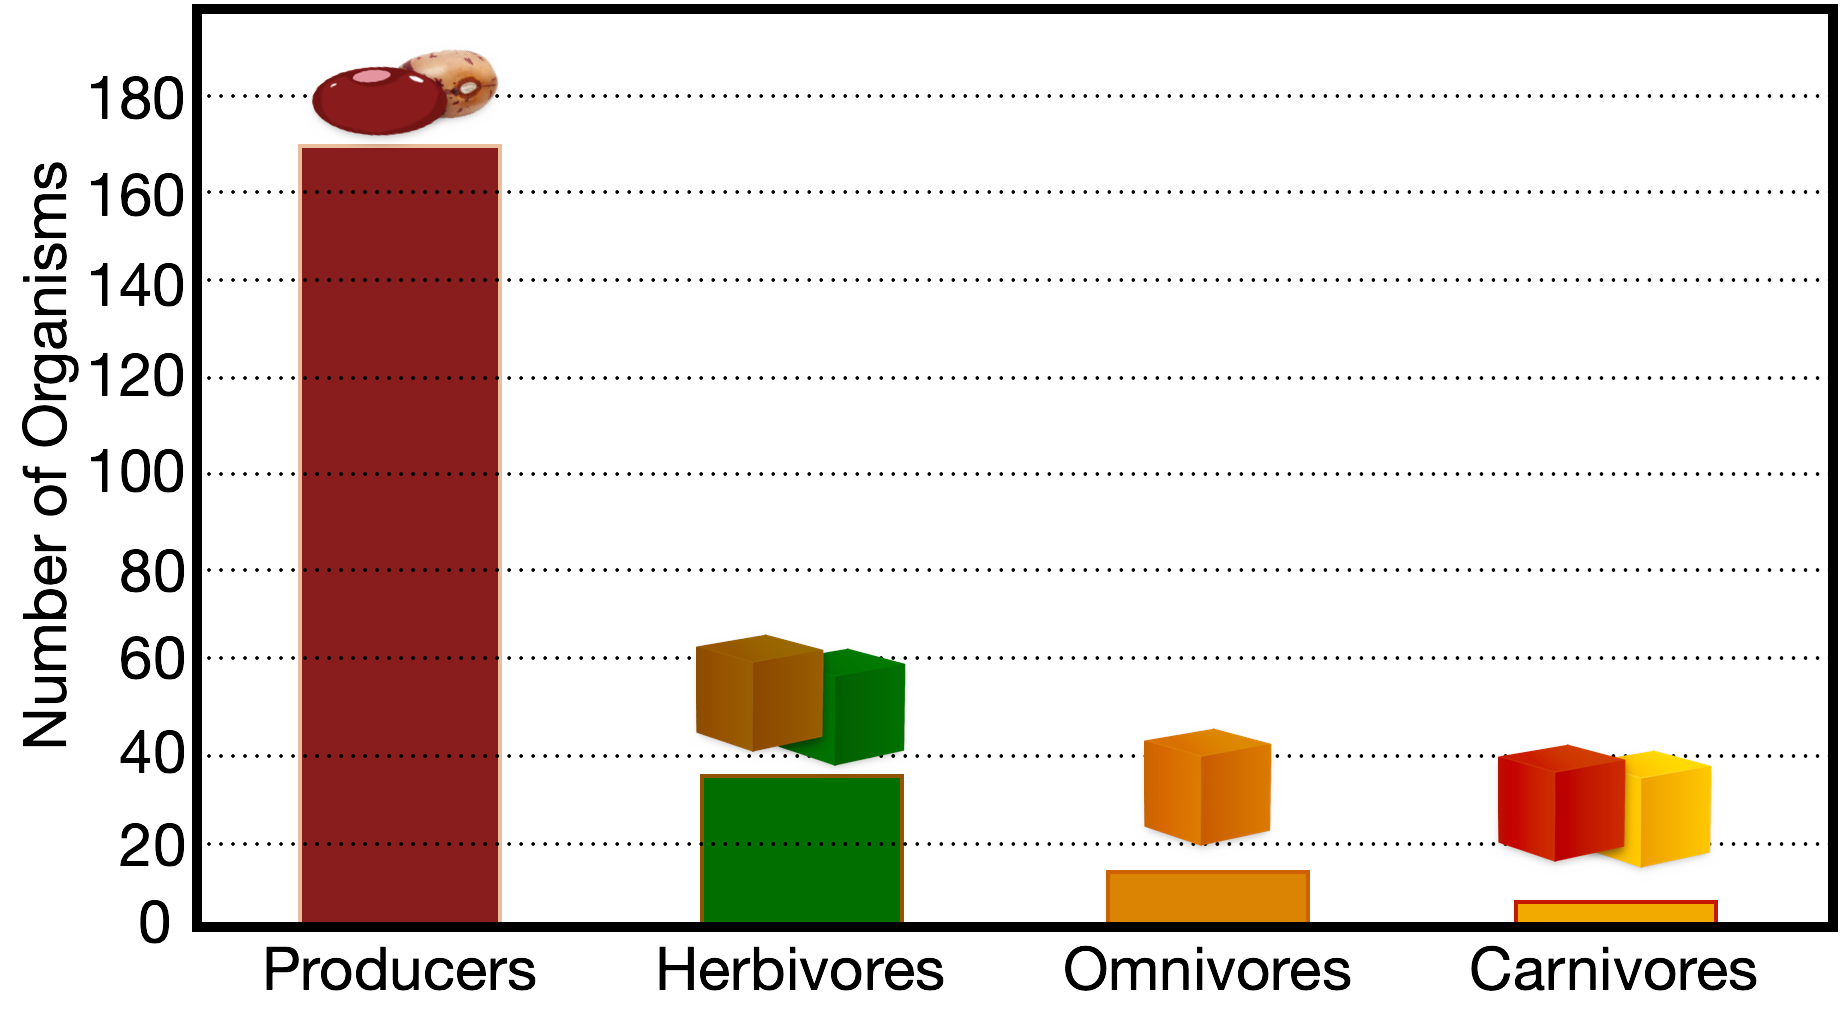
*Note: Provide the value for the number of producers to the students. It assumes that each gram of kidney bean or pinto bean mass represents 6 total plants. Producers make up the greatest number of organisms in an ecosystem because a large biomass is needed to support higher levels of the food chain.
______________________________________________
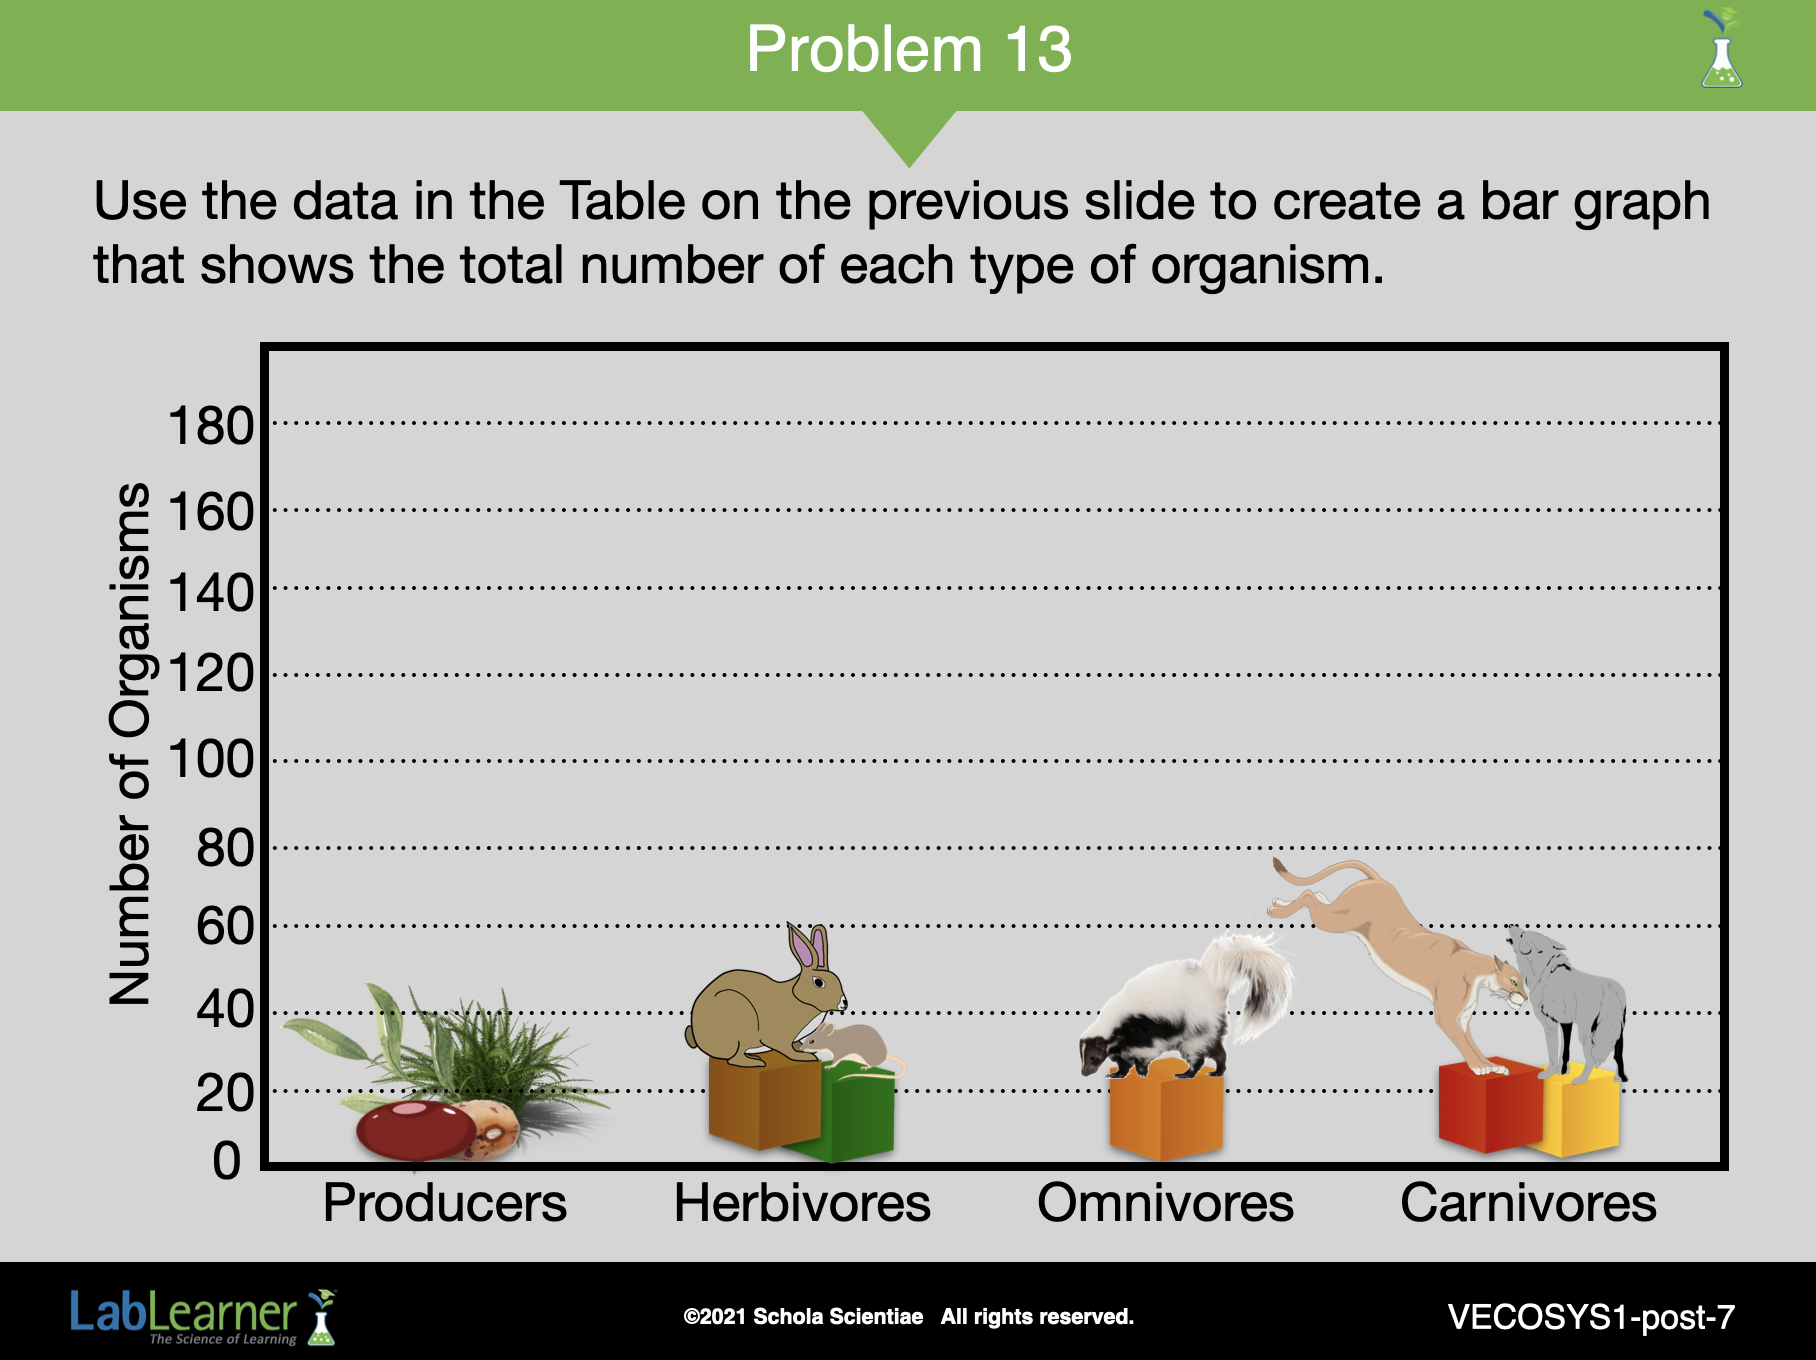
SLIDE VECOSYS1-post-7
F. Ask students: How could you arrange the data to compare the number of each different type of organism in the ecosystem food web? Student answers may vary. Guide students toward realizing that a bar graph can be used to show this information.
1. Ask students to use the data in the Table from Problem 12 to create the bar graph.
2. Creation and Completion of a Bar Graph is a previously used tool from the Procedural Toolbox. Students may refer to the Procedural Toolbox as they create their graph, but it may be necessary to remind students of what they should consider when creating the bar graph. The following information is a list of the steps students should consider:
a. Make an x and y axis. The x-axis is the horizontal axis and the y- axis is the vertical axis.
b. Evaluate the data. Determine which variable you will plot along each axis. When plotting values of different categories, scientists typically place the category on the x-axis, and the values on the y-axis.
c. Label each axis.
d. Determine the beginning and ending numbers you will plot on the x-axis and y-axis. The beginning and ending numbers should be selected so that you can plot all of the points on the graph.
e. Determine the scale for each axis. A scale is a difference between numbers. For example, you may wish to include all numbers between your beginning and ending numbers. You could also create a scale that only uses some numbers that are multiples of each other.
f. Graph the data.
______________________________________________
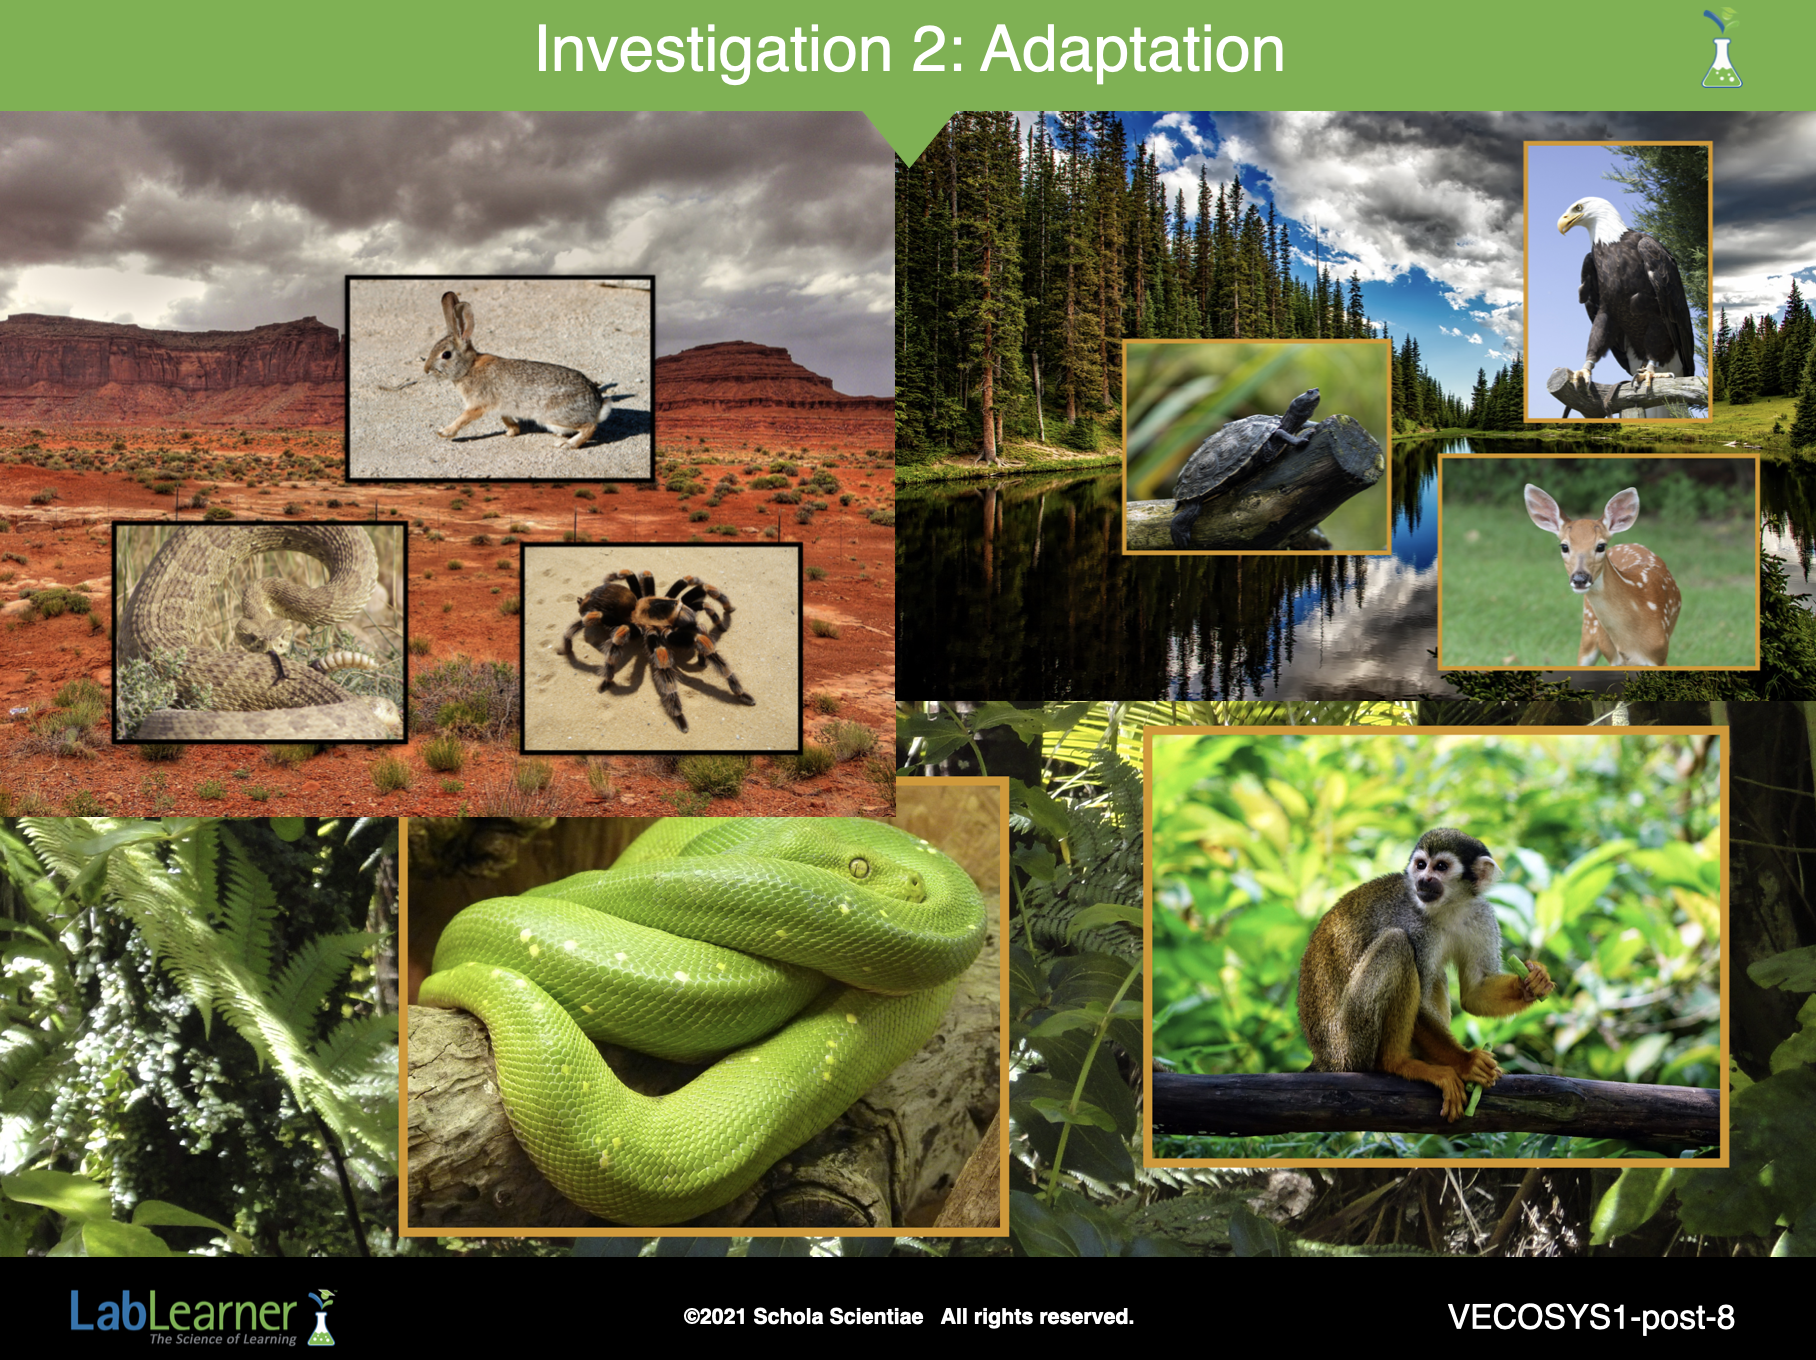
SLIDE VECOSYS1-post-8
- To complete this Investigation, tell students they will continue to study ecosystems and how the environment affects the types of organisms that live in ecosystems in Investigation Two: Adaptation.
KEYS: POSTLAB