Teacher Portal:
Exploring Density
Investigation 2 – PostLab
 PRINT IT
Use your browser to download a printable PDF as help during the slide presentation and to make additional notes. In your browser, go to File > Print and then choose to save as PDF.
NAVIGATE IT
Once the slide presentation is launched
- use your left and right arrows to advance or go back in the slide presentation, and
- hover your mouse over the left edge of the presentation to get a view of the thumbnails for all the slides so that you can quickly move anywhere in the presentation.
- Click HERE to launch the slide presentation for the CELL.
SHARE IT
SLIDE VDEN2-post-1
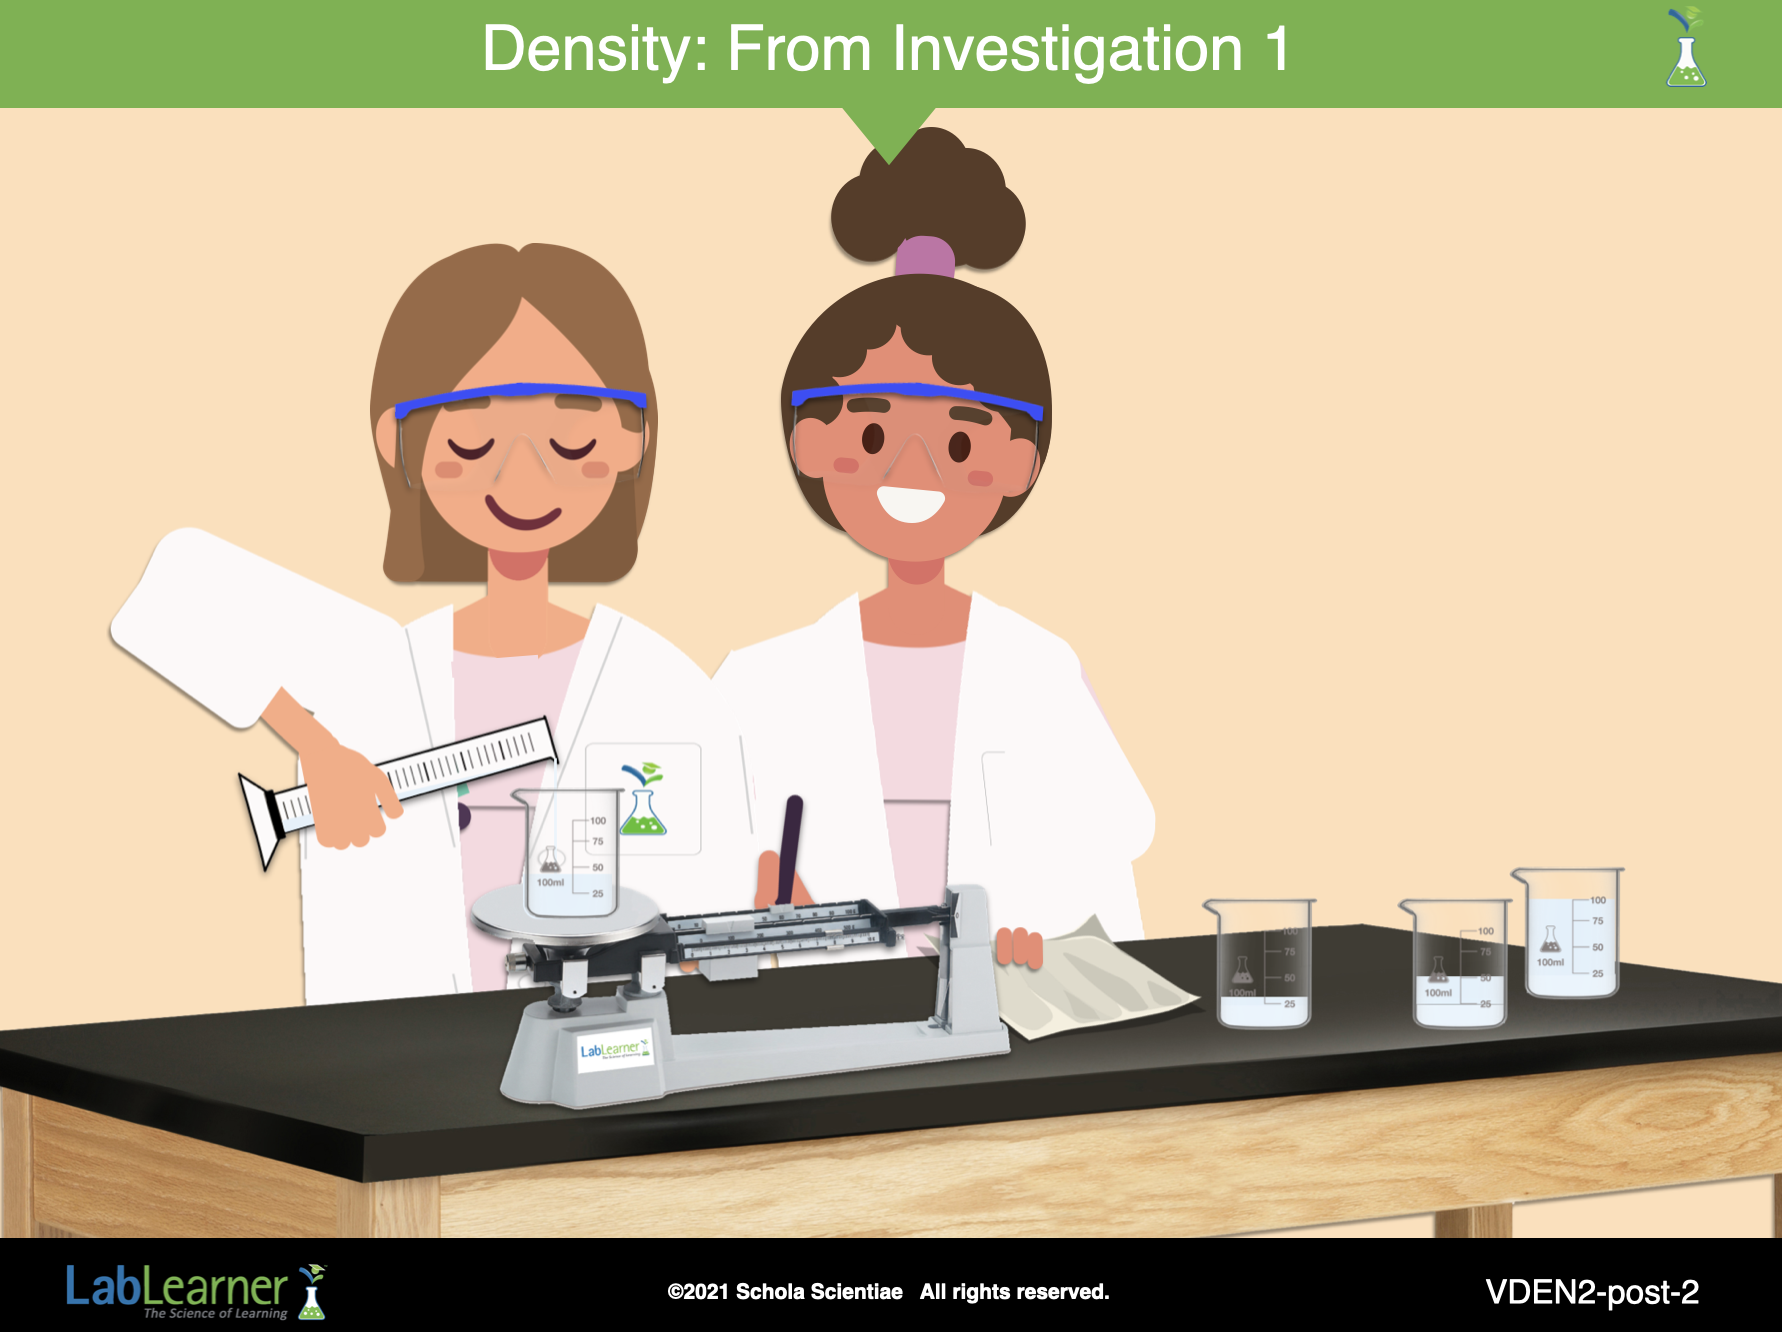
This is the second Investigation of the LabLearner CELL Density. In this Investigation, students determined the mass and volume of various samples of water and calculate water’s density.
______________________________________________
SLIDE VDEN2-post-2
A. Begin this part of the Investigation by asking students to summarize the Investigation.
1. Ask students: What types of data did you collect in the Lab? Students should indicate that they determined the masses and volumes of the three samples of water.
2. Ask students: What calculations did you perform using the data? Students should indicate that they calculated the density of the three samples of water by using the measurements for the volume and mass for each sample.
3. Ask students: What property of the samples did your calculations give you? Why is this property considered to be a derived property? Students should indicate that they determined the densities of the three samples of water. The densities are considered derived properties because they were not measured directly with any one piece of equipment. Rather, they were calculated using two other measured properties: mass and volume.
4. Ask students: What is the formula for calculating density? Students should indicate that the formula for calculating density is, density = mass/volume.
______________________________________________
SLIDE VDEN2-post-3
B. Continue the discussion by analyzing the data.
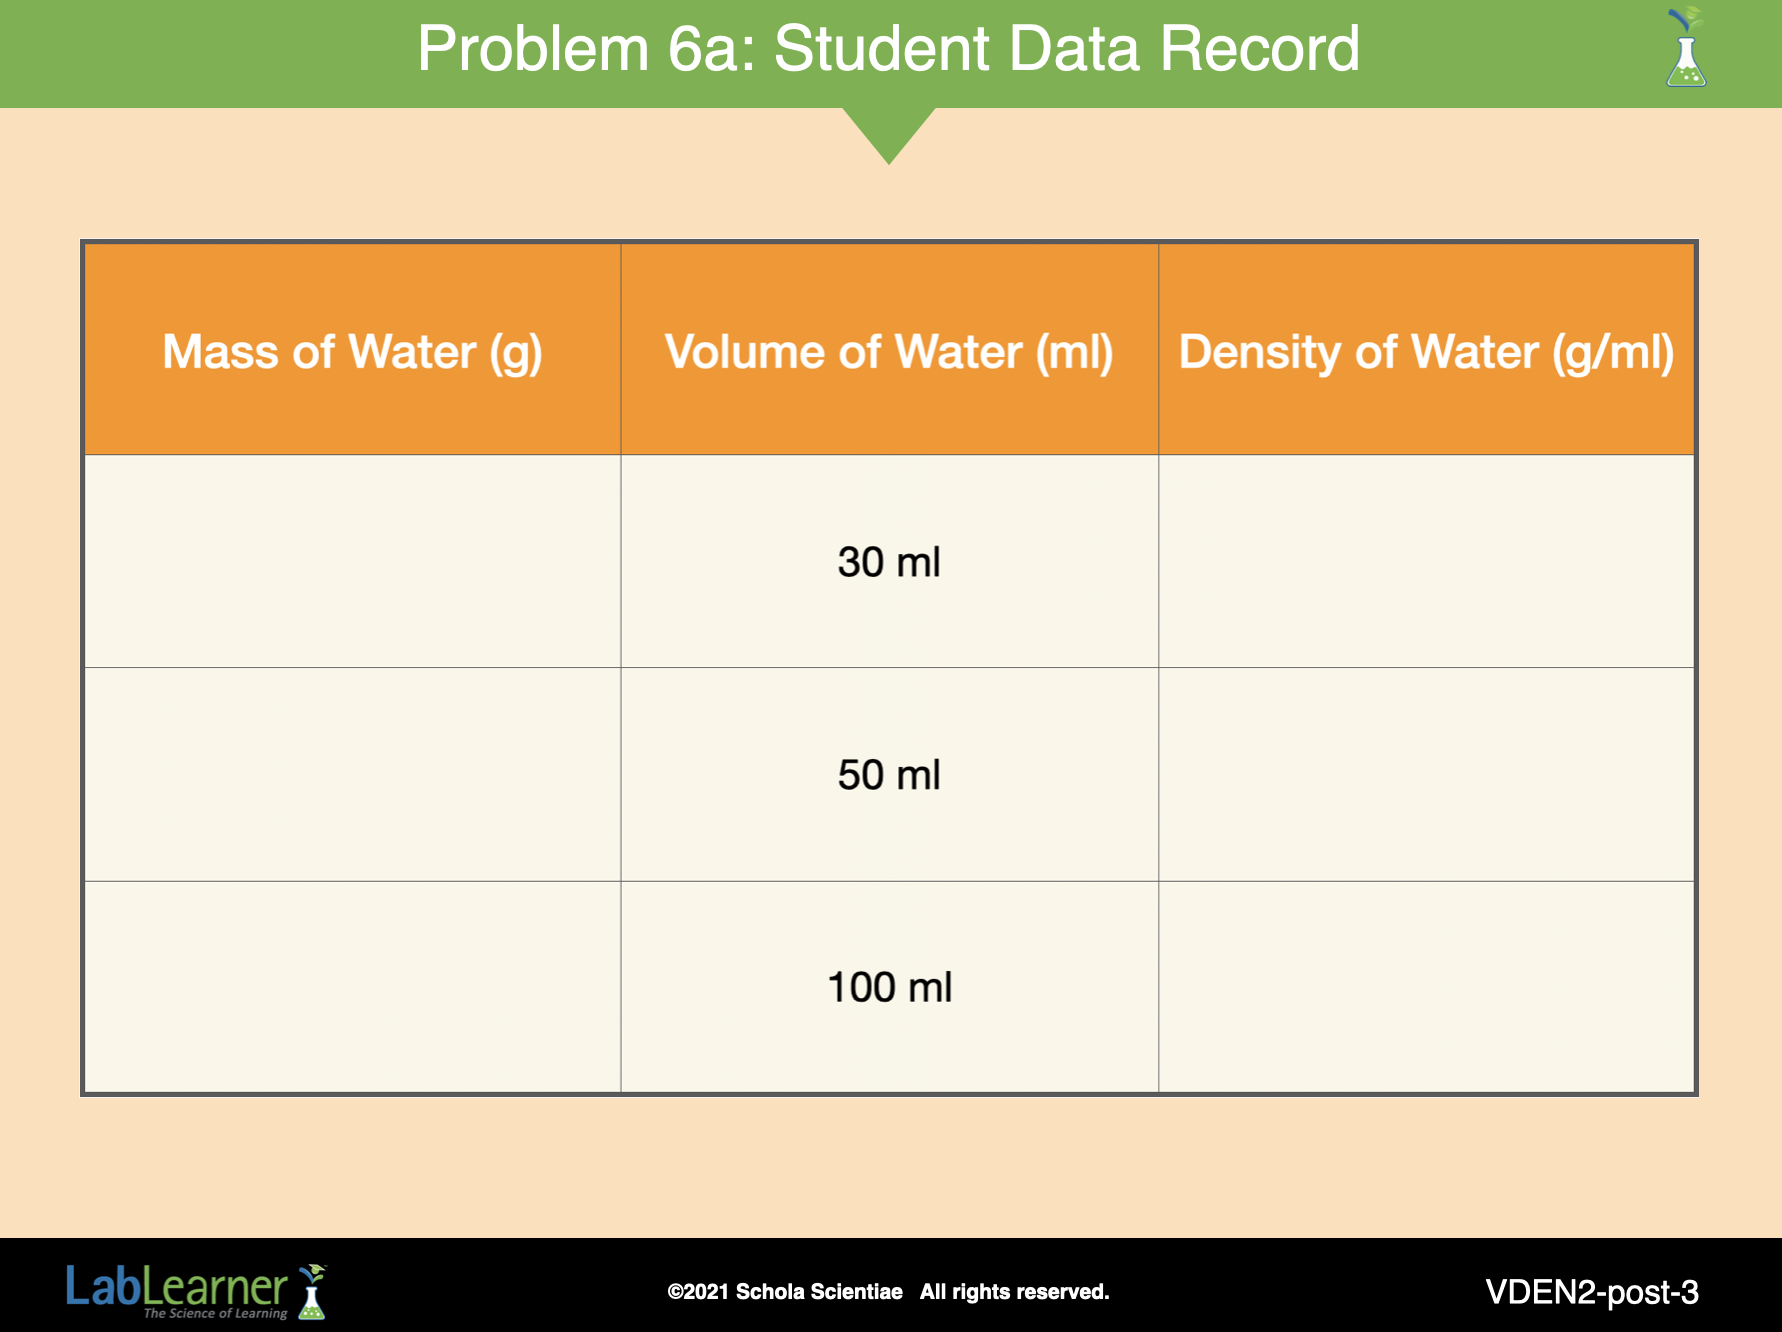
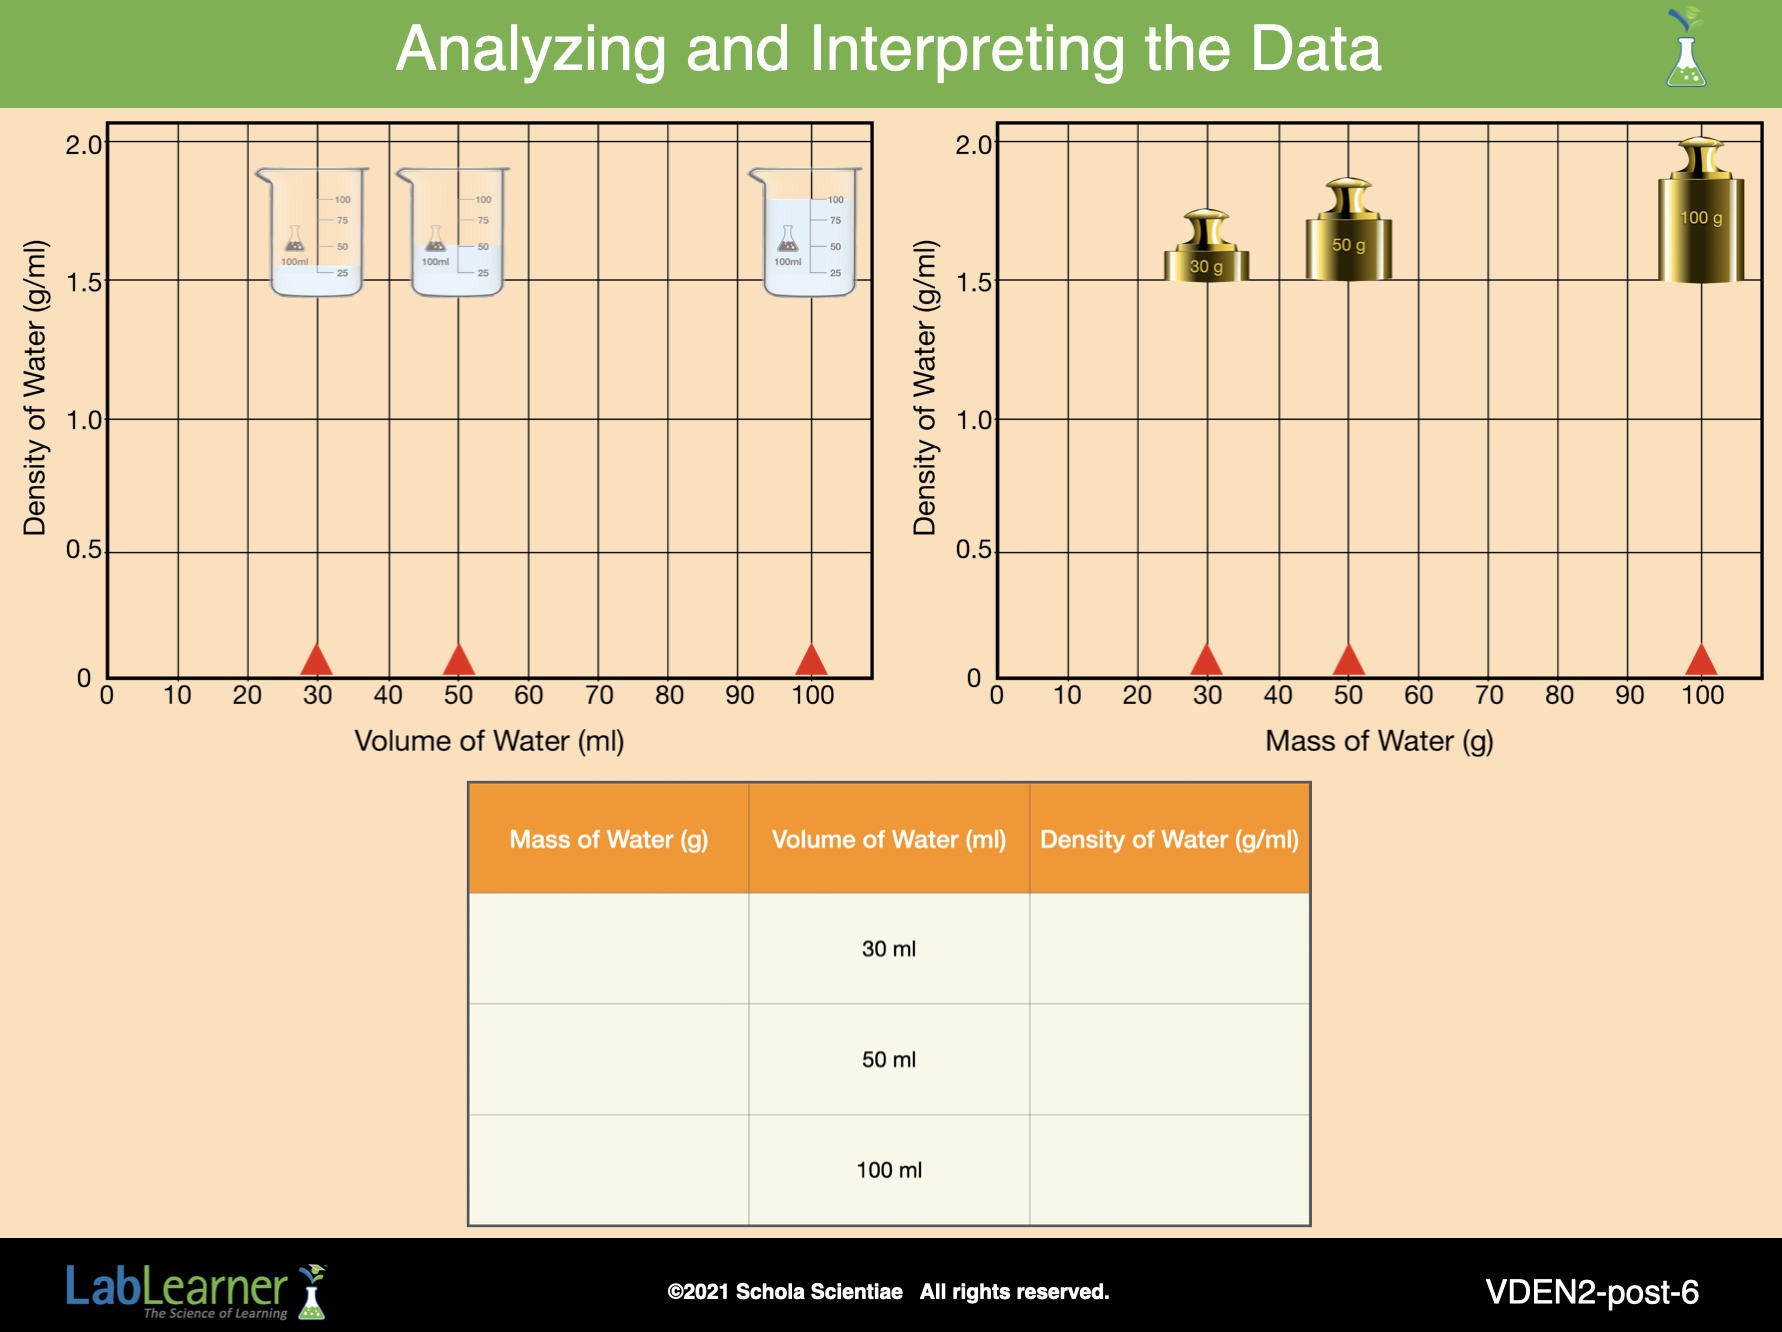
1. Divide students into 5 cooperative groups and direct students’ attention to the results of their experiment in Problems 3-5 of their Student Data Record.
2. Instruct students to compile their data by completing the Data Table in Problem 6a of their Student Data Record. Provide sufficient time for students to organize their data.
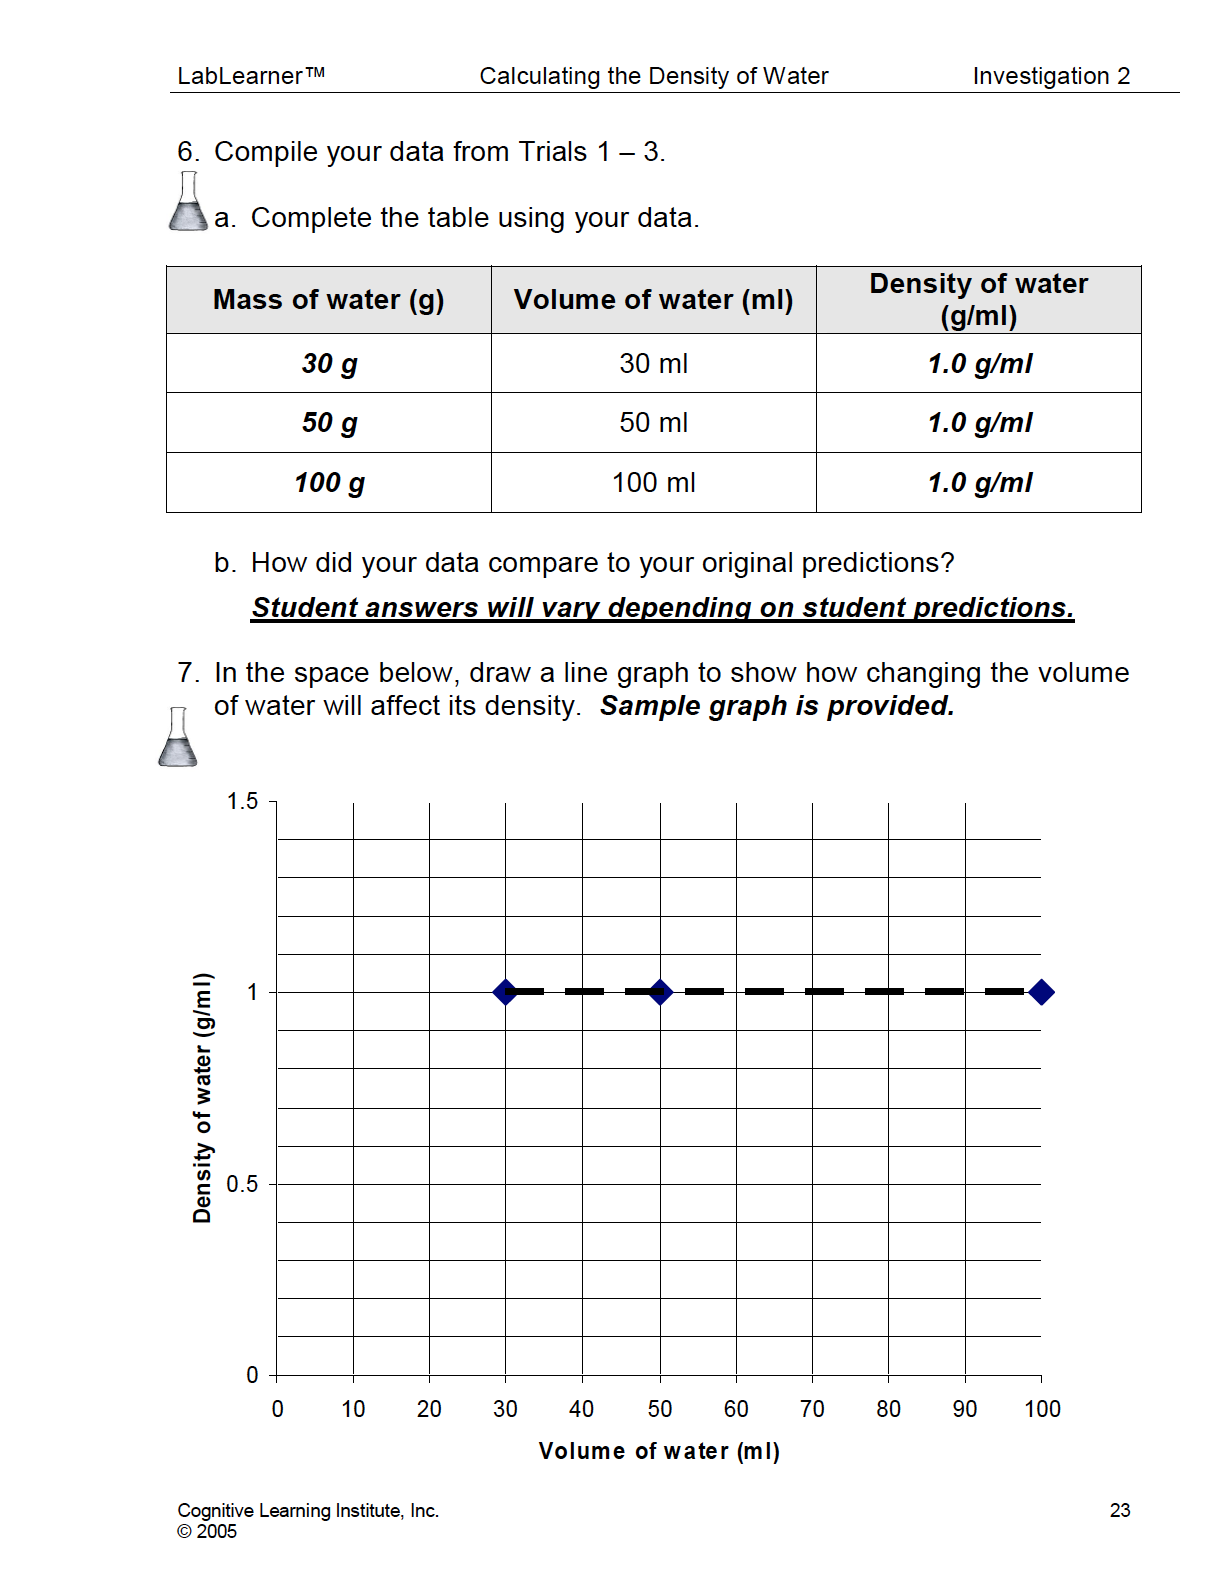
3. Begin analysis of the Data Table. Ask students: Based on your data, what was the density of each of the three samples of water? Students should indicate that the density of water of each of the samples was approximately 1g/ml.
4. Ask students: Did the density of water change when the size of the water sample changed? The density did not change when the volume or the mass of the water changed.
Note to Teacher: Although students may see small variations in the densities for each of the samples, these differences are considered within the margin of experimental error.
5. Ask students: Were the densities that you calculated for the three samples of water exactly the same? Student answers will vary.
6. Ask students: How did your data compare to your original predictions? Student answers will vary depending on student predictions.
Encourage students to record their answers in Problem 6b of their Student Data Record.
______________________________________________
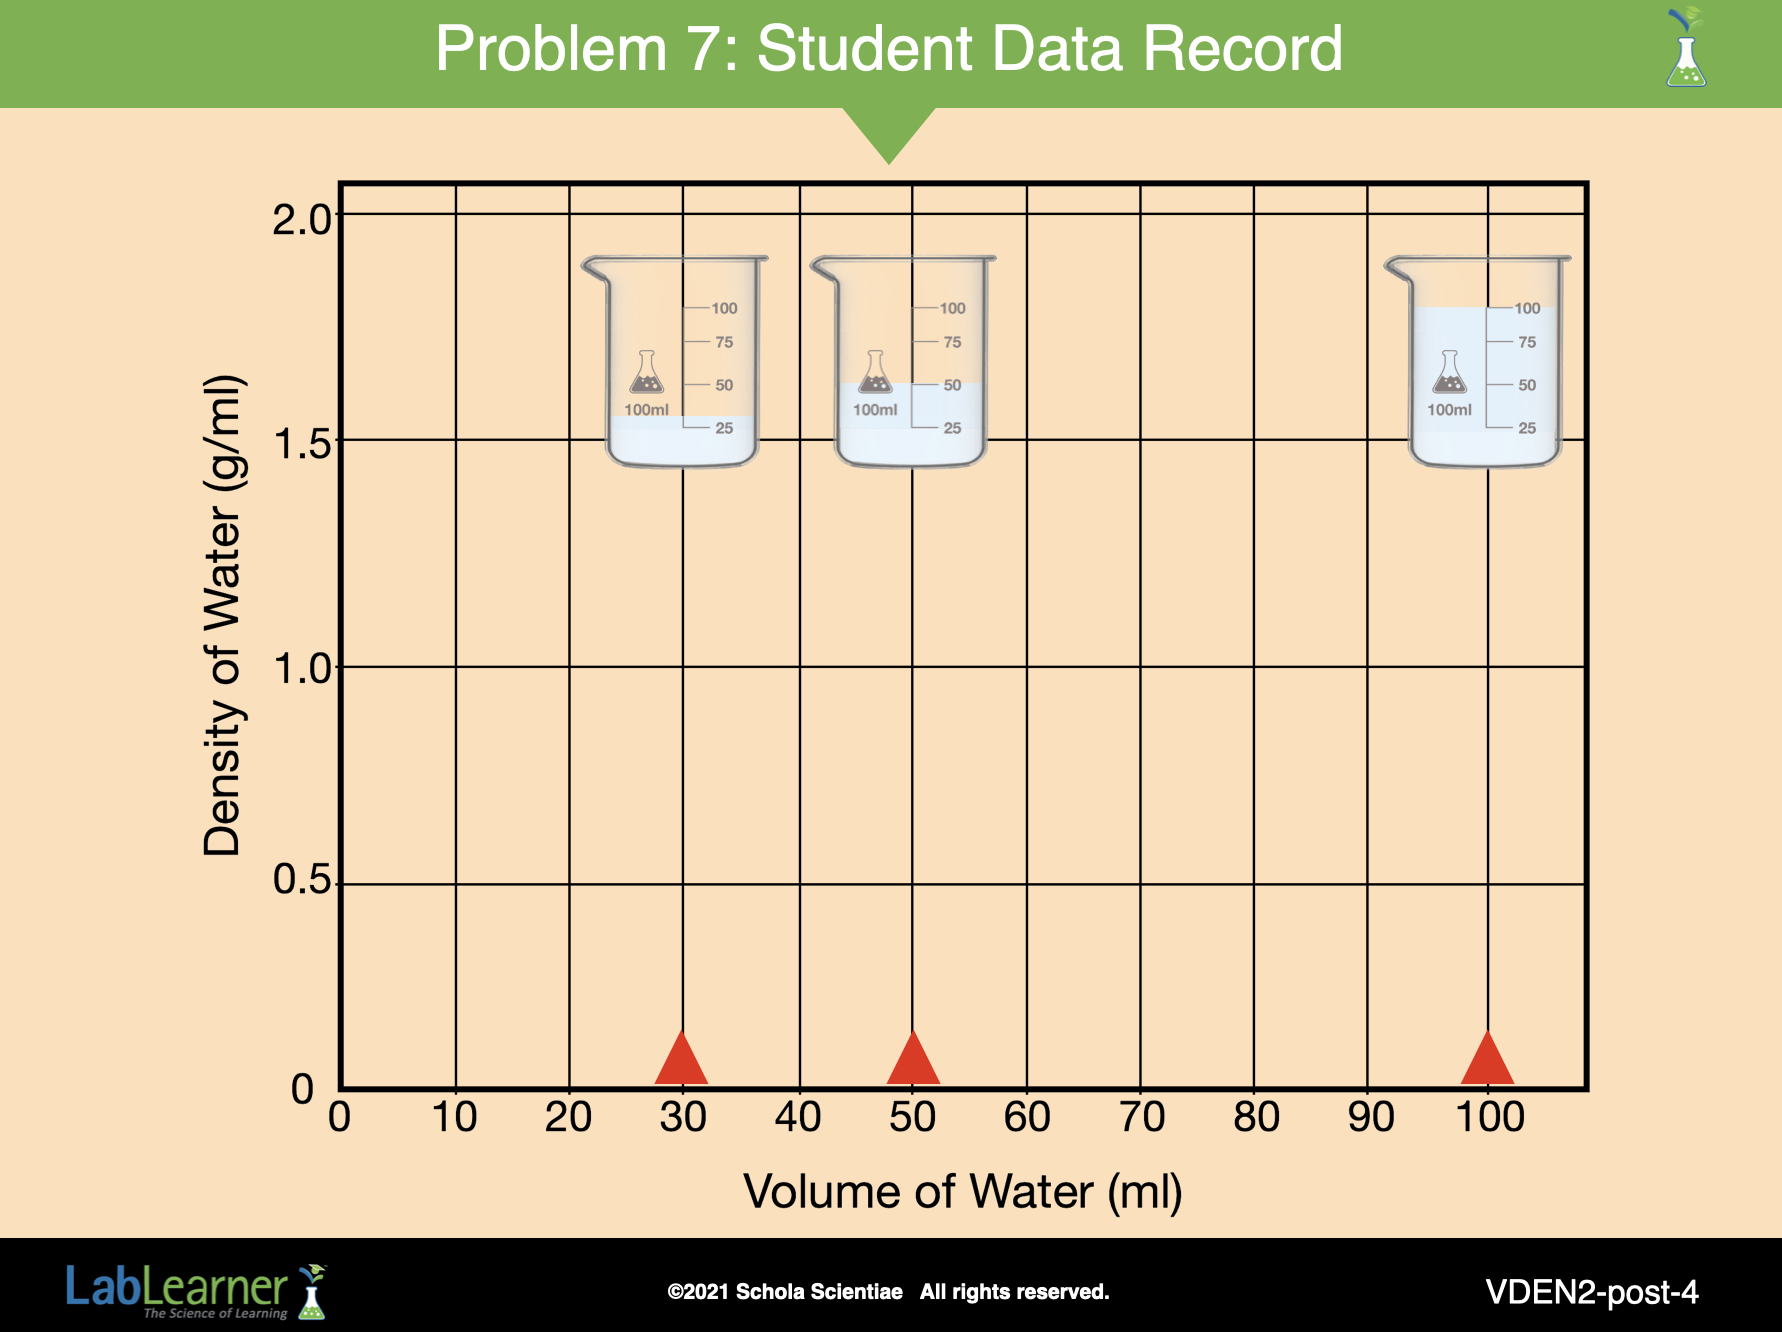
SLIDE VDEN2-post-4
7. Ask students: Can you think of another way that you can present your data? Student answers may vary.
Allow several students to share their ideas. Encourage students to realize that a line graph is preferable to present the data because both variables (density and mass) are quantitative.
8. Instruct students to construct a line graph in the blank space in Problem 7 of their Student Data Record. Students may refer to their Procedural Toolbox if they need assistance in creating and completing a Line Graph. Provide sufficient time for students to construct their graphs. If necessary, remind students of some of the items they may want to consider when constructing their line graphs:
a. Remember to use an x- and y- axis.
b. Think about which variable you will plot along the x-axis and which variable you will plot along the y-axis.
c. Think about the scale you will use on each axis.
d. Decide what to do after you have plotted your data.
9. Ask students: What does your line graph look like? Students should indicate that the line is horizontal or flat.
Note to Teacher: The completed graph below is not included on the Student Portal.
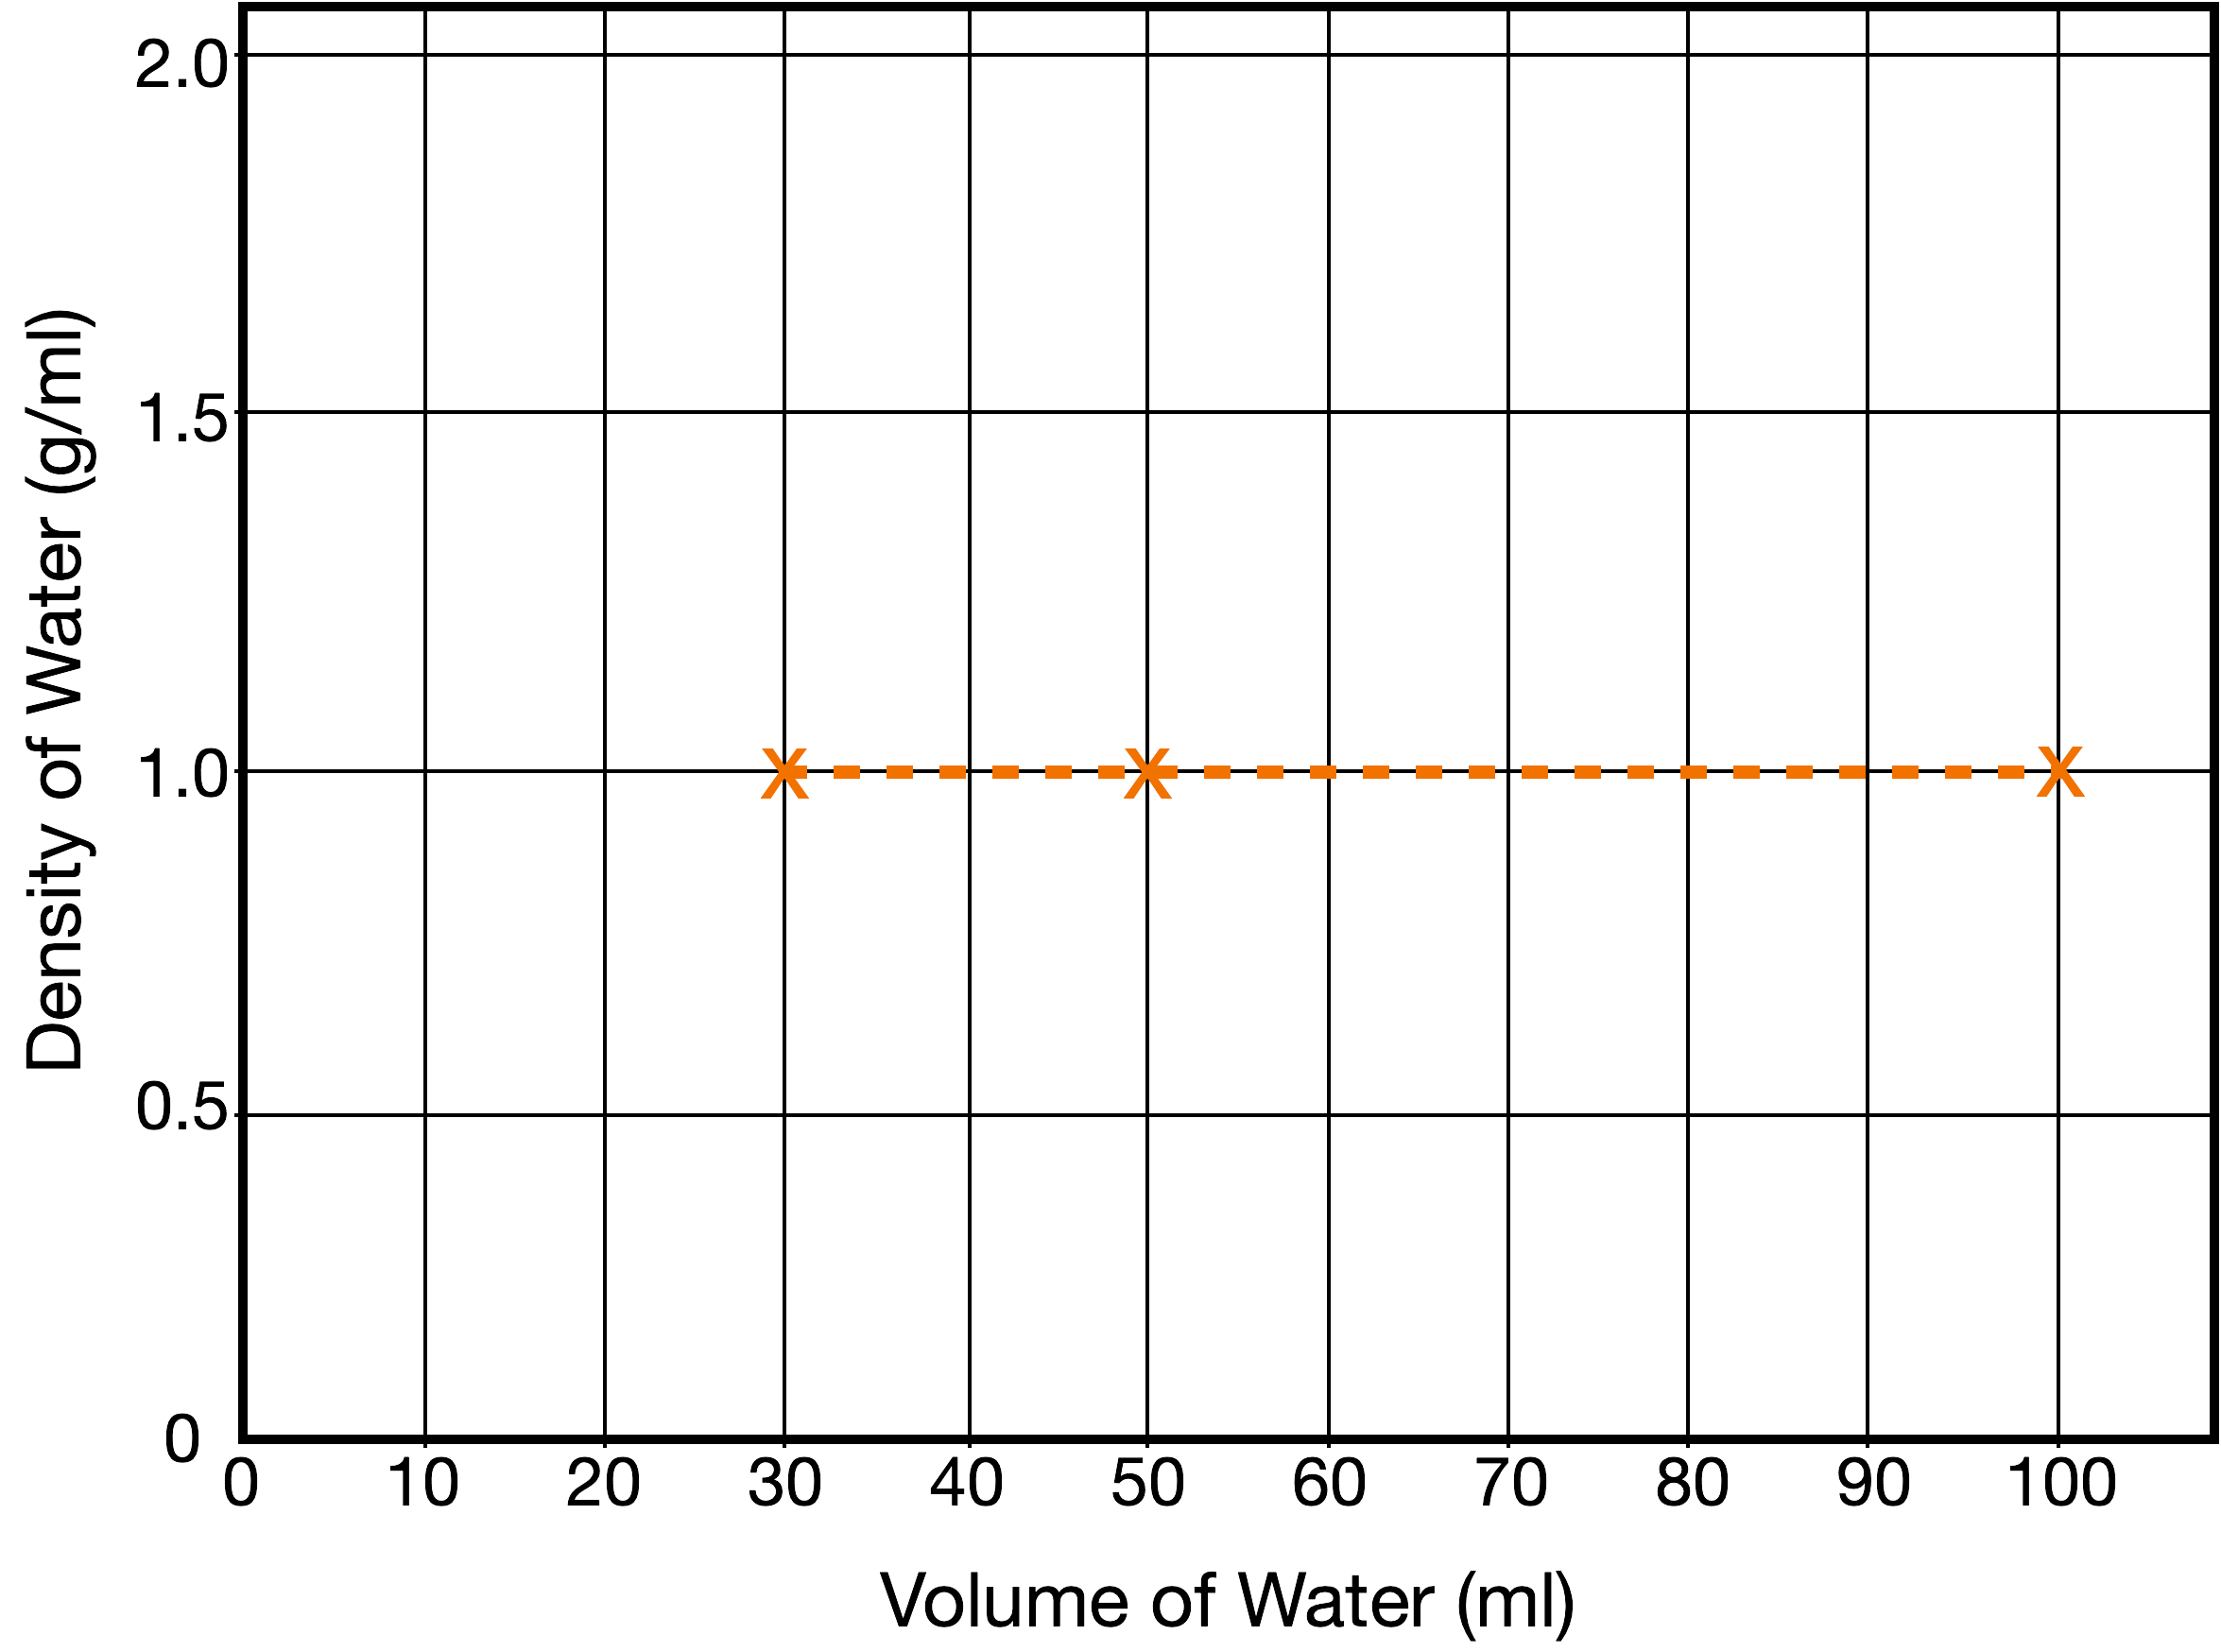
10. Ask students: As you trace the line from small volumes to large volumes from left to right, does the density change? Students should indicate that since the line is horizontal, there is no change in the density of water. The density is the same regardless of whether the sample of water is 30 ml, 50 ml, or 100 ml.
______________________________________________
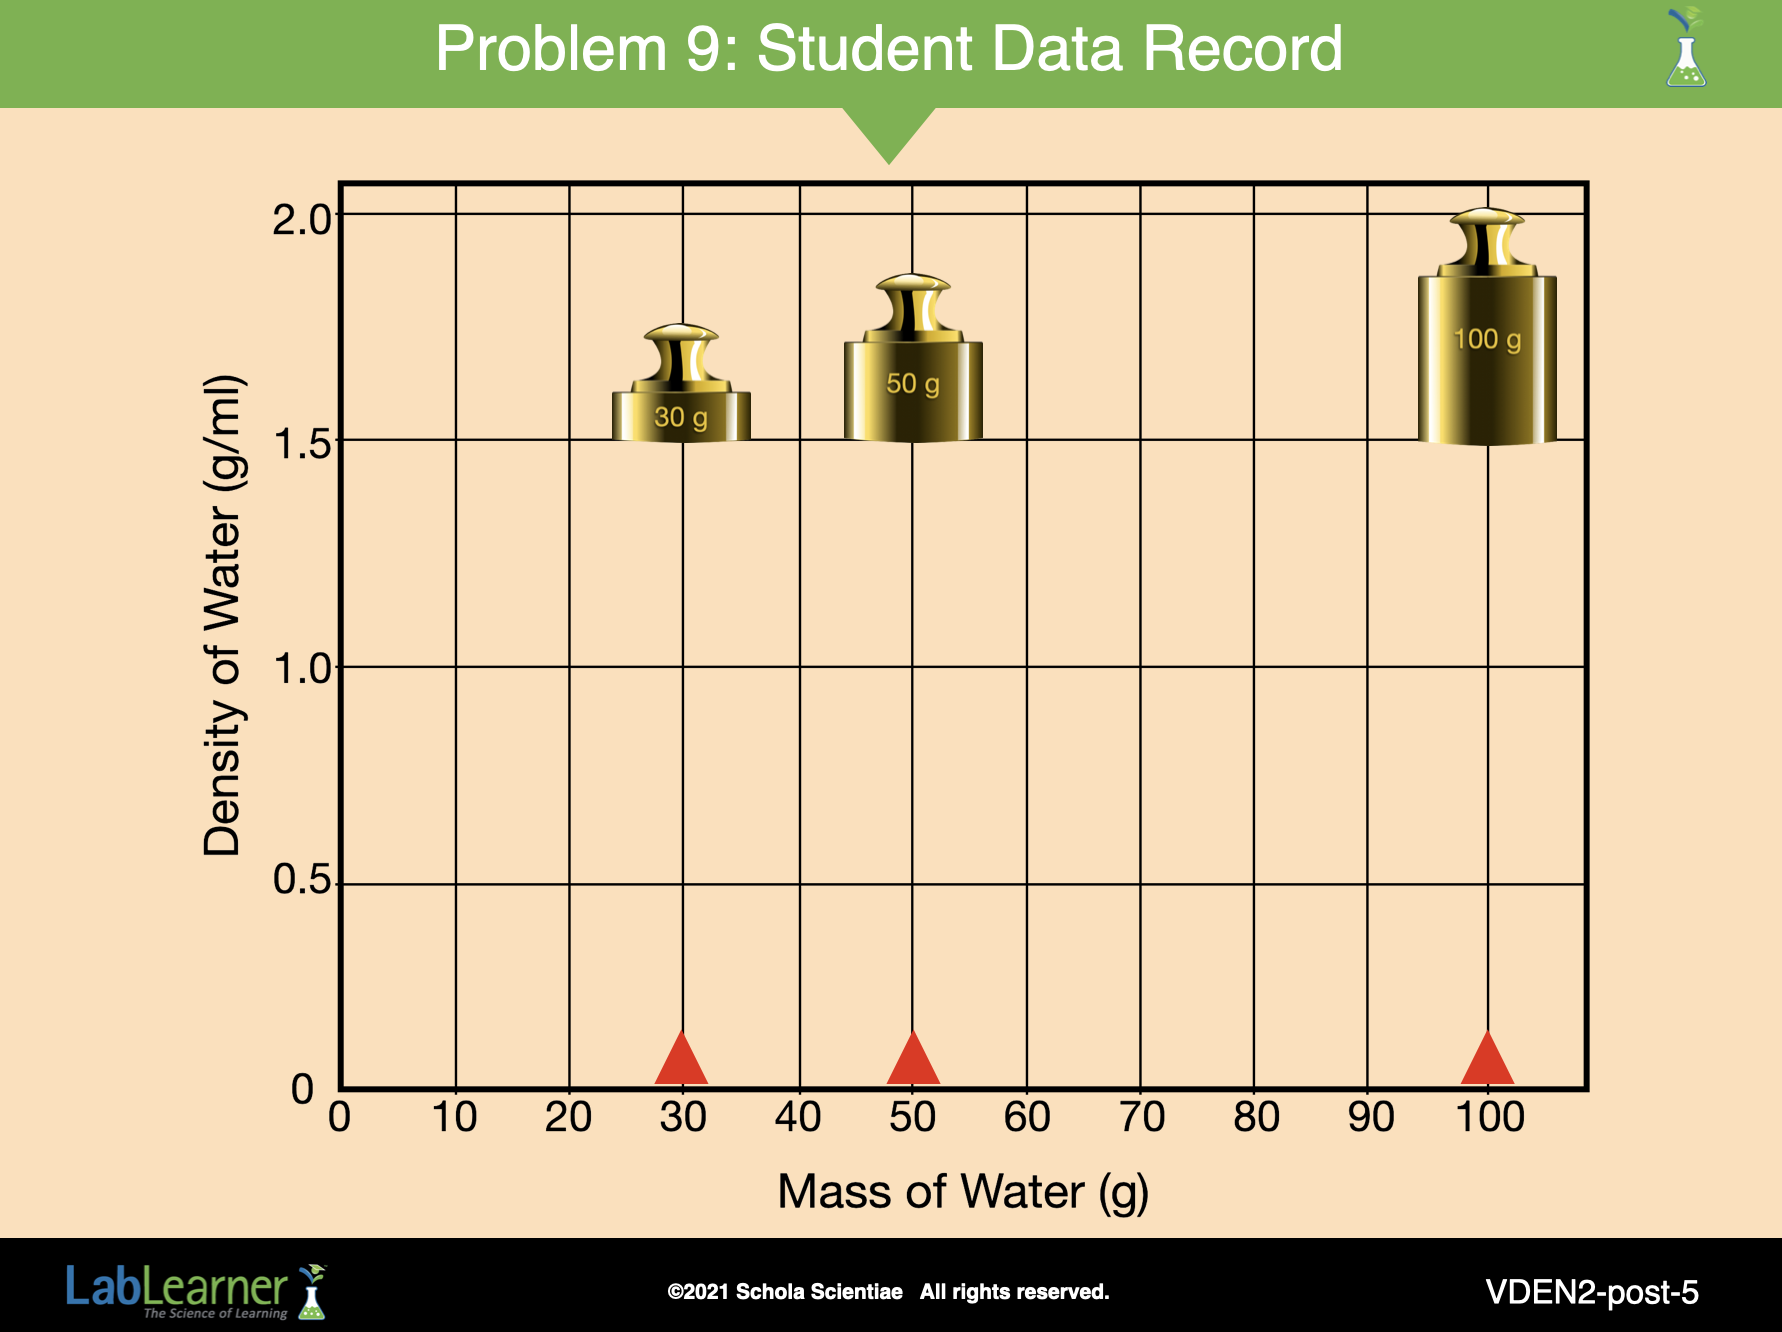
SLIDE VDEN2-post-5
C. Continue the analysis of the investigation by looking at the relationship between mass and density.
1. Ask students: What do you think your line would look like if you had plotted density versus mass instead of volume? Student answers may vary.
2. Divide students into 5 cooperative groups and direct students’ attention to the results of their experiment in Problems 3-5 of their Student Data Record.
3. Instruct students to construct a second line graph in Problem 9 of their Student Data Record. On this graph, students should plot density versus mass. Students may refer to their Procedural Toolbox if they need assistance in creating and completing a Line Graph. Provide sufficient time for students to construct their graphs.
Note to Teacher: The completed graph below is not included on the Student Portal.
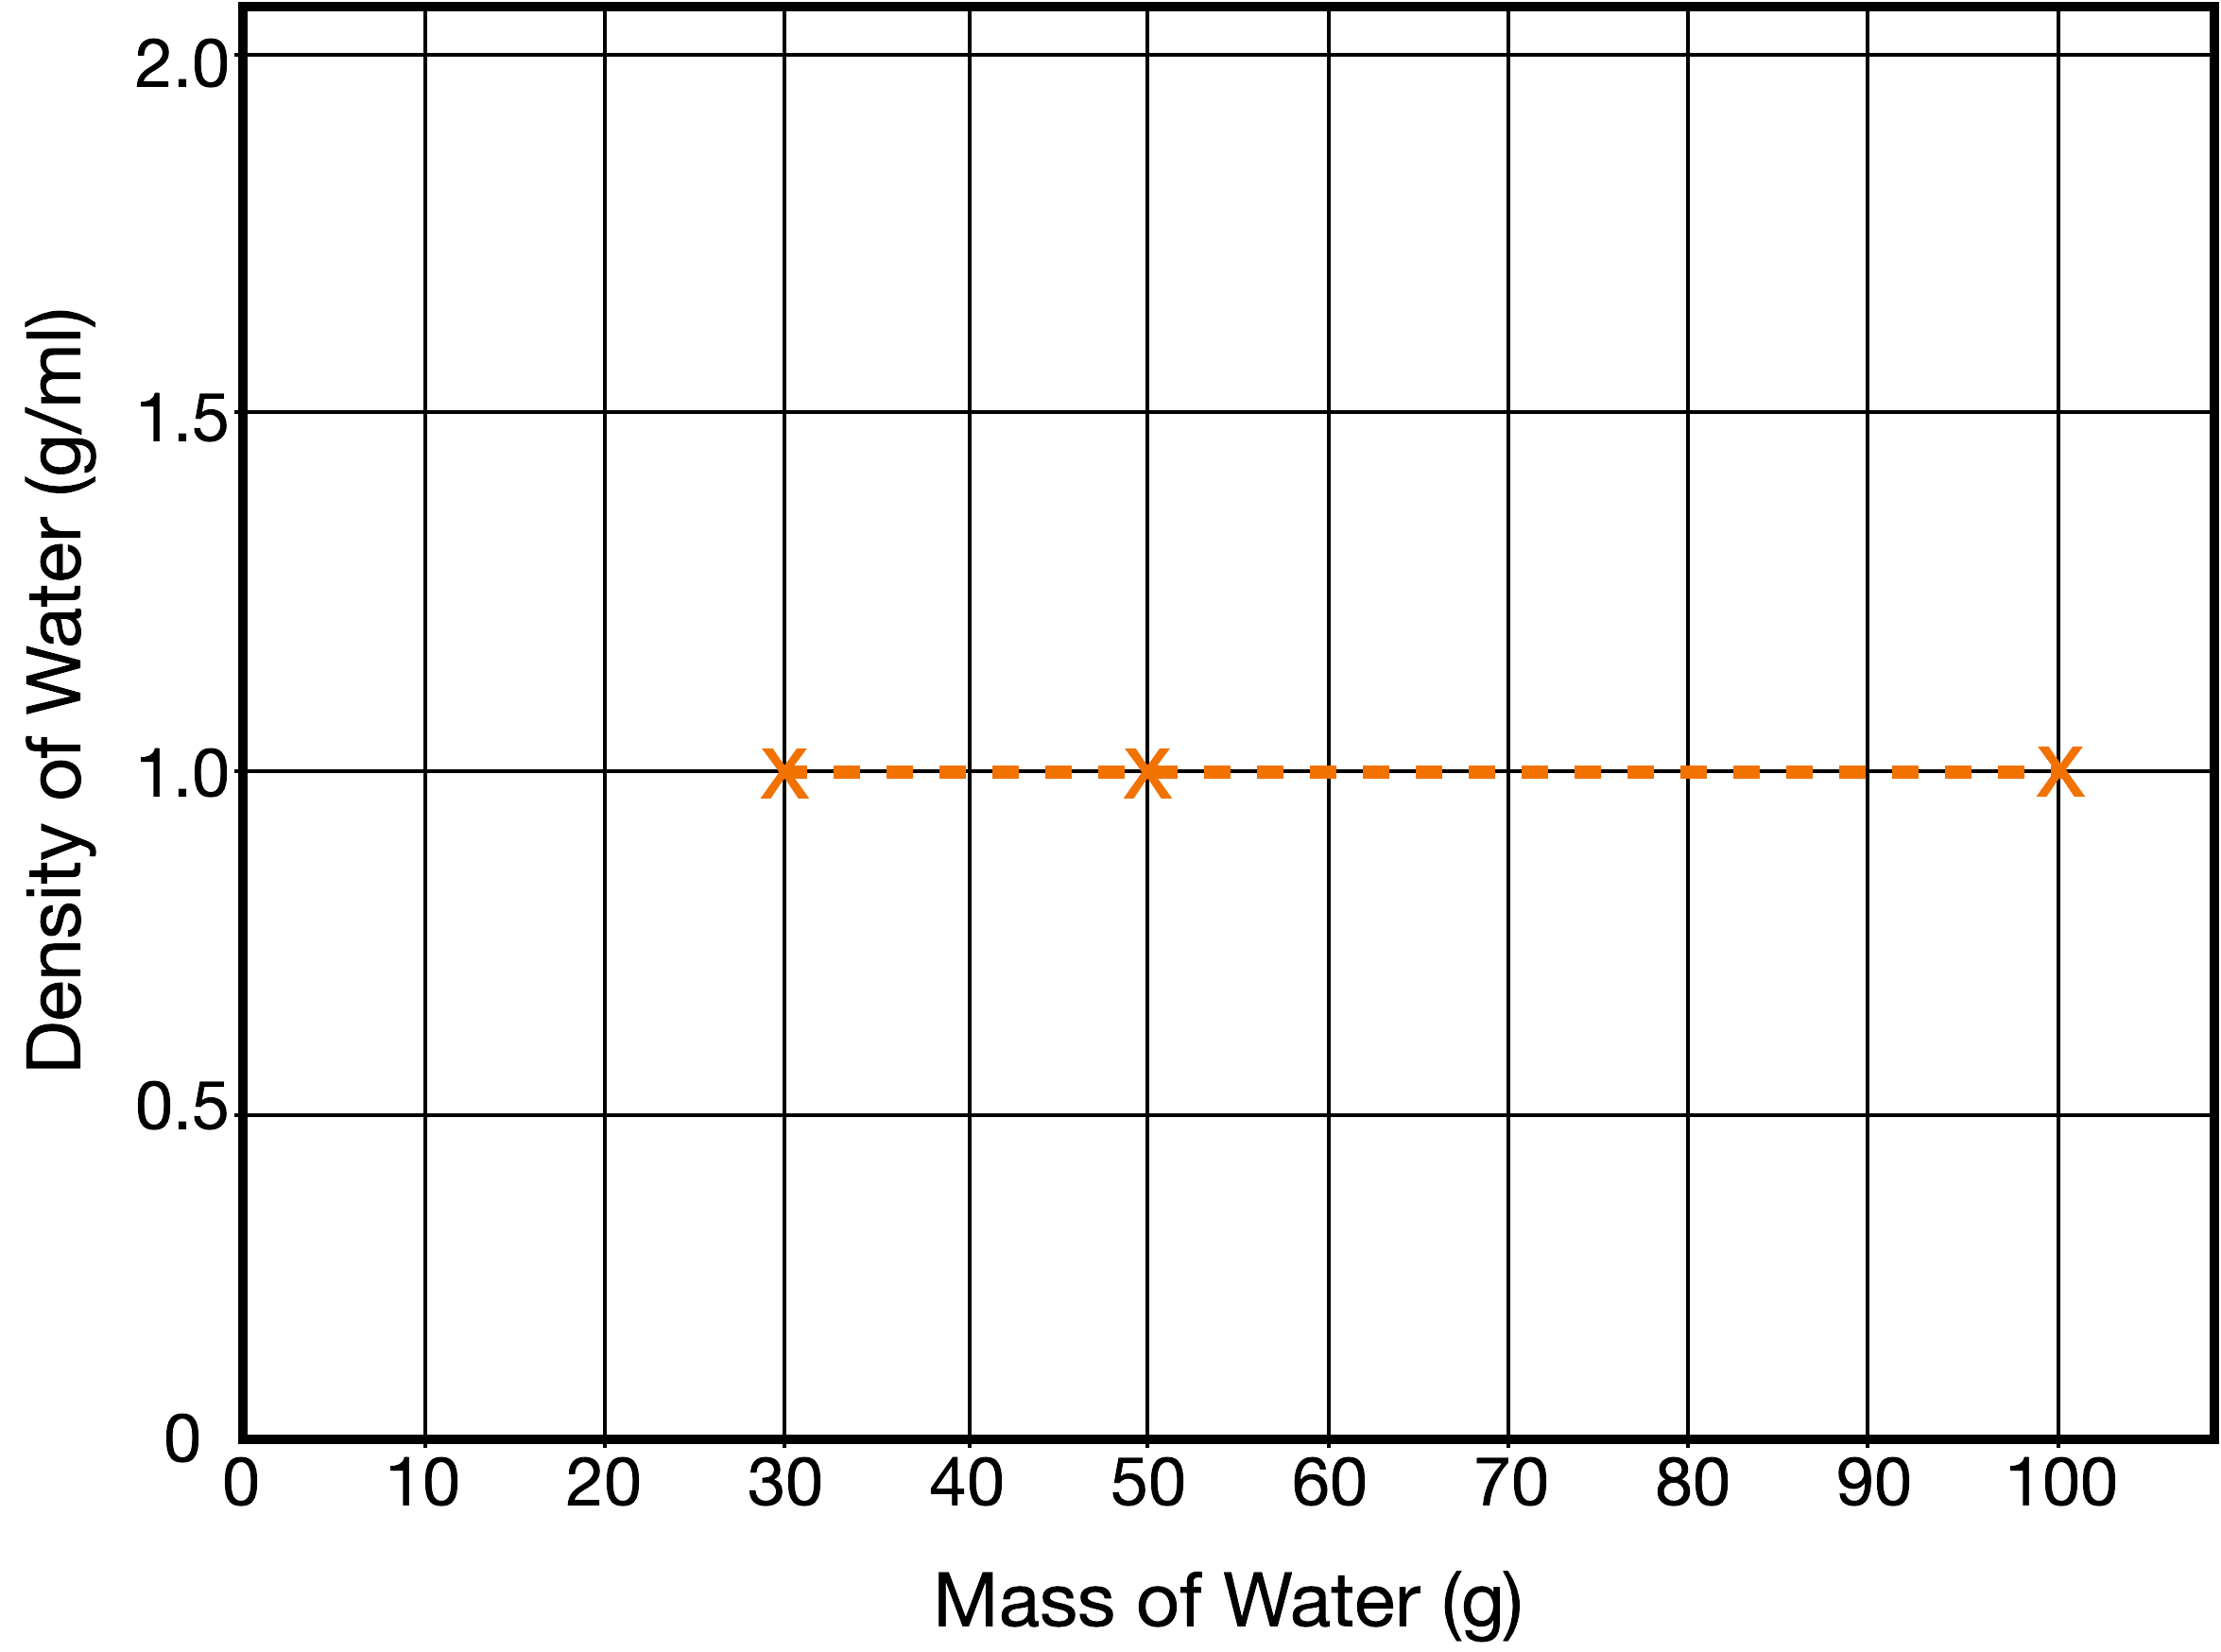
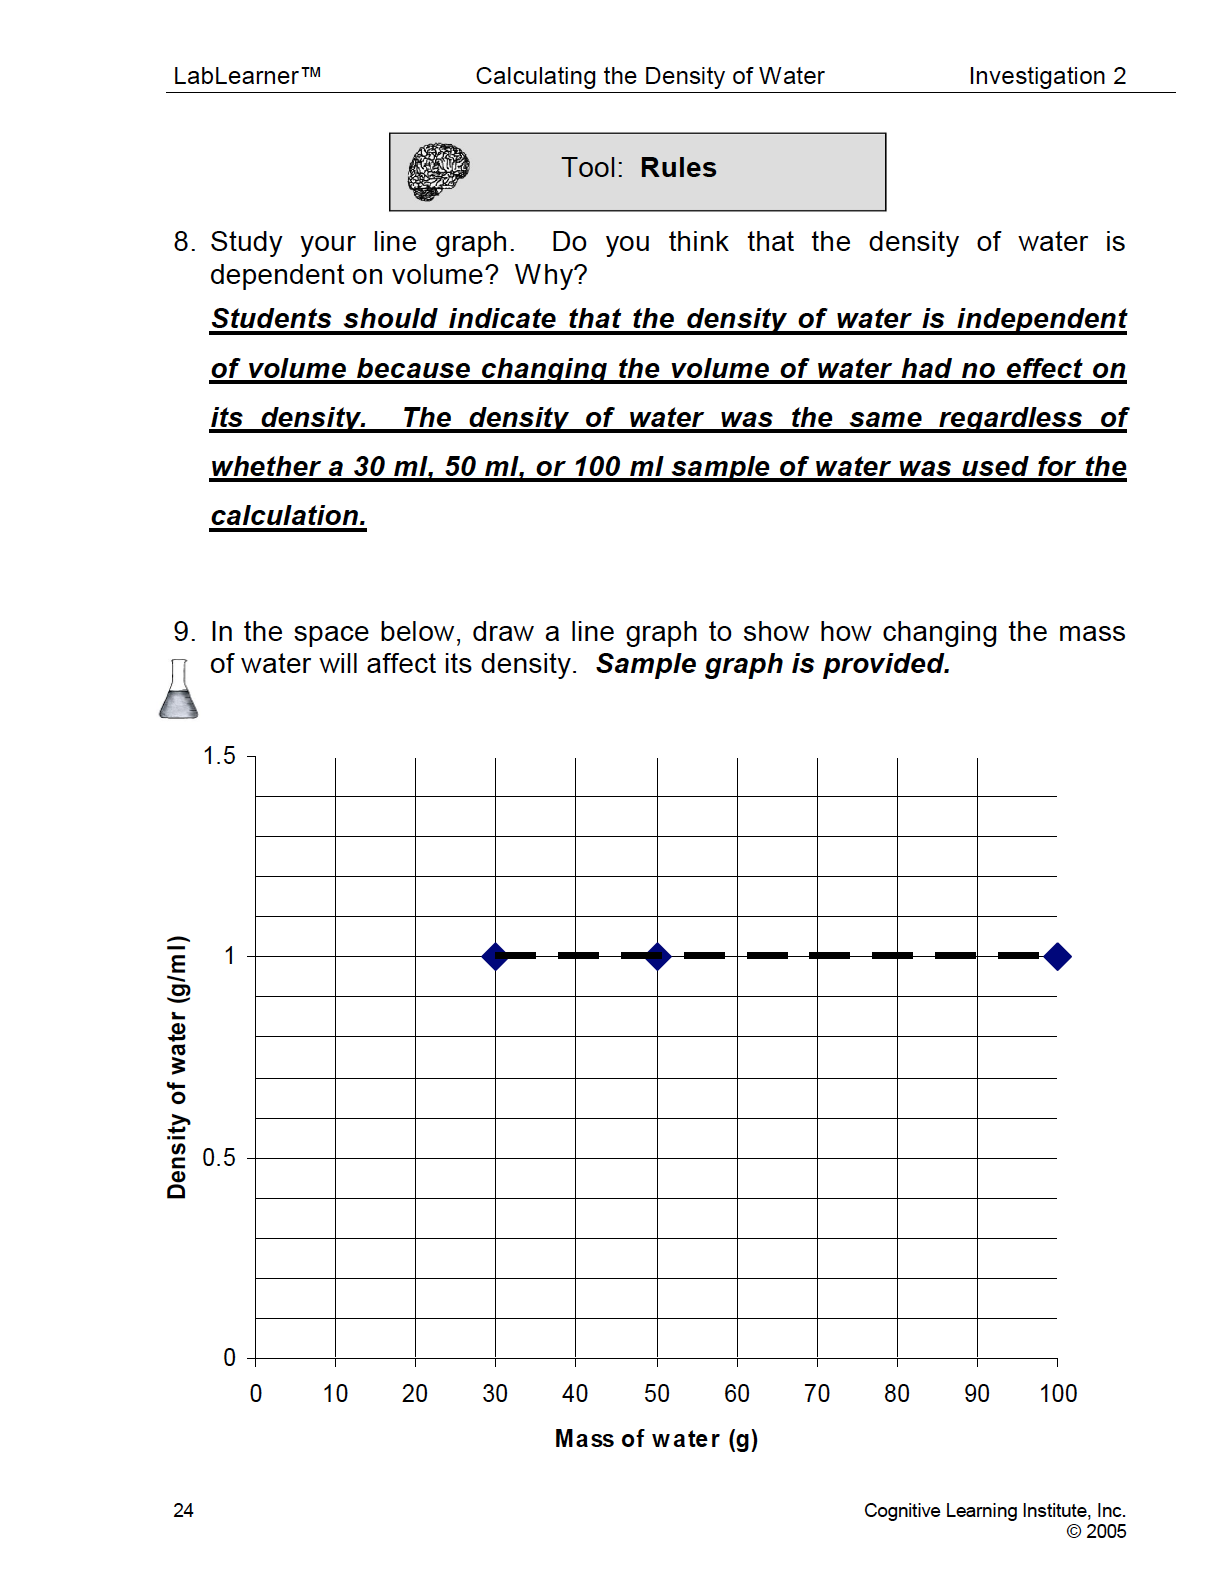
4. Ask students: What does your line look like? Student answers will vary. Students should describe the line as horizontal or flat.
5. Ask students: As you trace the line from small masses to large masses from left to right, does the density change? Students should indicate that the density of the water is the same regardless of whether the sample was 30 grams, 50 grams, or 100 grams.
______________________________________________
SLIDE VDEN2-post-6
D. Continue the analysis of the Investigation by analyzing both line graphs.
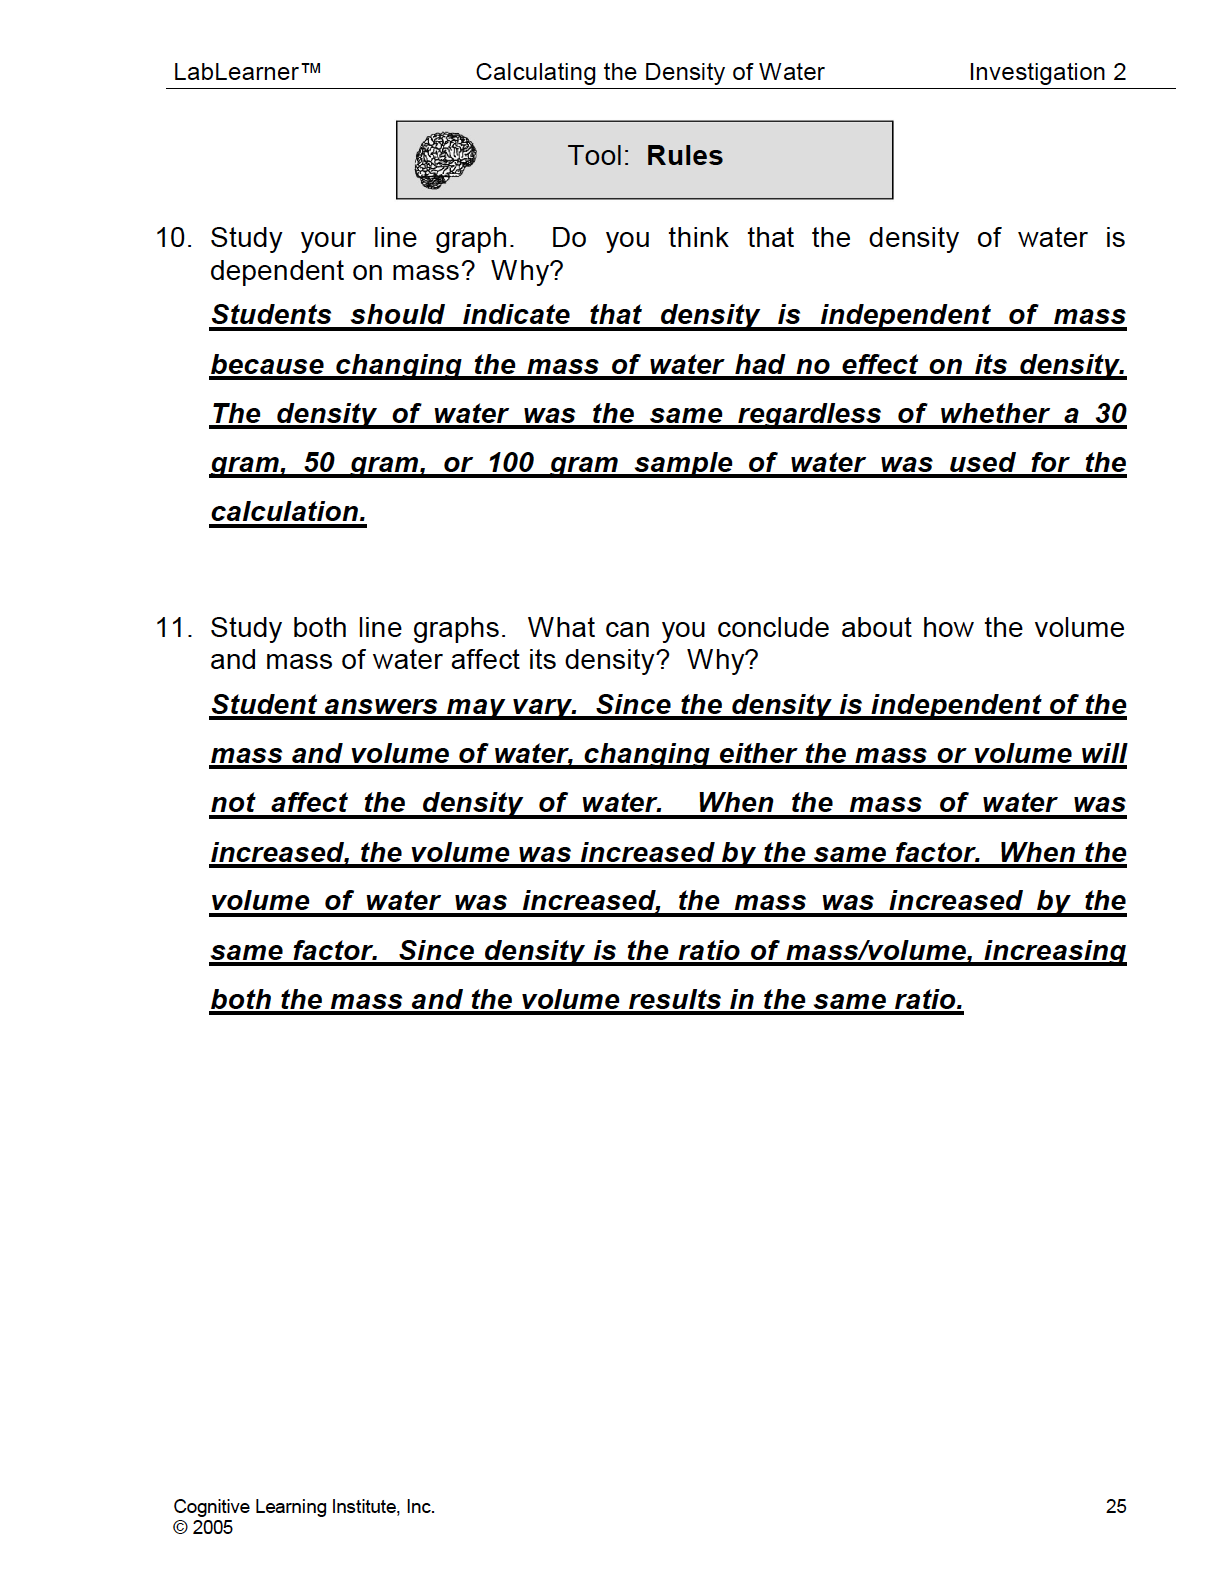
1. Ask students: What do both graphs tell you about the property of density of water? Does the density of water depend on the size of the sample of water? Students should indicate an understanding that density is independent of the volume or mass of water. The density remains the same even if the size of the sample changes.
2. Ask students: How can you relate what you see in your graphs to the data that is recorded in your data table in Problem 6 of your Student Data Record? Why did the density of water remain the same even though the mass and volume of the samples changed? Student answers may vary.
3. Students may need some assistance in formulating an answer. Use the steps below to help guide students in the process of drawing a conclusion.
a. Direct students’ attention to their results for Trials 2 and 3.
Ask students: Did the mass of the water double between Trials 2 and 3? What about the volume? Students should indicate that both mass and volume doubled from Trial 2 to Trial 3.
b. Ask students: What did you notice about the changes in the mass as volume changed? What did you notice about the changes in volume when mass changed? Student answers may vary. Students should indicate that as the mass of the sample of water increased, the volume also increased. As the mass of the sample of water decreased, the volume also decreased.
c. Ask students: Did the density of water change from Trial 2 to Trial 3? Students should indicate that the density of the water did not change.
d. Ask students: Why do you think that the density of the water did not change even though the size of the water samples changed? Student answers may vary. Students should observe from their data tables that as the volumes of the samples increased, so did the masses of the samples.
Note to Teacher: Students should indicate that a change in one of the measurements automatically produces the same magnitude of change in the other. Because density is the ratio of mass to volume, the same magnitude of change in both quantities will result in the same value for the density of the water.
4. Ask students the question again: How can you relate what you see in your graphs to the data that is recorded in your data table in Problem 6 of your Student Data Record? Why did the density of water remain the same even though the mass and volume of the samples changed?
Encourage students to record their answer in Problem 11 of their Student Data Record.
Students should indicate that as the volume of water increased, the mass of the water increased by the same amount. When density was calculated for each sample, the density remained the same because the increase in volume was also accompanied by the same increase in mass. Thus, the quantity for the division of volume by mass remained the same. This observation explains why the density would remain the same on the graphs of mass versus density and volume versus density.
______________________________________________

SLIDE VDEN2-post-7
E. To illustrate the concept of constant density, engage students in the following role play. Students should record their answers in Problem 12 of their Student Data Record.
1. Show students the 2 meter × 2 meter square that is marked on the floor. Tell students that this square represents a volume of 1 milliliter.
a. Ask 5 student volunteers to stand in the square. They represent 5 grams of matter.
b. Ask students: What is the density of the matter? Encourage students to solve the problem in Problem 12a of their
Student Data Record. Student answers may vary. Students may or may not indicate that the density is 5 g/ml.
2. Ask the 5 students to remain standing. Show students the 4 meter × 4 meter square that is marked on the floor. Tell students that this square represents a volume of 2 milliliters.
a. Ask 5 additional student volunteers to join the first 5 students. All 10 students should stand in the 4 meter × 4 meter area. They represent a total of 10 grams of matter.
b. Ask students: What is the density of the matter? Encourage students to solve the problem in Problem 12b of their Student Data Record. Student answers may vary. Students may or may not indicate that the density remains 5 g/ml.
c. Ask student volunteers to return to their seats.
______________________________________________
SLIDE VDEN2-post-8
F. Conclude this part of the Investigation by encouraging students to consider why density is a useful property for scientists.
1. Divide students into pairs. Direct students to find Problem 13 in their Student Data Record. Present students with the following scenario:
They are scientists who need to obtain 70 grams of water. They do not have a triple beam balance but they do have a 100 ml graduated cylinder.
2. Ask students: Without a balance, how could you measure 70 grams of water?
3. Provide time for each student pair to consider and solve the problem and record their solution in Problem 13 in their Student Data Record. After sufficient time, ask each pair to share their solution with the class. Student answers will vary.
A scientist could measure a volume of water using the graduated cylinder if he or she remembered that the mass of water is related to its volume. Specifically, students should have observed the unique relationship between the volume and mass of water based on its density:
30 ml has a mass of 30 grams,
50 ml has a mass of 50 grams,
100 ml has a mass of 100g.
Therefore, 70 ml would have a mass of 70 grams.
In addition, a scientist could calculate the mass of water knowing that the density of water is a constant of 1 gm/ ml. For example, if 70 g of water is required, the scientist could measure 70 ml using the graduated cylinder. Since the density of water is 1g/ml, the calculated mass of 70 ml would be 70 grams.
KEYS: POSTLAB