Teacher Portal:
Properties of Compounds
Investigation 2 – PostLab
 PRINT IT
Use your browser to download a printable PDF as help during the slide presentation and to make additional notes. In your browser, go to File > Print and then choose to save as PDF.
NAVIGATE IT
Once the slide presentation is launched
- use your left and right arrows to advance or go back in the slide presentation, and
- hover your mouse over the left edge of the presentation to get a view of the thumbnails for all the slides so that you can quickly move anywhere in the presentation.
- Click HERE to launch the slide presentation for the CELL.
SHARE IT
SLIDE VCOMP2-post-1
This was the second Investigation of the LabLearner CELL Properties of Compounds. In it, students examined the solubility of solutes in solvents. They also explored the chemical concept of concentration and saturation of solutions.
______________________________________________
SLIDE VCOMP2-post-2
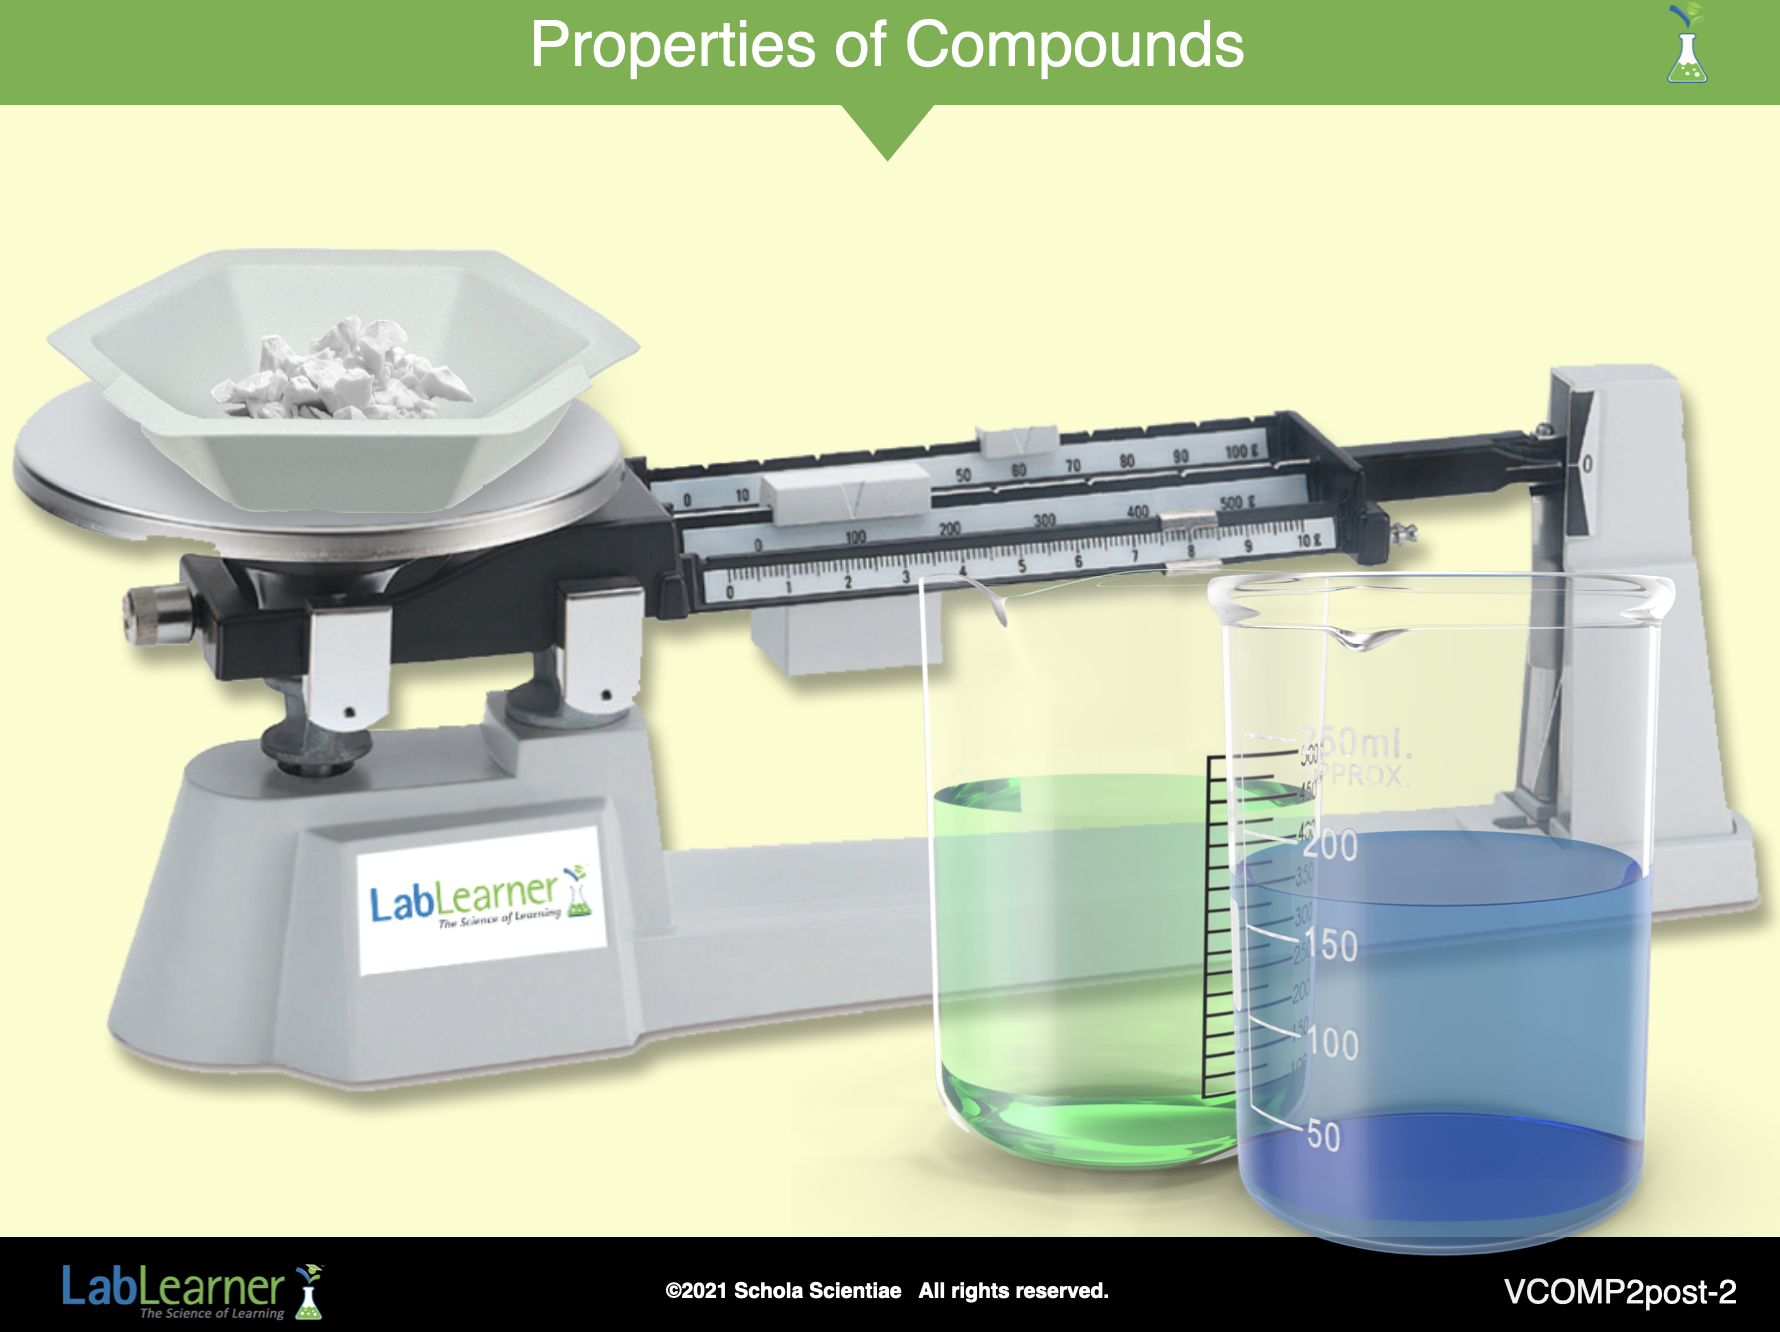
A. Begin this part of the Investigation by reviewing the experiments students performed in the lab. Ask the following questions to promote discussion of the experiments:
1. Ask students: Which properties of compounds did you investigate during the experiments? Students investigated the properties of solubility and concentration.
2. Ask students: The experiment was designed to lead you, as a class, to compare the solubility of four different compounds. How did you do this? Each student group was assigned one compound to investigate. Students obtained a specific mass of the compound and added it to 100 ml of water. After stirring the compound for two minutes, students observed the solubility of the compound. Students then repeated the procedure for three other masses of the same compound. By comparing data with other groups, each student group would be able to compare the solubility of each compound.
3. Ask students: What is concentration? Concentration is the amount of one substance per volume of another substance.
4. Ask students: How did you vary concentration in your experiment? During the experiment, students obtained different masses of their compound. By adding increasingly larger samples to the same amount of water, the concentration of compound per 100 ml of water increased.
______________________________________________
SLIDE VCOMP2-post-3
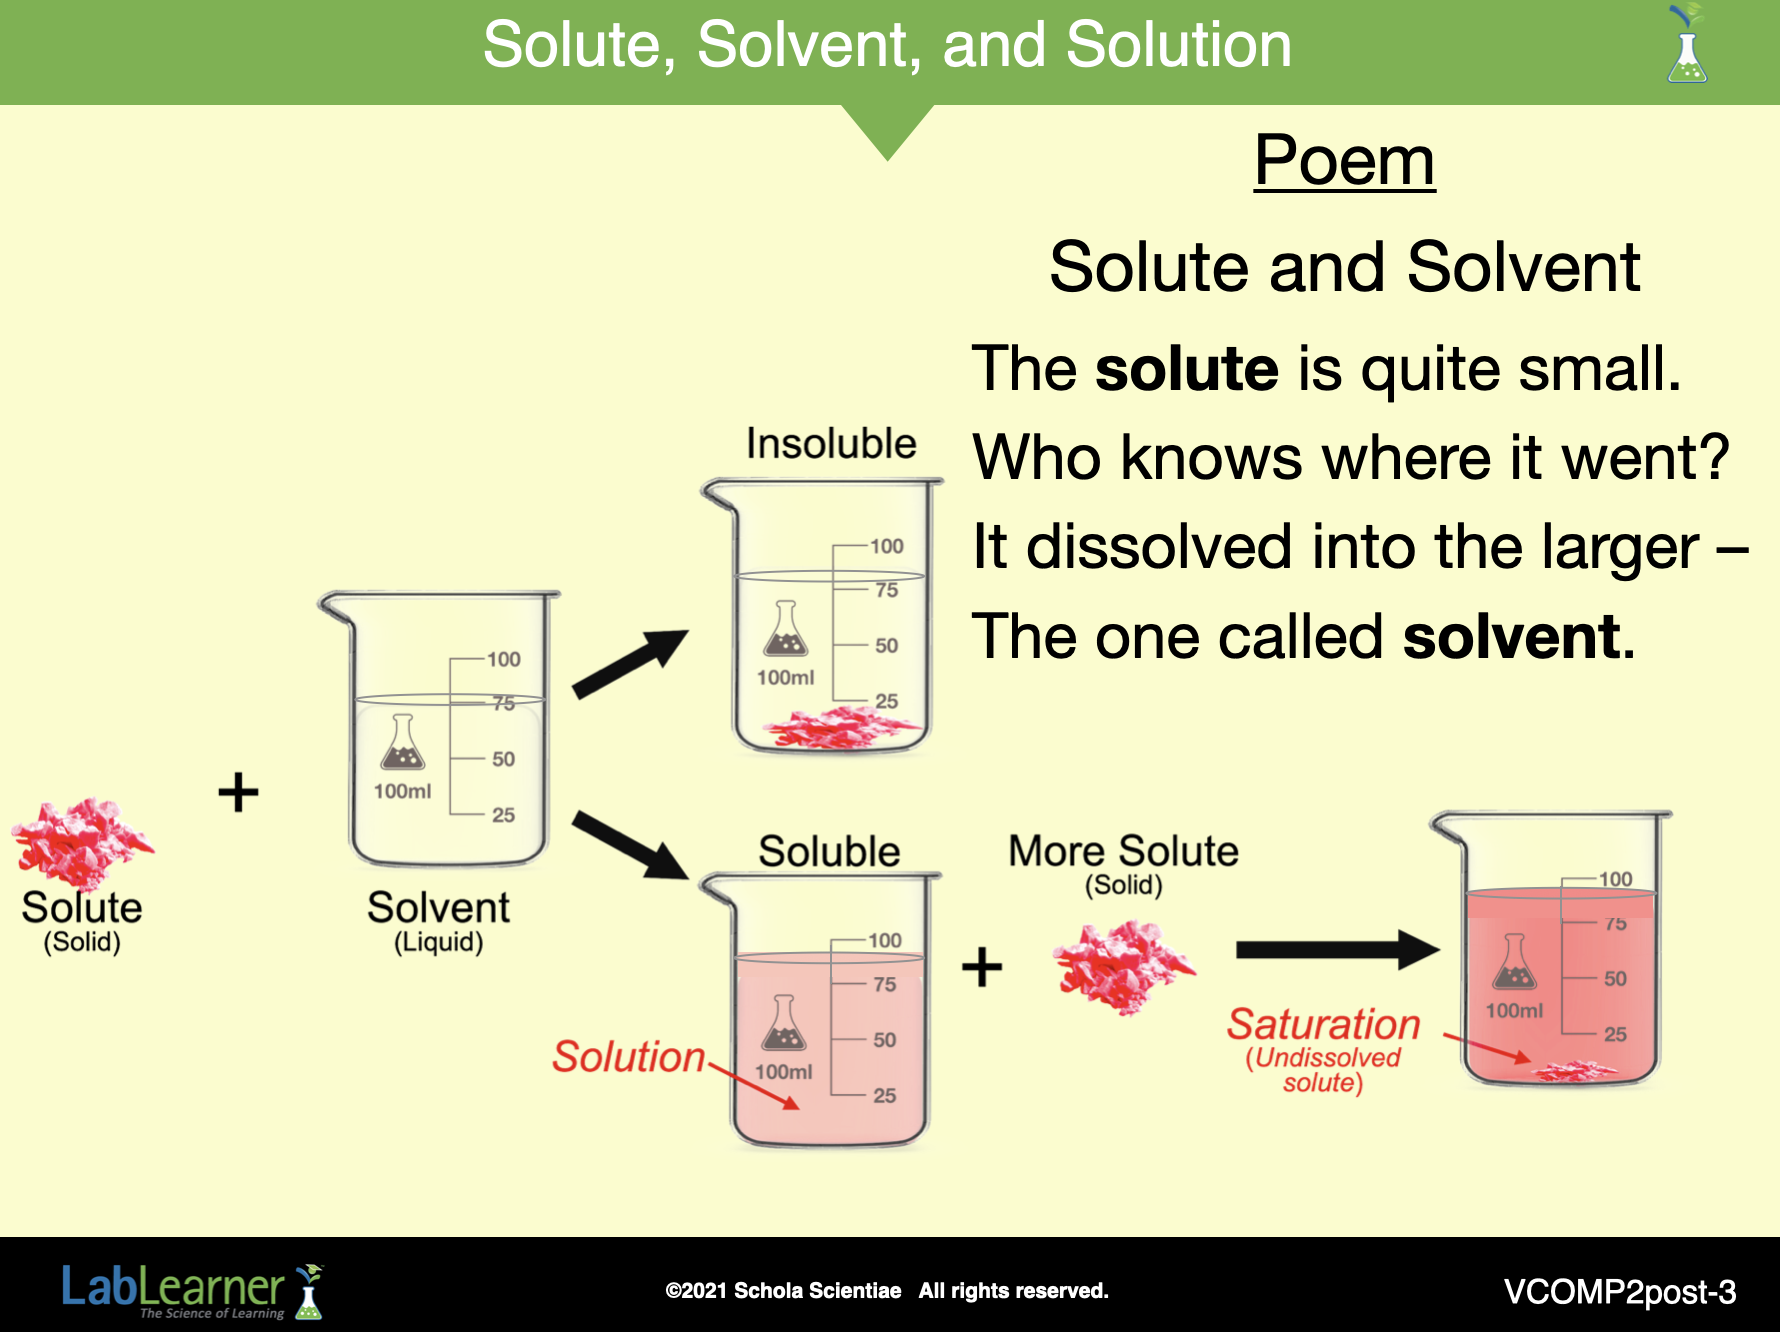
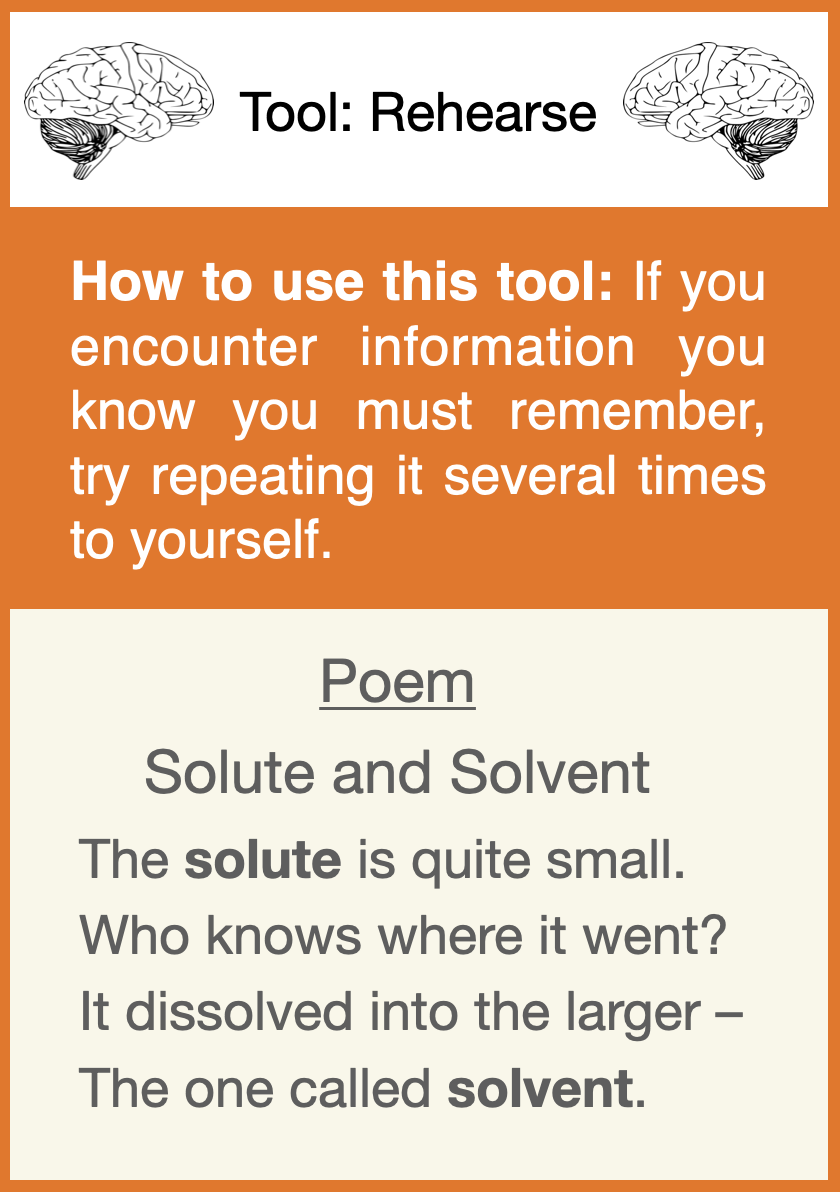
B. The terms solute, solvent, and solution will be used throughout the analysis of the experiment. Conduct the following activity if students need to review this terminology.
1. Explain to students that scientists use several key terms when investigating solubility. Students have already begun using some key terms, such as soluble, solubility, and dissolve.
2. Tell students that in the lab, they created solutions.
Ask students: What is a solution? Student answers may vary.
3. After students have attempted to define the term solution, encourage them to refer to their Scientist’s Glossary to find the definition.
Solution: A mixture of two or more substances that is the same throughout the mixture.
4. Explain to students that one or more solutes must be added to a solvent when creating a solution. Instruct students to find the terms solute and solvent in their Scientist’s Glossary and ask student volunteers to read the terms aloud.
Solute: The substance that changes its state when a solution is created or that is in the smallest amount in a solution.
Solvent: The substance in a solution that does not change its state when a solution is created, or that is present in the largest amount.
a. Encourage students to realize that the solute has two distinct characteristics: it is the substance that may change state and it is the substance present in the smaller amount.
b. Ask students: Which substance was the solute – the water, the cream of tartar, baking soda, salt, and sugar? The cream of tartar, baking soda, salt, and sugar are solutes. All of these compounds changed states from solid to liquid as they were added to water, and both were present in a smaller quantity than the water.
 c. Encourage students to realize that the solvent also has two distinct characteristics: it is the substance that does not change state, and it is the substance present in the larger amount.
d. Ask students: Which substance was the solvent – the water, the cream of tartar, baking soda, salt, and sugar? The water was the solvent. It remained liquid and was present in a larger volume than the salt and sugar.
5. Explain to students that because the terms solvent and solute sound relatively similar, it may be challenging to remember which definition corresponds to each term.
6. Encourage students to continue to use these terms as they review the experiments from in the lab.
______________________________________________
SLIDE VCOMP2-post-4
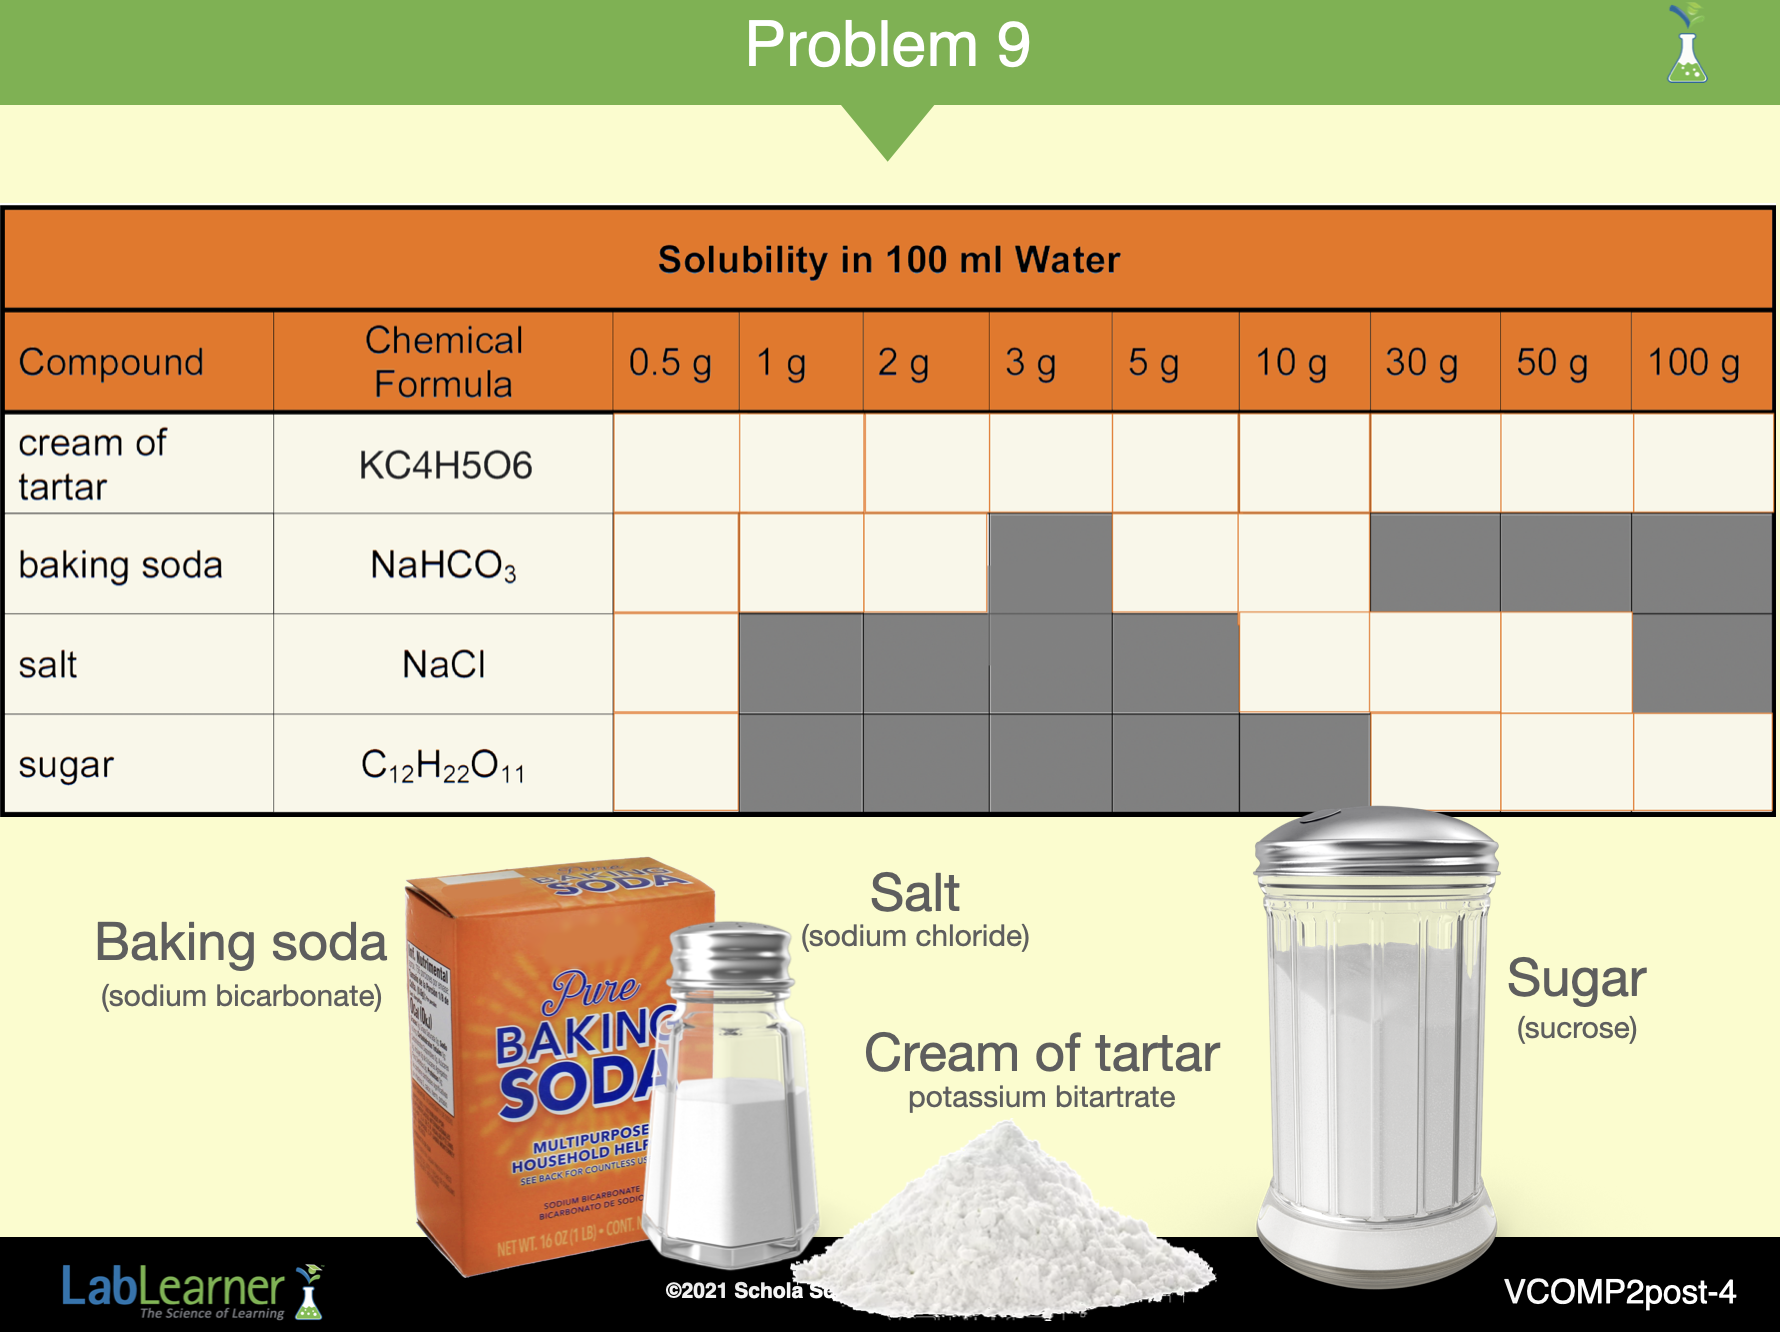
C. Tell students that to compare the solubility of the compounds explored in the lab, each group must share their collected data with the other four groups.
1. Divide students into cooperative groups. Each group should contain one representative from each lab group so that the group contains one student who explored salt, another who explored sugar, another who investigated cream of tartar, and two who explored baking soda.
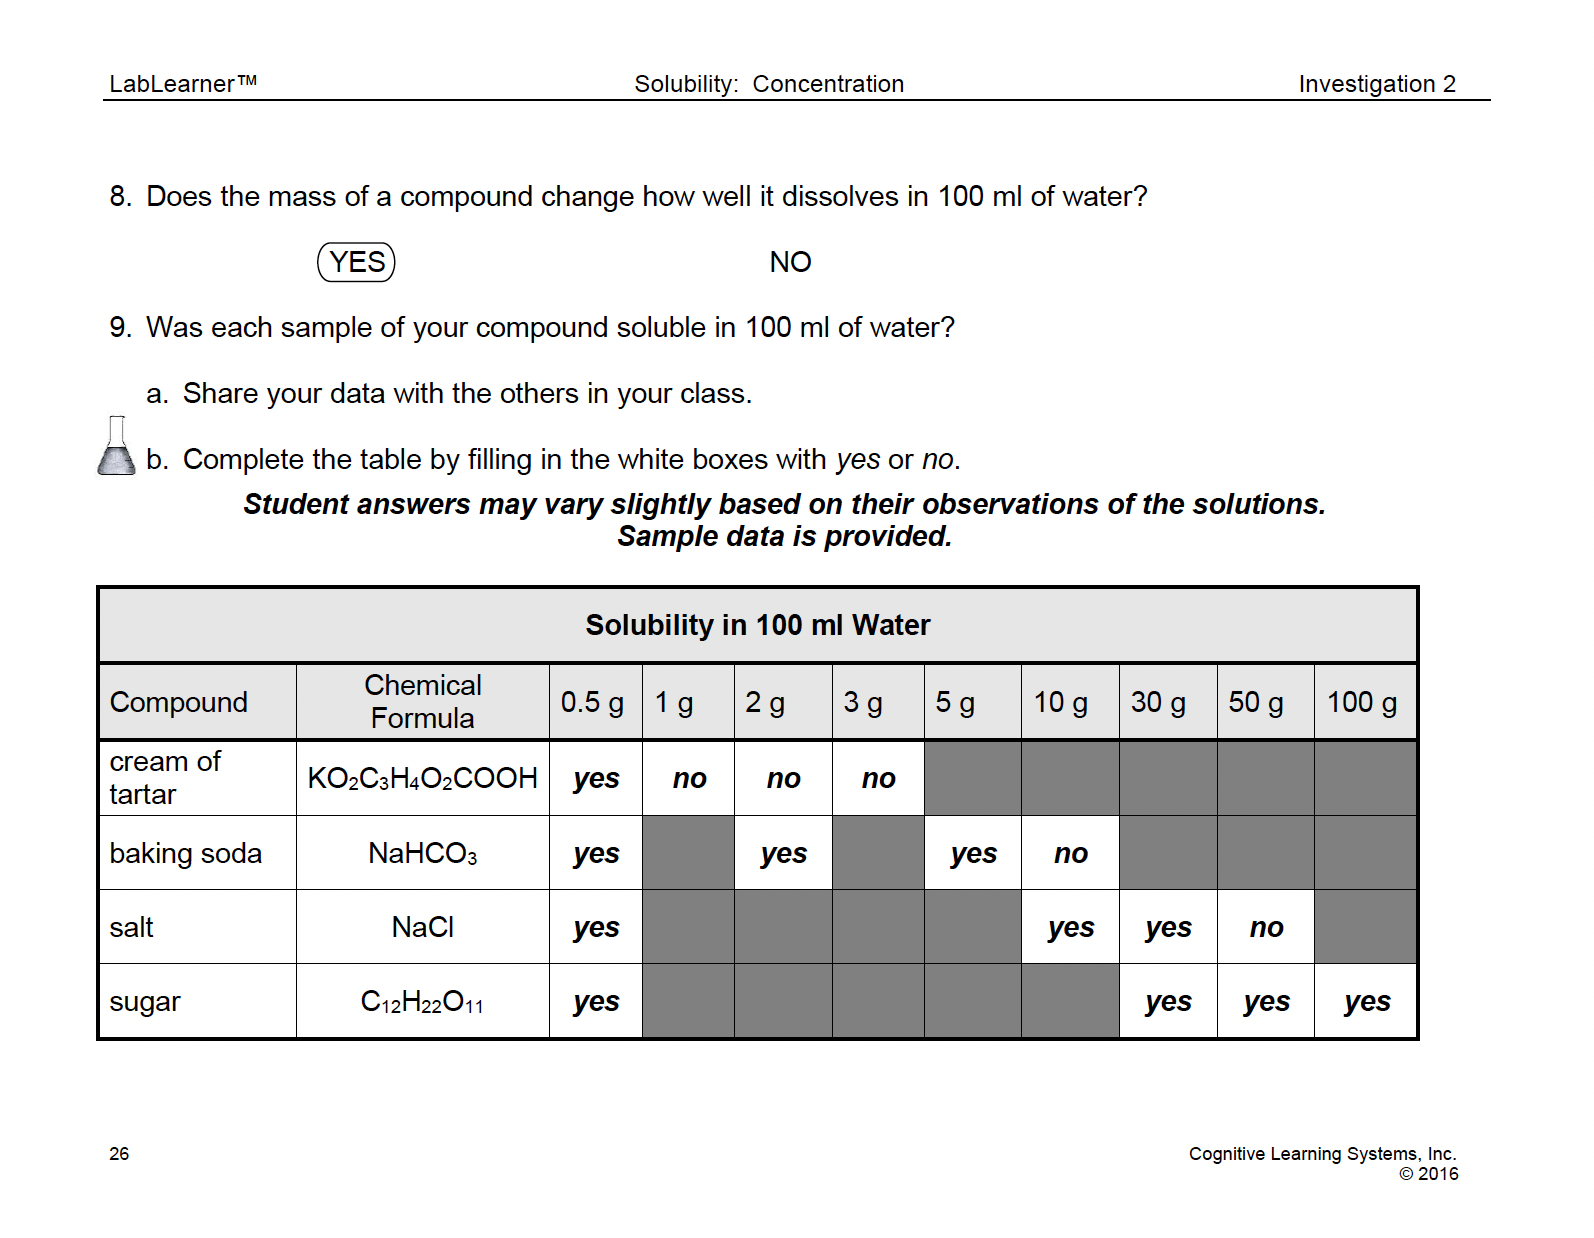
2. Instruct students to work together to complete the Table in Problem 9 of the Student Data Record. To complete the Table, students should write yes if the compound at a particular mass was soluble in 100 ml of water and no if the compound was insoluble.
3. Allow students sufficient time to complete the Table.
4. Encourage students to look at the Tables they have created. Ask students to find the maximum amount of each compound that was able to dissolve in 100 ml of room-temperature water. Instruct students to work together to answer Problem 10 in the Student Data Record.
______________________________
D. As a class, begin to discuss the similarities and differences in the solubility of each compound.
1. Instruct students to study the Table in Problem 9.
Ask students: Do any compounds contain similar elements? Yes, sugar and cream of tartar both contain carbon, hydrogen, and oxygen. Salt and baking soda both contain sodium.
2. Ask students: Do the compounds containing similar elements have similar solubility? Student answers may vary. Only 0.5 g of cream of tartar dissolved in 100 ml of water, and at least 100 g of sugar dissolved in 100 ml. Therefore, cream of tartar is much less soluble than sugar, even though both contain carbon, hydrogen, and oxygen.
Similarly, only 5 g of baking soda dissolved in 100 ml water, while 30 g of salt dissolved in 100 ml water. Therefore, baking soda is much less soluble than salt, even though both contain sodium.
3. Ask students: Do any compounds contain different elements? Yes, sugar and cream of tartar share no elements with salt. Although baking soda contains hydrogen, carbon, and oxygen, baking soda also contains sodium, which neither sugar nor cream of tartar contains.
4. Ask students: Do the compounds containing different elements have different solubility? Yes, all of the compounds have different solubility, both those that contain the same elements and those that contain different elements.
______________________________________________
SLIDE VCOMP2-post-5
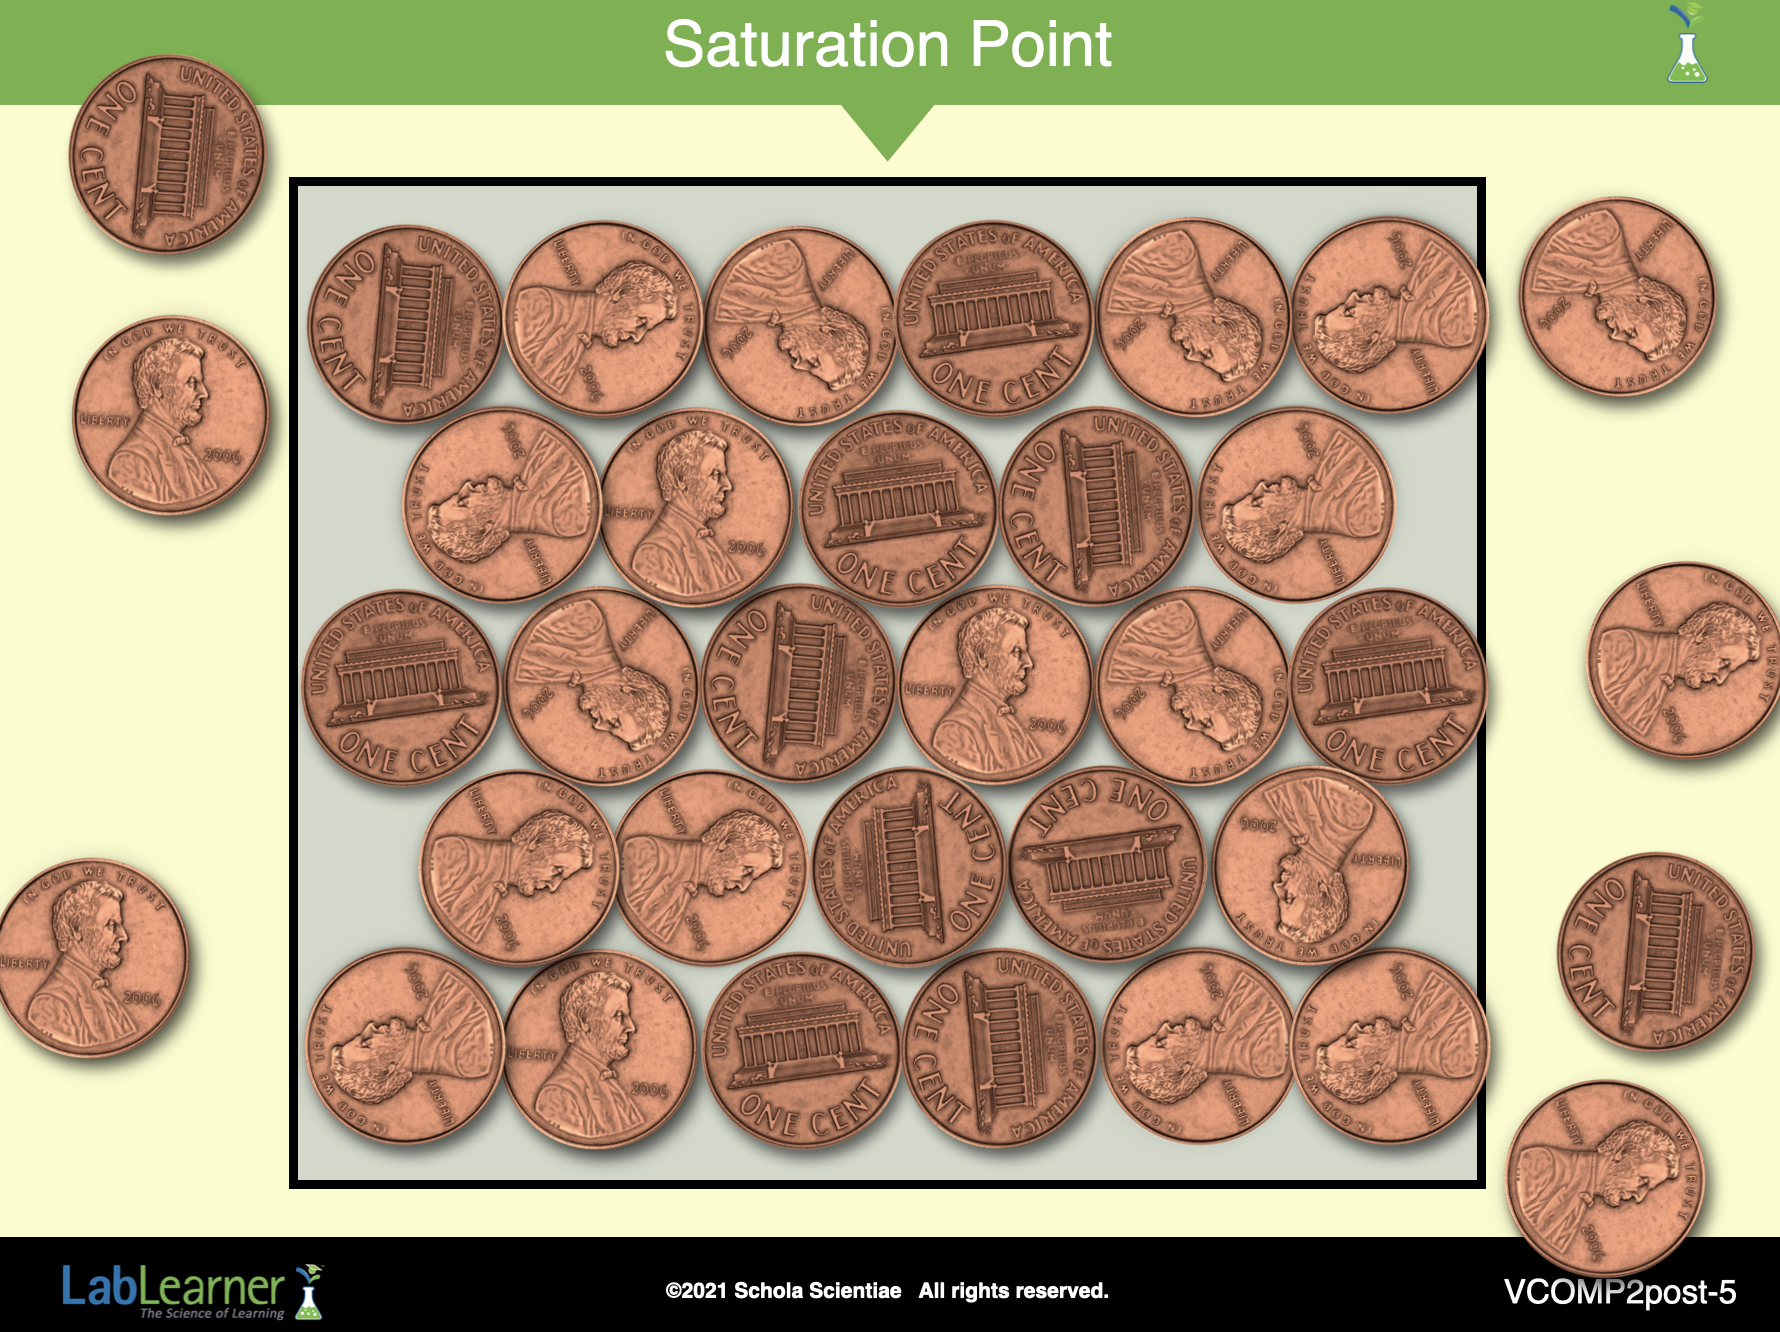
E. Conduct the following activity to introduce students to the concept of saturation. Students may work in pairs or individually for this activity.
1. Provide each pair or individual student with the same 20 to 30 small, flat manipulatives that they used in the PreLab lesson, such as pennies, paper clips, or squares of paper.
2. Instruct students to find the rectangle drawn in Problem 2 of the Student Data Record.
3. Remind students that during the PreLab lesson, they explored concentration using the rectangle and the pennies (or other small objects).
Ask students: How did you create a low concentration of pennies in the rectangle? Students placed very few pennies in the rectangle.
4. Ask students: How did you create a high concentration of pennies in the rectangle? Students placed many pennies in the rectangle.
5. Instruct students to create the highest possible concentration of pennies in the rectangle. Students may not stack the pennies or other small manipulatives on top of one another; they must lie side by side within the rectangle.
6. After students have placed the pennies in the rectangle,
Ask students: Can you fit any more pennies in the rectangle? No, students cannot place more pennies in the rectangle.
7. Ask students: Aside from making the rectangle larger, is there anything you can do to make more pennies fit in the rectangle without stacking them? No, there is nothing students can do to make more pennies fit in the rectangle.
8. Tell students that scientists would say that the rectangle is saturated with pennies. No more pennies can fit in the rectangle. Instruct students to find and read aloud the definition of saturation point from the Scientist’s Glossary:
Saturation point: The point at which no more solute may be dissolved within a solvent. Also referred to as the solubility of a solute.
9. Encourage students to realize that just as the pennies reached a saturation point in the rectangle, some of the compounds they dissolved in water also reached a saturation point.
10. Ask students: What do you think is meant by saturation point when referring to compounds dissolving in another substance? Student answers may vary. The saturation point is the point at which no more of a solute may be dissolved in a specific volume of a solvent at a certain temperature.
Tell students that sometimes scientists use the term saturation point and sometimes they refer to this value as the solubility of the compound.
______________________________________________
SLIDE VCOMP2-post-6
F. As a class, discuss the saturation point of the compounds tested in the lab. The following questions may be helpful as you facilitate the discussion:
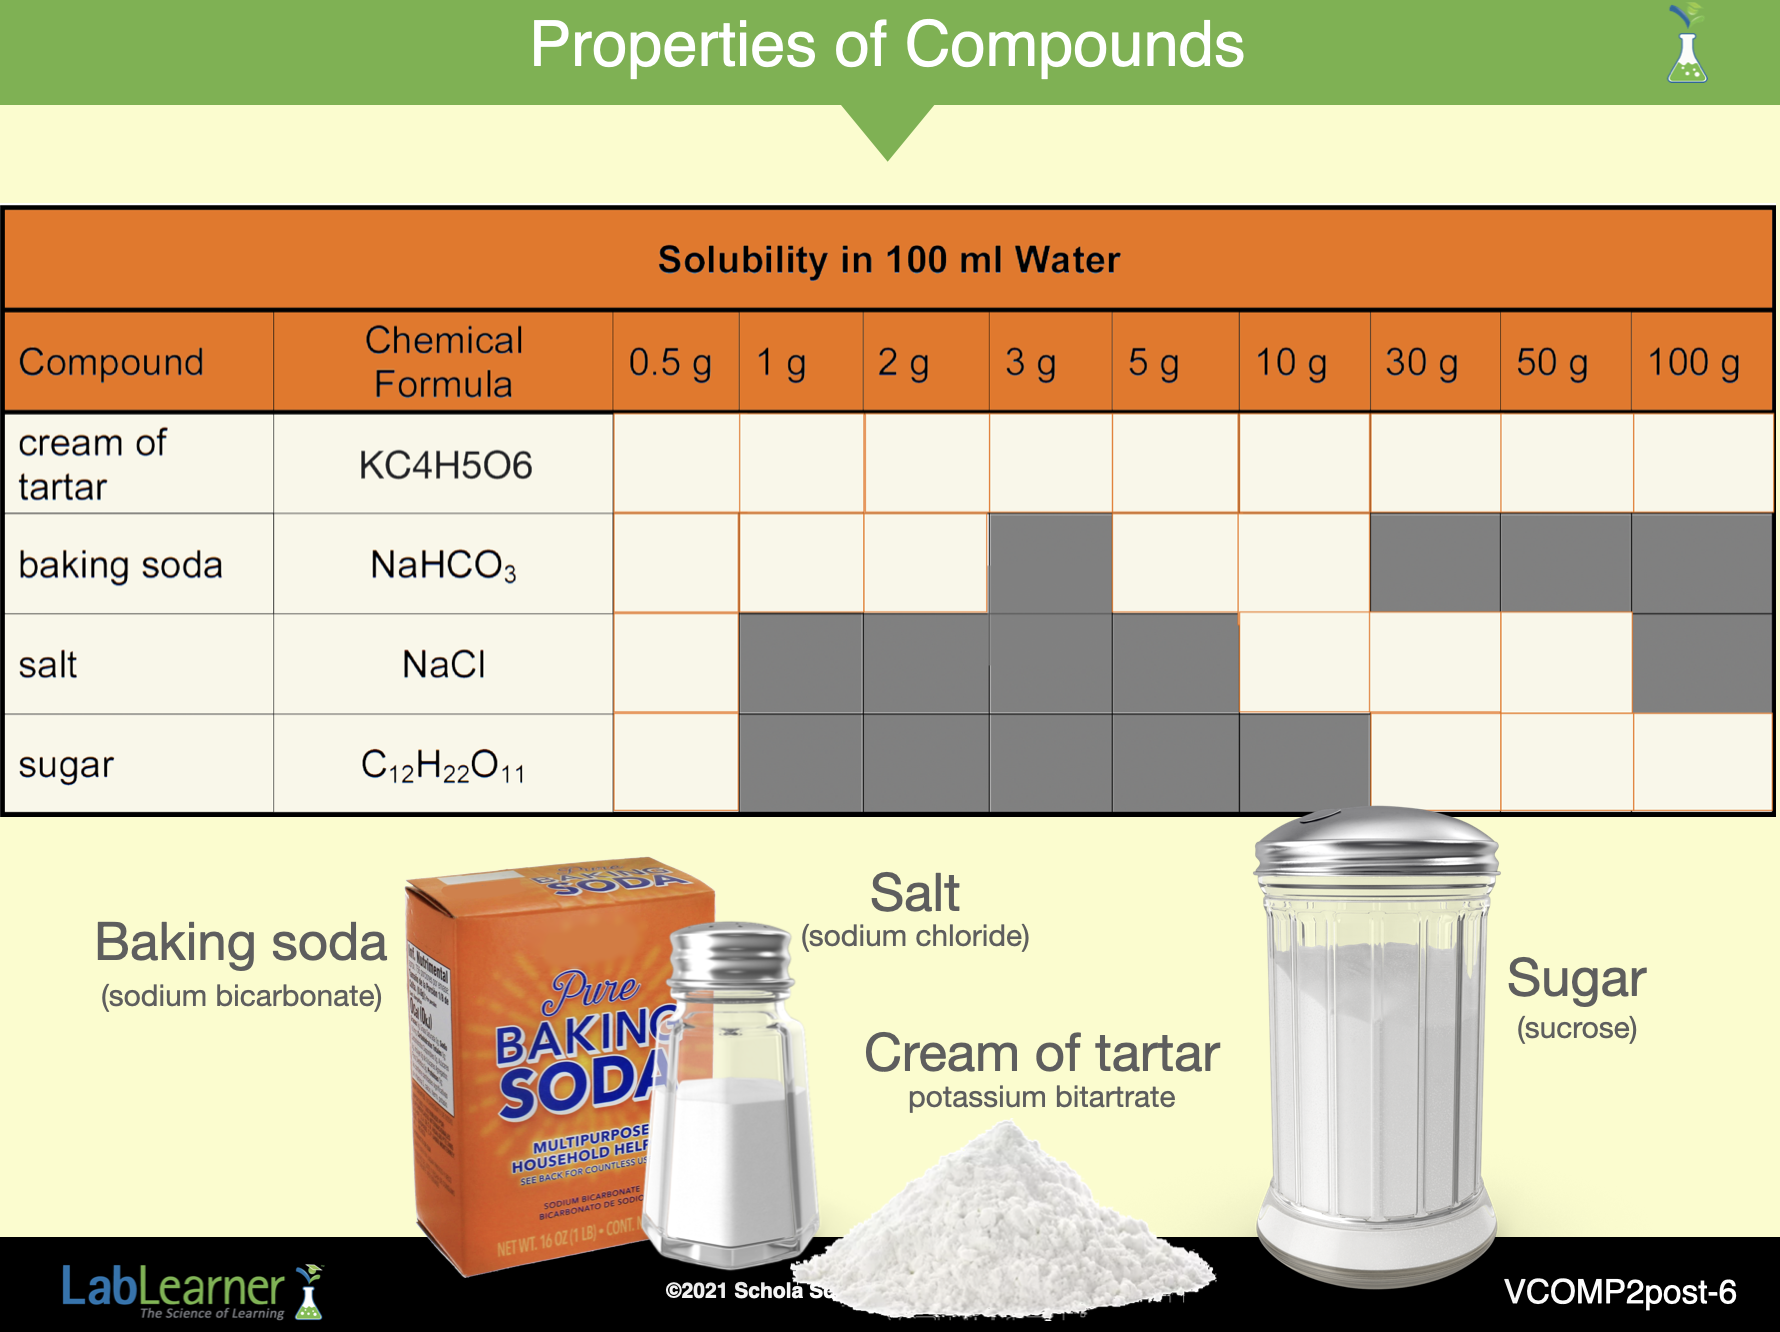
1. Instruct students to study the Table in Problem 9 of the Student Data Record.
Ask students: How can you estimate the saturation point of the compounds you tested? Student answers may vary. Students may realize that if they found a sample of a solute not soluble in 100 ml of water, they were at or above the saturation point. Students can then conclude that the saturation point is between the amount of solute that could be dissolved and the amount that could not.
a. Encourage students to look at the data collected for cream of tartar.
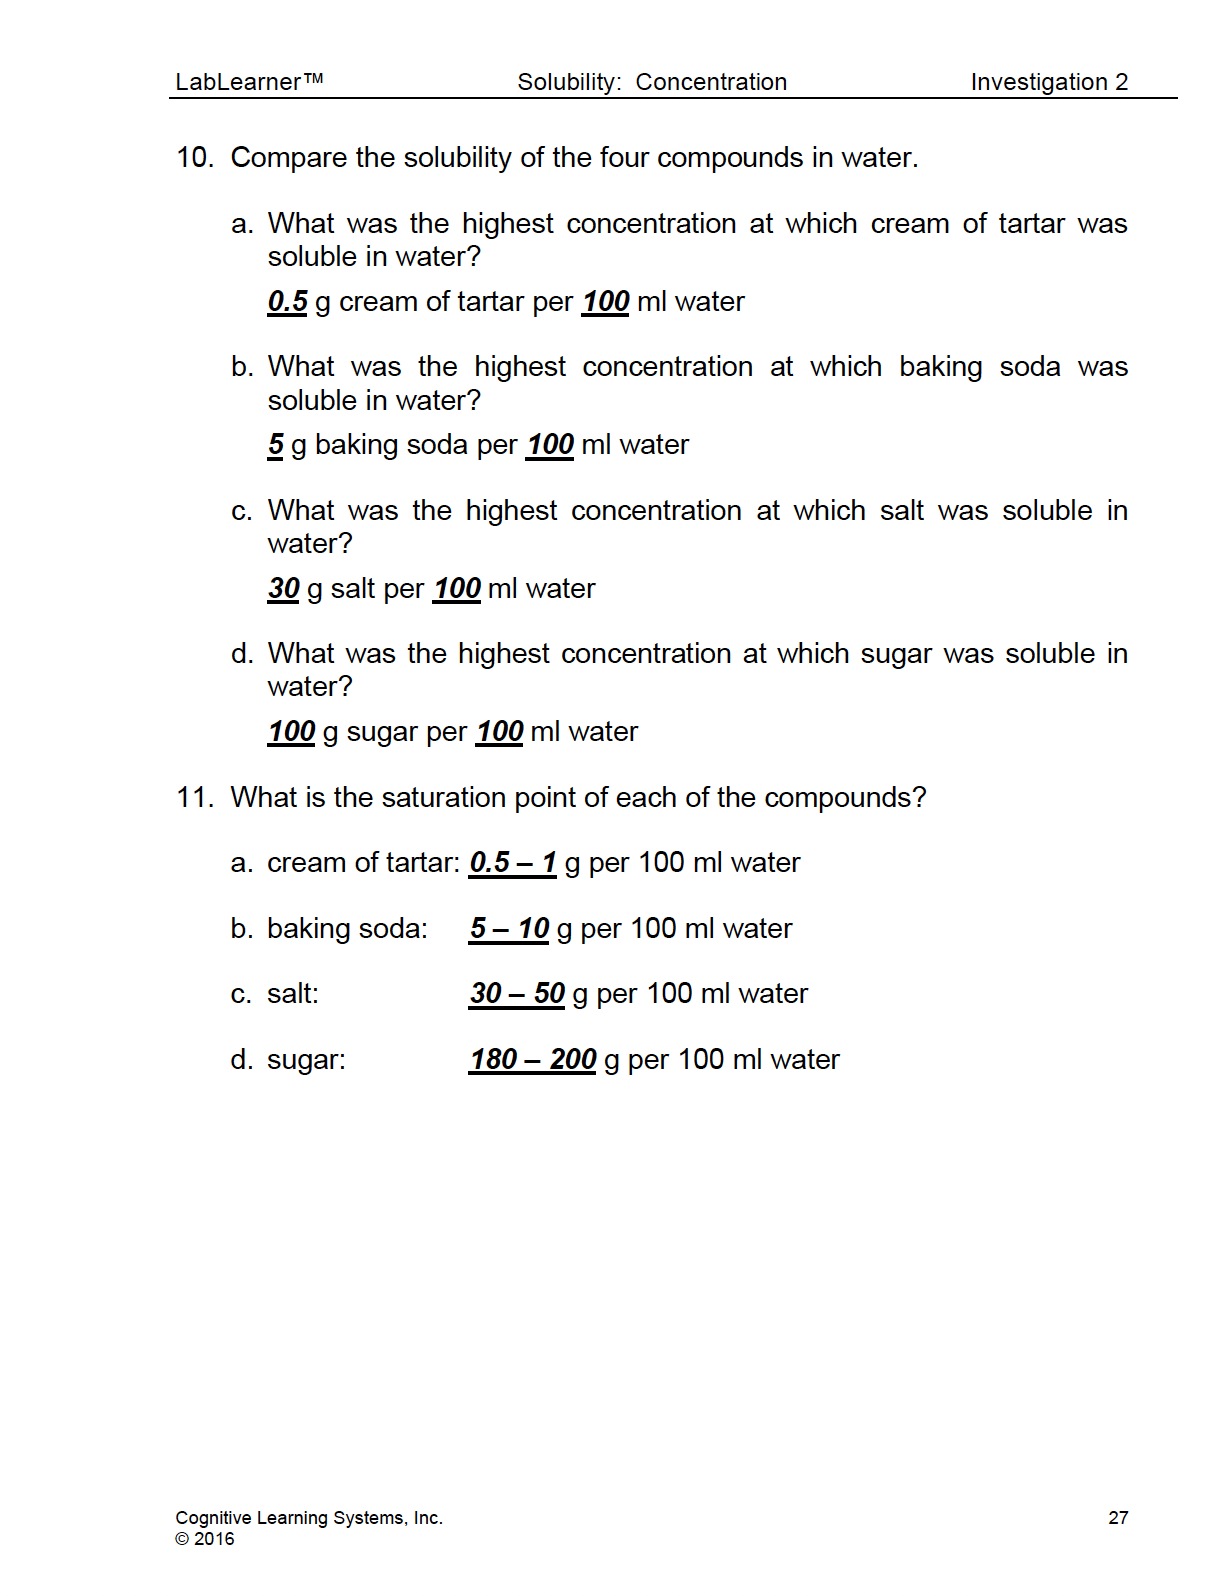
Ask students: Based on the data, what would be an estimate of the saturation point of cream of tartar at room temperature? The saturation point for cream of tartar at room temperature is between 0.5 g and 1 g per 100 ml of water. Instruct students to record their answers in Problem 11a of their Student Data Record.
b. Ask students: What would be a good estimate of the saturation point of baking soda at room temperature? The saturation point for baking soda at room temperature is between 5 and 10 g per 100 ml water. Instruct students to record their answers in Problem 11b of their Student Data Record.
c. Ask students: What would be a good estimate of the saturation point of salt at room temperature? The saturation point for salt at room temperature is between 30 and 50 g per 100 ml of water. Instruct students to record their answers in Problem 11c of their Student Data Record.
d. Ask students: What would be a good estimate of the saturation point of sugar at room temperature? Student answers may vary.
-
- Encourage students to realize that they do not know the saturation point of sugar because all four samples of sugar dissolved in 100 ml of water.
e. Ask students: How could you determine the saturation point of sugar? Student answers may vary. By attempting to dissolve increasing amounts of sugar in 100 ml of water, students would eventually observe some sugar unable to dissolve, evidence that the point of saturation had been reached.
f. Tell students that the point of saturation for sugar at room temperature is approximately 180 to 200 g per 100 ml water. Instruct students to record this value in Problem 11d of their Student Data Record.
g. Ask students: Each of the values you gave was an estimate of the saturation point of the compounds because it was a value between two samples of solute. How do you think you could determine the exact saturation point of each of the compounds? Think about the method you used in the lab to determine your estimate. Students should suggest that they could apply a similar technique to that used to estimate the saturation point. For example, if the saturation point was between 30 g and 50 g of salt in 100 ml of water, students could try dissolving several salt samples between these masses into the water, such as 35 g, 40 g, and 45 g. If, after observation, they found that 30 g of salt dissolved but not 35 g, they could apply the same technique again, using smaller masses: 31 g, 32 g, 33 g, and 34 g, and observing whether each sample completely dissolved in the water. The same technique could be applied again using even smaller increments of masses (30.1 g and 30.5 g ) until the exact saturation point was identified.
2. Ask students to study the table and the chemical formulas for each compound.
Ask students: Do the compounds containing similar elements have similar saturation points? No. All compounds had different saturation points. Cream of tartar had a lower saturation point than sugar, even though both contain carbon, hydrogen, and oxygen. Baking soda had a lower saturation point than salt, even though both contained sodium.
3. Ask students: Do the compounds containing different elements have different saturation points? Yes, all of the compounds had different saturation points, both those that contained the same elements and those that contained different elements.
______________________________________________
SLIDE VCOMP2-post-7
G. Allow students to apply their knowledge of saturation by analyzing a graph that displays the saturation points of three compounds.
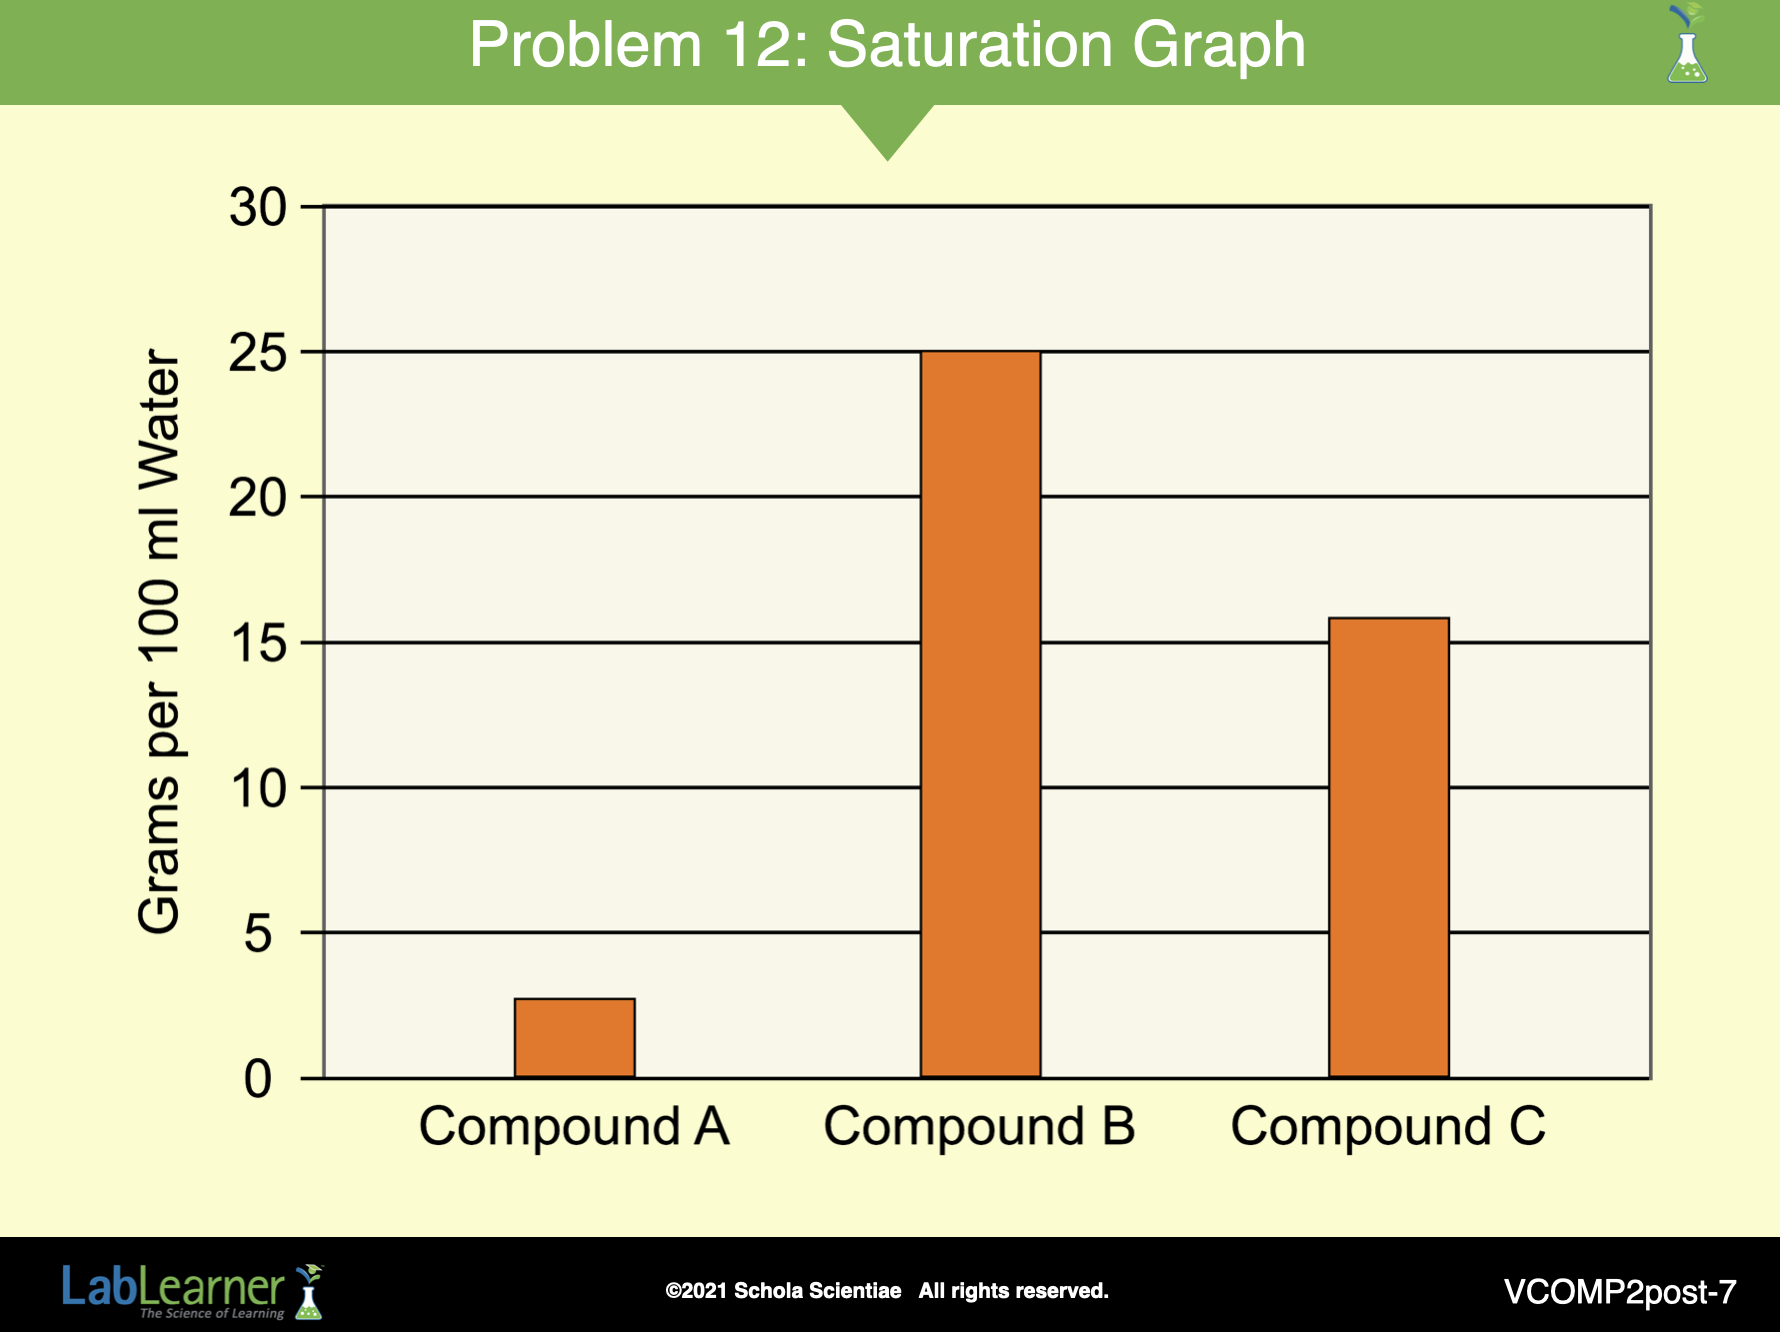
1. Direct students to refer to Problem 12 of the Student Data Record and point to the Saturation Graph on this slide.
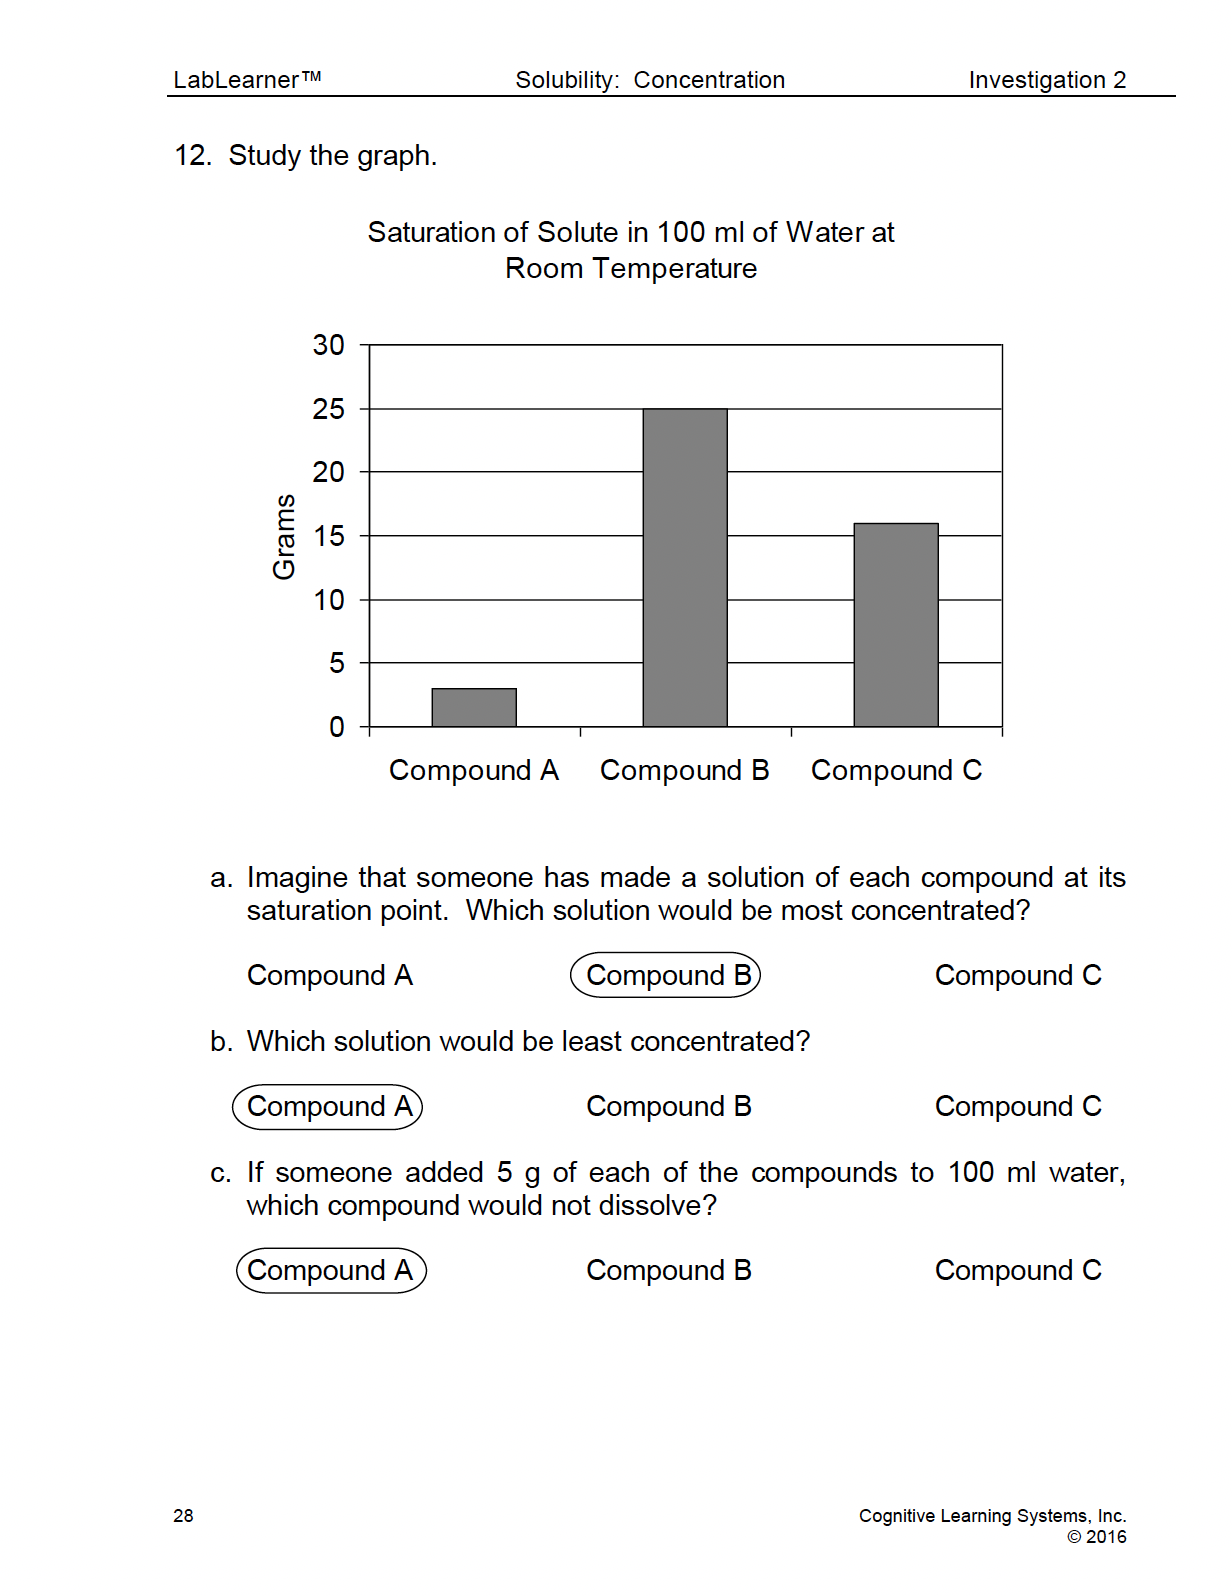
2. Encourage students to study the graph. Explain to students that the graph presents data concerning the saturation points of three different compounds at room temperature in 100 ml of water.
3. Divide the class into pairs of students. Ask each pair to look at the graph and begin to answer the questions recorded in Problems 12a – 12c. After students have had sufficient time to formulate their answers, review the three questions as a class.
a. Ask students: Imagine that someone has made a solution of each compound at its saturation point. Which solution would be most concentrated? A solution created using Compound B would be most concentrated because it contains 25 grams of compound per 100 ml of water. A solution containing Compound A would contain only about 3 grams of compound per 100 ml of water, and a solution containing Compound C would contain only 16 grams.
b. Ask students: Which would be the least concentrated? A solution containing Compound A would be least concentrated because it contains only 3 grams of compound per 100 ml water, less than that of Compound B or C.
c. Ask students: If someone added 5 g of each of the compounds to 100 ml water, which compound would not dissolve? Compound A would not dissolve because its saturation point is less than 5 g per 100 ml of water. However, Compounds B and C would dissolve because their saturation points are greater than 5 g per 100 ml of water.
______________________________________________
SLIDE VCOMP2-post-8
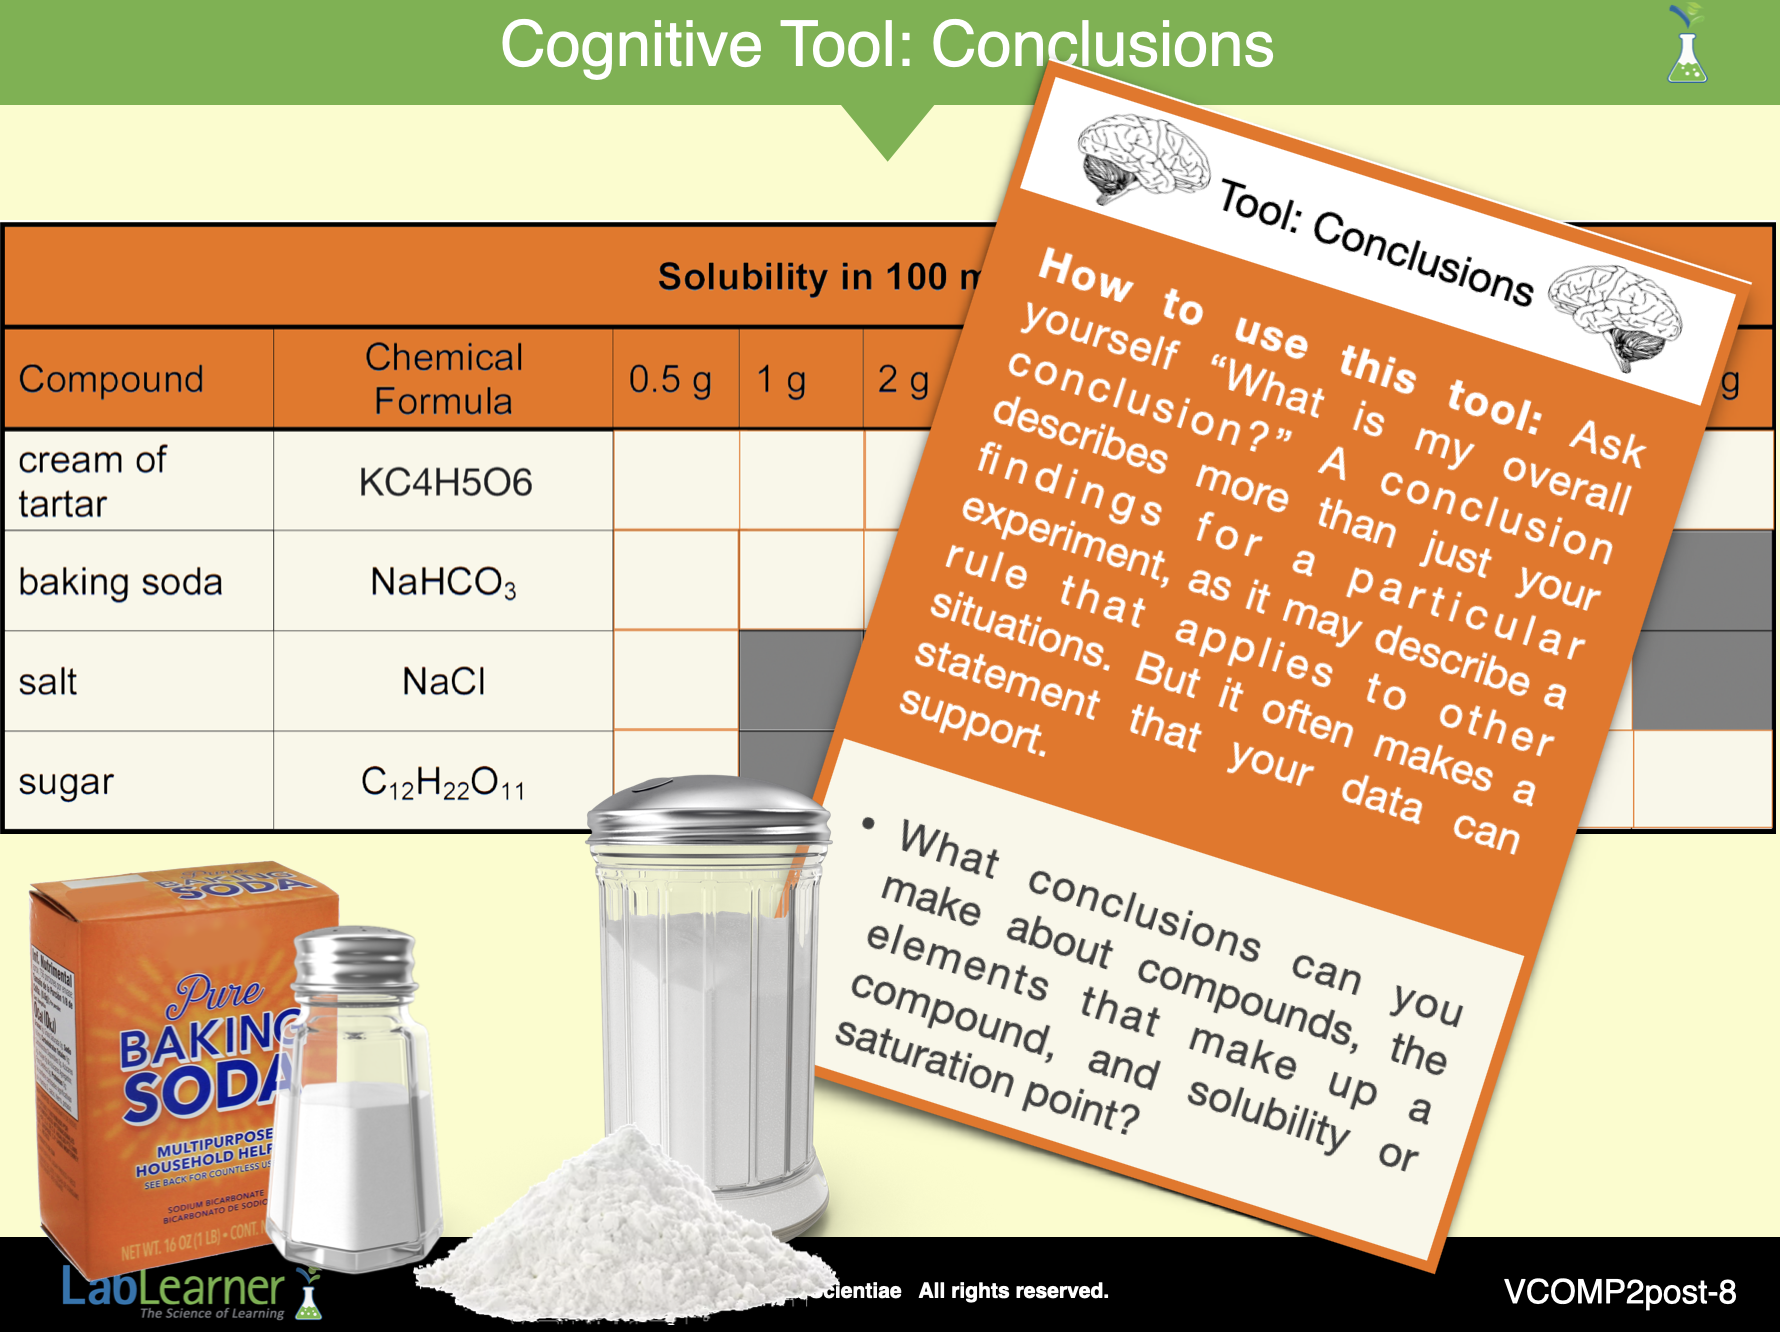
H. To conclude this Investigation, ask students to reflect on the results of their Trials and answer Problem 13 of the Student Data Record.
1. Allow students sufficient time to recall their Trials and record their answers.
2. After students have recorded an answer,
Ask students: If all of the compounds you tested had different levels of solubility, what determines solubility or the saturation point of a compound? What conclusions can you make about compounds, the elements that make up a compound, and their solubility or saturation point? Solubility and saturation point vary based on the chemical makeup of a compound. In other words, the unique combination of elements and the number of atoms of each element determine the solubility and saturation point of a compound in a solvent. Different compounds may have different levels of solubility and different saturation points in a solvent because of their unique combination of elements.
3. Tell students that during Investigation Three, they will continue to explore the property of solubility and determine what influence stirring and temperature have on the solubility of a compound.
KEYS: POSTLAB