Teacher Portal:
Science and Art
Investigation 2 – PostLab
 PRINT IT
Use your browser to download a printable PDF as help during the slide presentation and to make additional notes. In your browser, go to File > Print and then choose to save as PDF.
NAVIGATE IT
Once the slide presentation is launched
- use your left and right arrows to advance or go back in the slide presentation, and
- hover your mouse over the left edge of the presentation to get a view of the thumbnails for all the slides so that you can quickly move anywhere in the presentation.
- Click HERE to launch the slide presentation for the CELL.
SHARE IT

SLIDE VART2post-1
This was the second Investigation of the LabLearner CELL Science and Art. In it, students continued the exploration of perspective and the illusion of depth in paintings.
______________________________________________
SLIDE VART2post-2
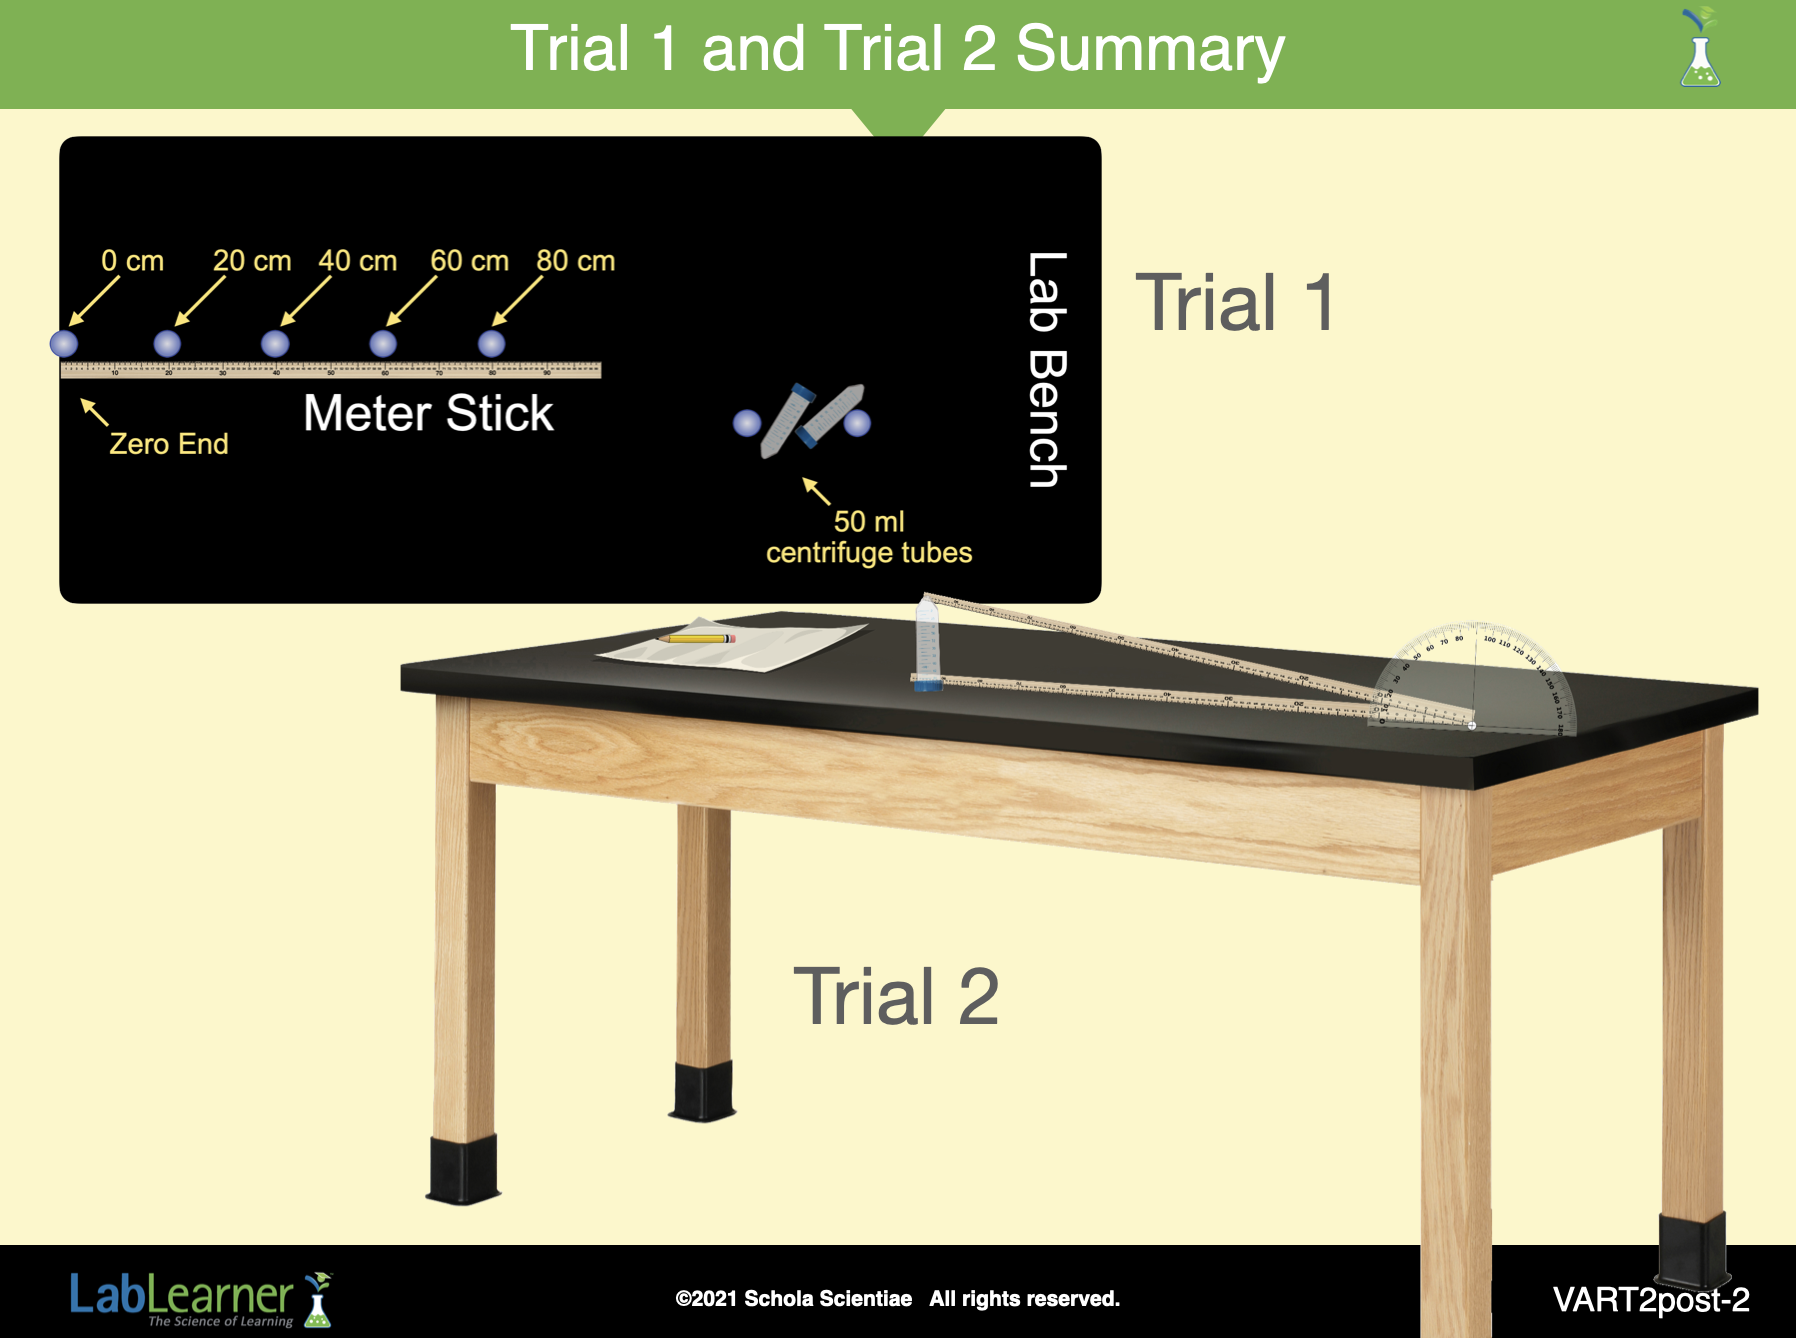
A. Begin this part of the Investigation by encouraging students to summarize their activities in Lab. Prompt student discussion by posing the following questions:
1. Ask students: What were the main questions we wanted to investigate in this lab? Students should indicate that the questions were: Does the distance from which an object is viewed change its appearance? What is the relationship between the distance from an object and how its height appears?
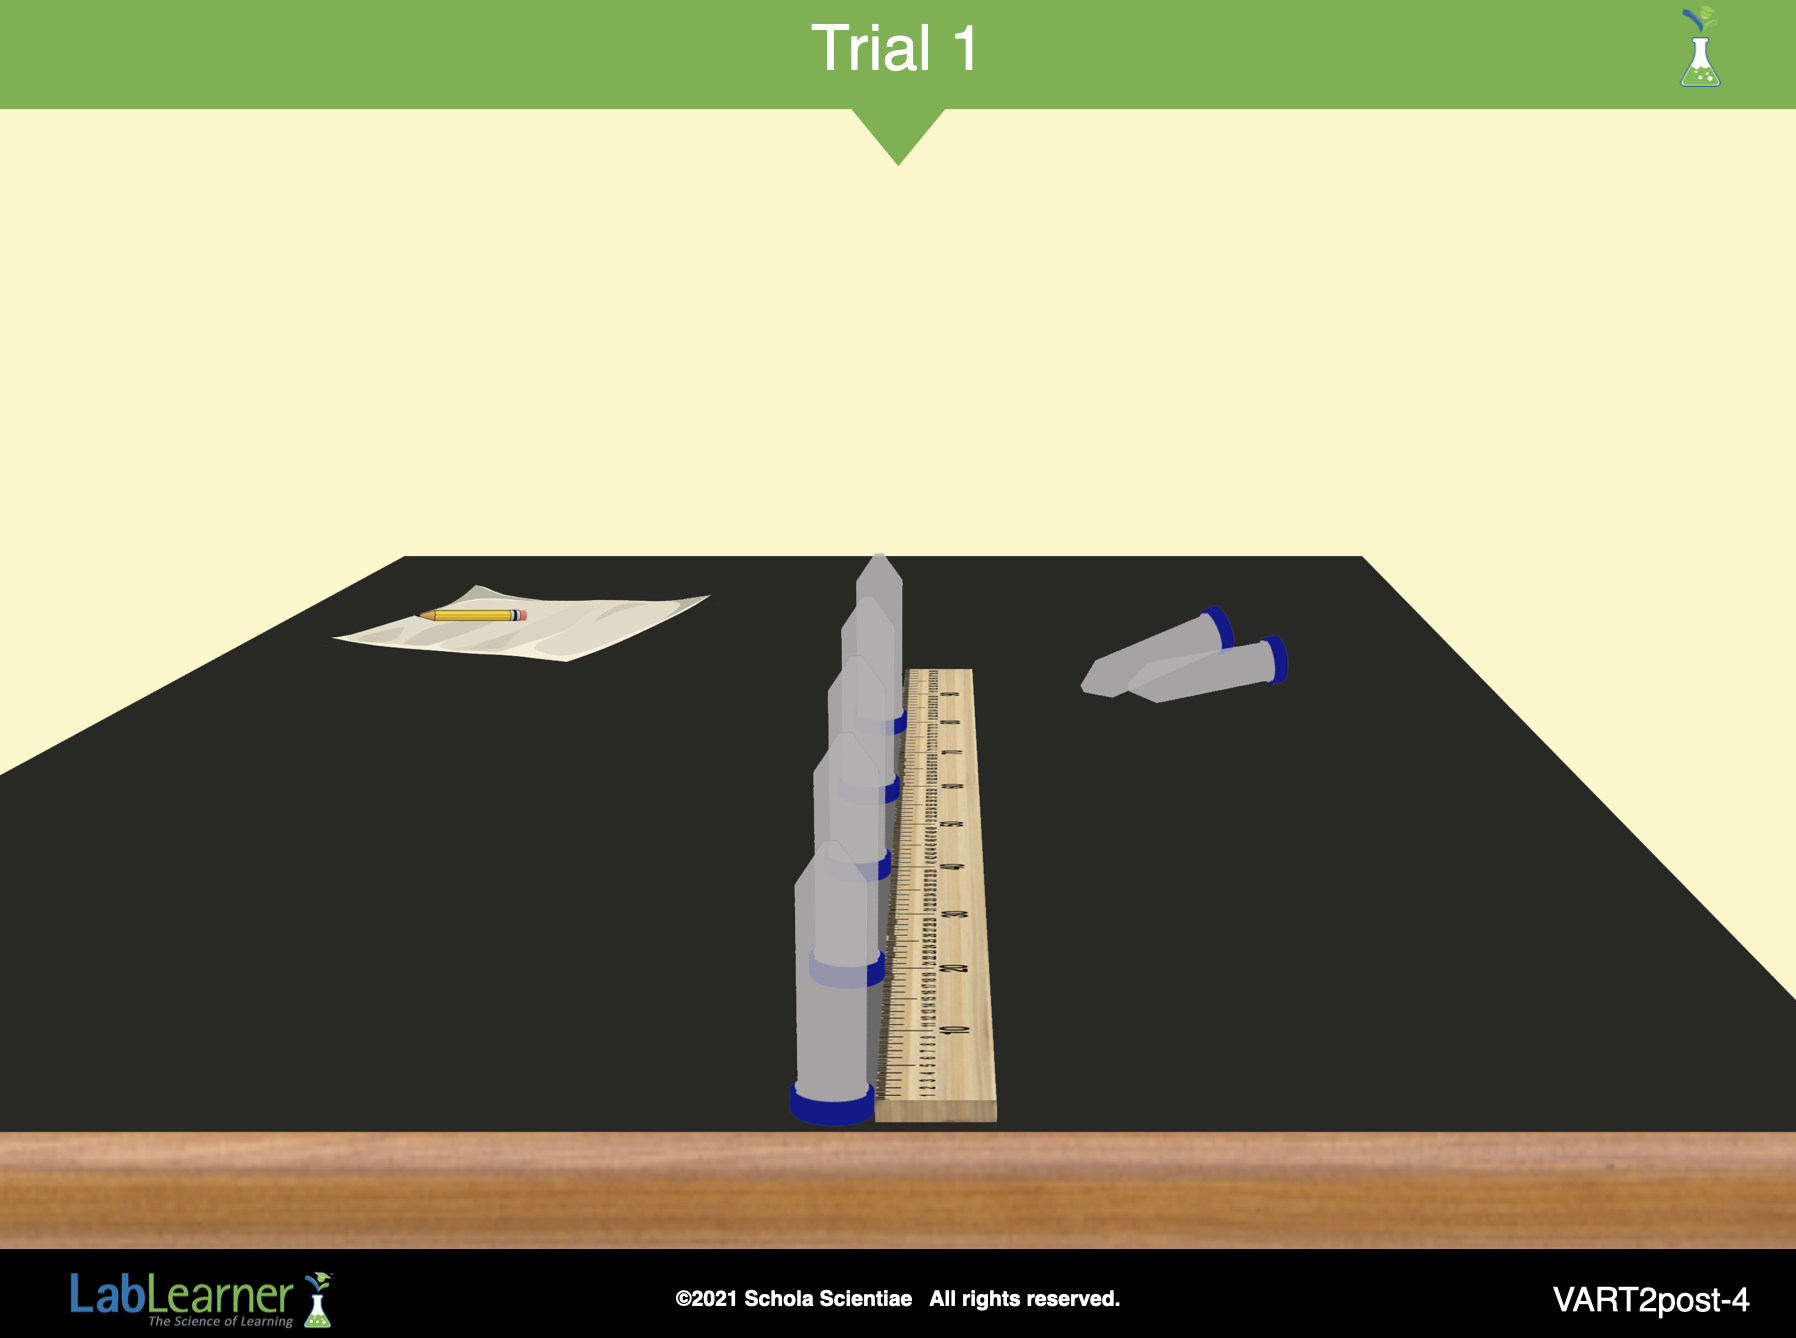
2. Ask students: How would you summarize the types of experiments that you performed to investigate these questions? Students should indicate that in Trial 1, they placed a meter stick on the lab table. The 0 cm end of the meter stick was at the end of the table and approximately 30 centimeters from their eyes. They then measured the height and width of a centrifuge tube when it was placed at the 0, 20, 40, 60, 80, and 100-centimeter marks. In Trial 2, they measured the visual angle or the angle at which light would enter their eyes when the centrifuge tube was at the 0, 20, 40, 60, 80, and 100-centimeter marks.
______________________________________________
SLIDE VART2post-3
B. Begin the analysis of the experiment by encouraging students to review and organize their data from Trial 1.
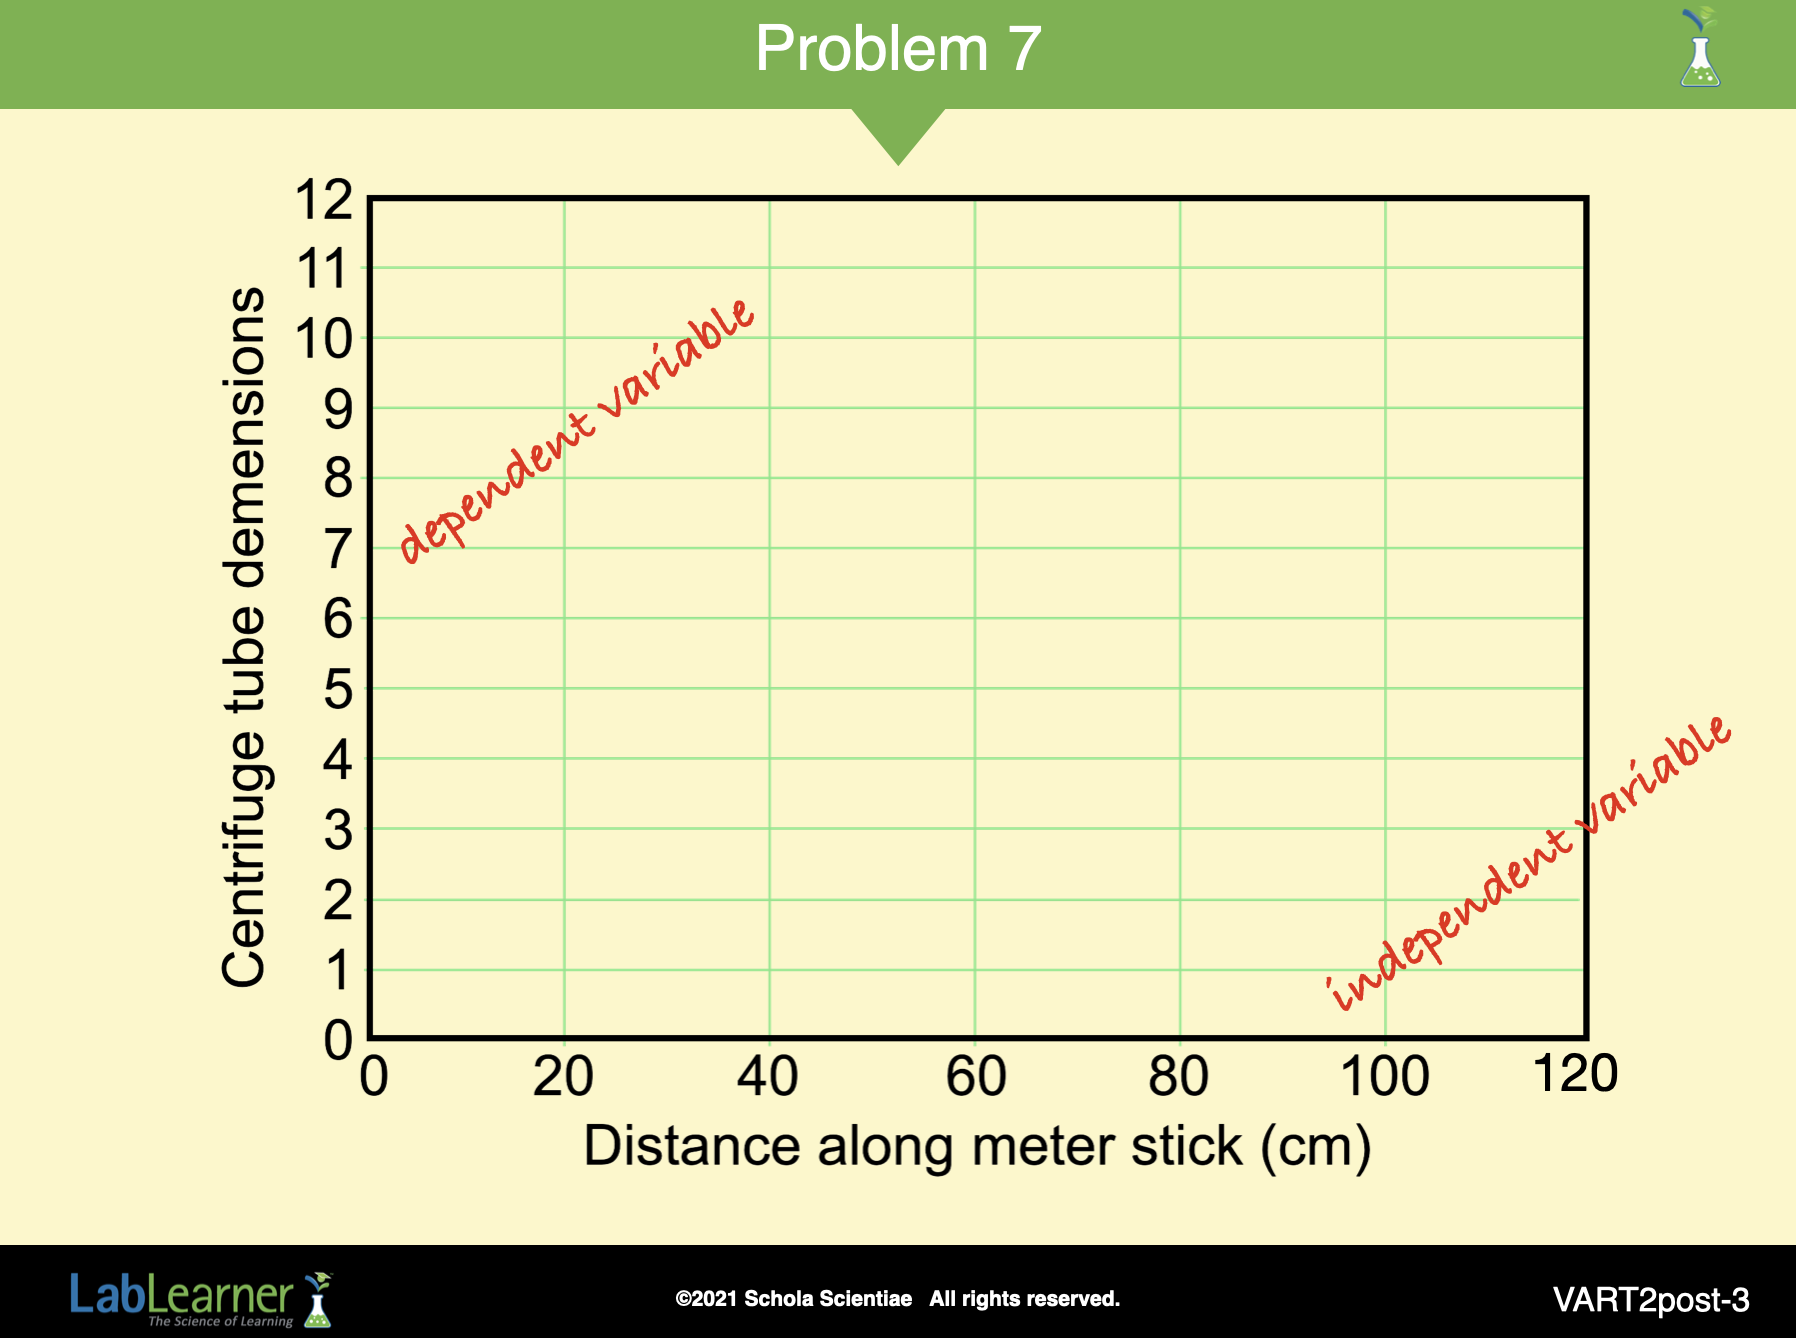
1. Begin by telling students to locate Problem 7 in their Student Data Record. This question asks students to graph their results from Trial 1. As students approach this problem, they should first locate Table A in their Student Data Record. Table A includes all the data they recorded from Trials 1 and 2 in Lab.
2. Encourage students to think about the process involved in completing a line graph. Students may benefit from a review of the steps from the Procedural Toolbox. A quick summary of some of these steps is provided below.
a. Notice that grid with lines and an x and y axis is already present in Problem 7 in the Student Data Record. The x-axis is the horizontal axis, and the y-axis is the vertical axis.
b. Evaluate the data. Determine which variable you will plot along each axis. When plotting values of different categories, scientists typically place the category that they changed along the x-axis and the value that they measured along the y-axis. Notice that where you placed the centrifuge tube is along the x-axis. This is what you changed in the experiment (independent variable). The dimensions of the centrifuge tube (height and width) are placed along the y-axis. This is what you measured in the experiment (the dependent variable). It is called the “dependent” variable because changes in it depend on changes you make to the independent variable in the experiment.
c. Determine the beginning and ending numbers you will plot on the x-axis and y-axis. The beginning and ending numbers should be selected so that you can plot all of the points on the graph. Notice that the x and y-axis begin with zero (0). The x-axis ends with the number 120 so that the points 0 to 100 cm can all be plotted on the graph. The y-axis ends with the number 12 because it is greater than the greatest measurement recorded for height.
d. The scale for each axis has already been determined in your Student Data Record. For the x-axis, each line represents a change of 20 centimeters. For the y-axis, each line represents a change of 1 centimeter.
3. Once students have familiarized themselves with the grid, encourage them to work independently or in pairs to plot the data from Trial 1 on the graph. Students will likely find it easier to plot one dimension at a time. For example, plot the points for the change in width and connect those points with a solid line. Then plot the points for the change in height and connect those points with a dotted line.
______________________________________________
SLIDE VART2post-4
4. When students have finished their graphs, ask a student volunteer to draw his or her graph on the board. Discuss the completed line graph with the class.
 a. Look at the x-axis on the graph. Begin on the left side:
Ask students: What happens to the distance from the eye as you move from left to right? The units increase in magnitude.
b. Look at the y-axis on the graph. Begin at the bottom:
Ask students: What happens to the units of height or width as you move from the bottom to the top of the graph? The units increase in magnitude.
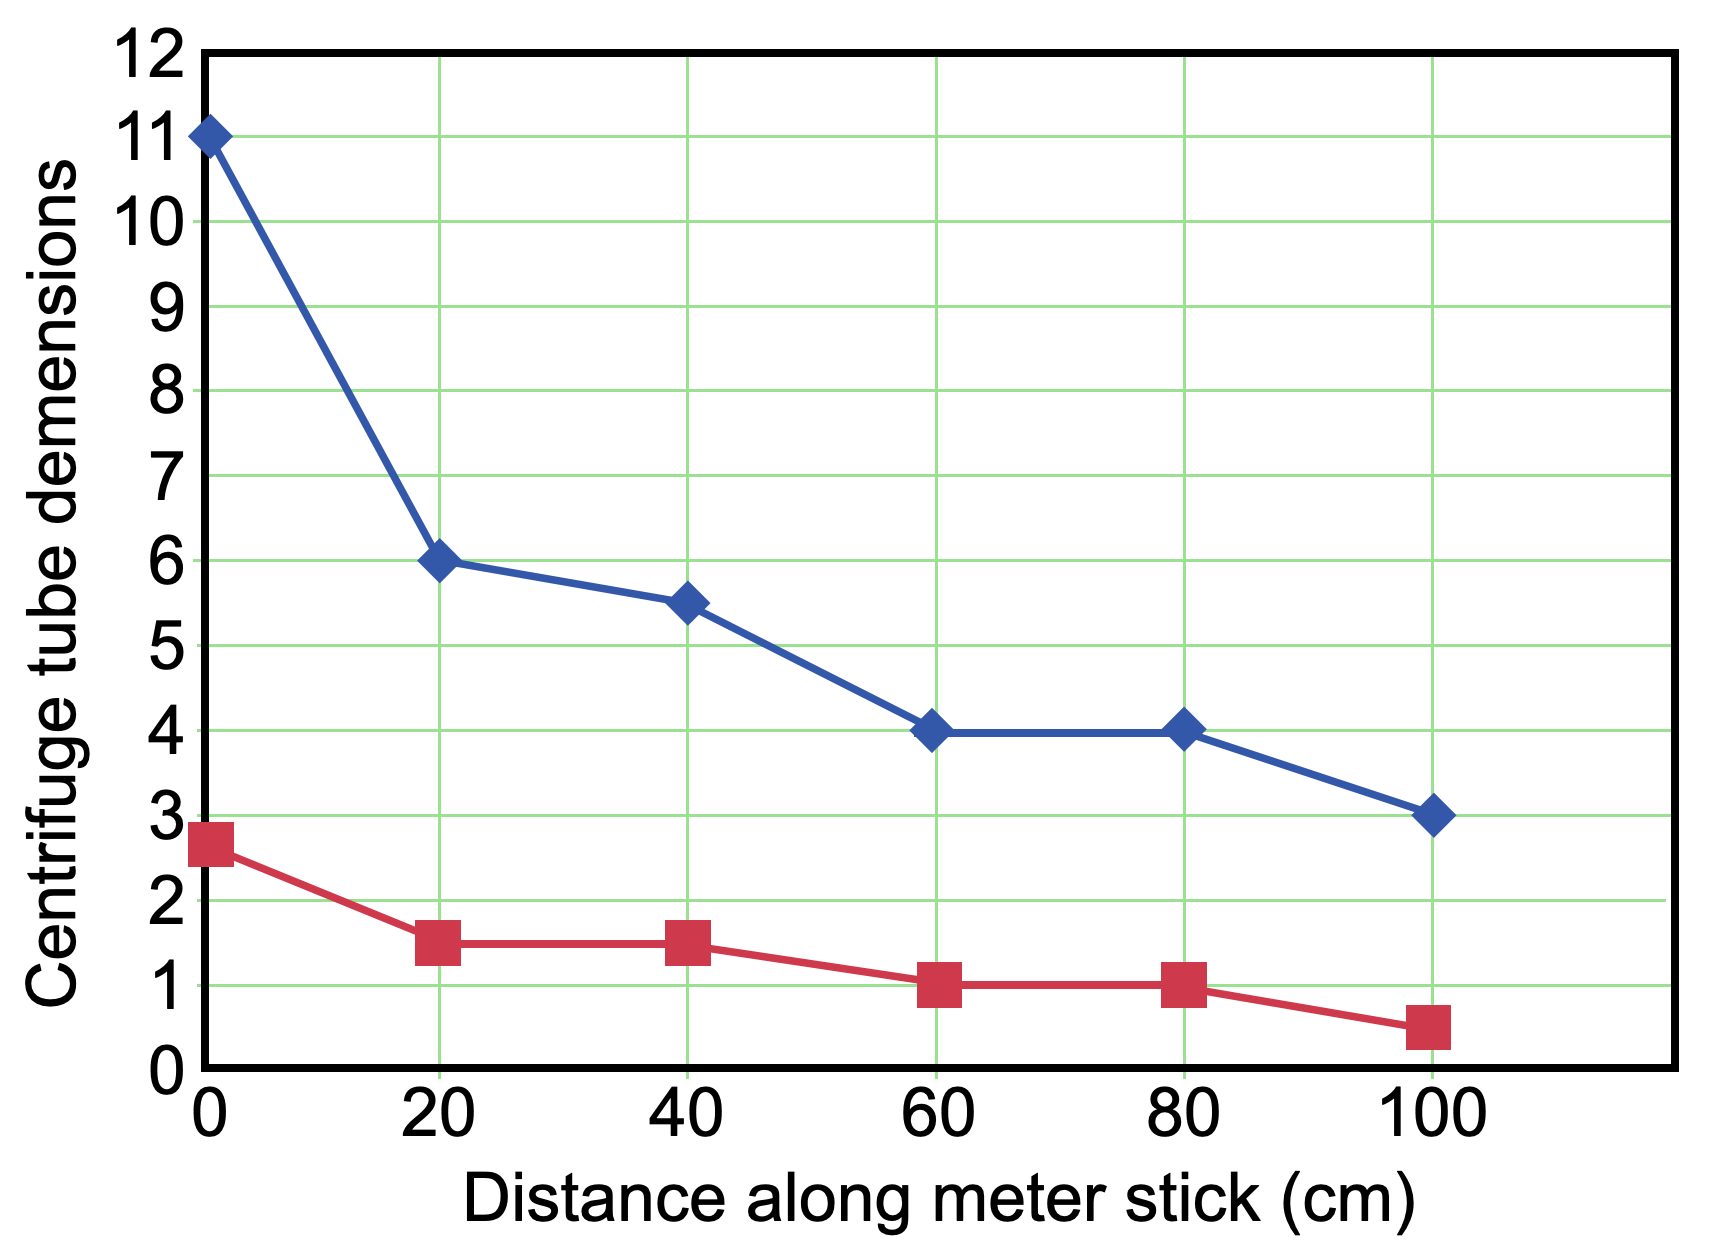
c. Focus on the width of the centrifuge tube. For each measurement of distance along the x-axis, you plotted a point along the y-axis that corresponded to the width of the centrifuge tube. Look at the line that connects the points.
Ask students: Does it go up or down? It goes down.
d. Ask students: What happened to the width when the distance from the eye increased? As the distance from the eye increased, the width of the centrifuge tube decreased.
e. Next, focus on the height of the centrifuge tube. For each measurement of distance along the x-axis, you plotted a point along the y-axis that corresponded to the height of the centrifuge tube. Look at the line that connects the points.
Ask students: Does it go up or down? It goes down.
f. Ask students: Can you describe what happened to the height of the centrifuge tube when the distance from the eye increased? As the distance from the eye increased, the height of the centrifuge tube decreased.
g. Look at the lines for the height and width of the centrifuge tube.
Ask students: What do you notice about the shape of the lines? Are they very different shapes? Are they similar? Are they almost parallel? The lines are almost parallel. They are very similar in shape.
h. Ask students: The lines for the change in the width and height of the centrifuge tube are parallel at almost all points. What do you think this tells you about how the object’s width and height change in relation to each other? The lines show the same trend for the height and width of the centrifuge tube as the viewing distance from the tube increases. This indicates that the height and width of the centrifuge tube change in proportion to each other.
i. Ask students: Why do you think this is important? Because the height and width change in proportion to each other, the object’s identity is maintained as the viewing distance changes. In other words, the object is not significantly distorted. Thus, a car appears as a car when viewed at different distances. If this were not the case and the height and width did not change in proportion to each other, then the object would be distorted as the viewing distance changed. This would make it difficult to correctly identify objects when they were far as opposed to near the viewer.
______________________________________________
SLIDE VART2post-5
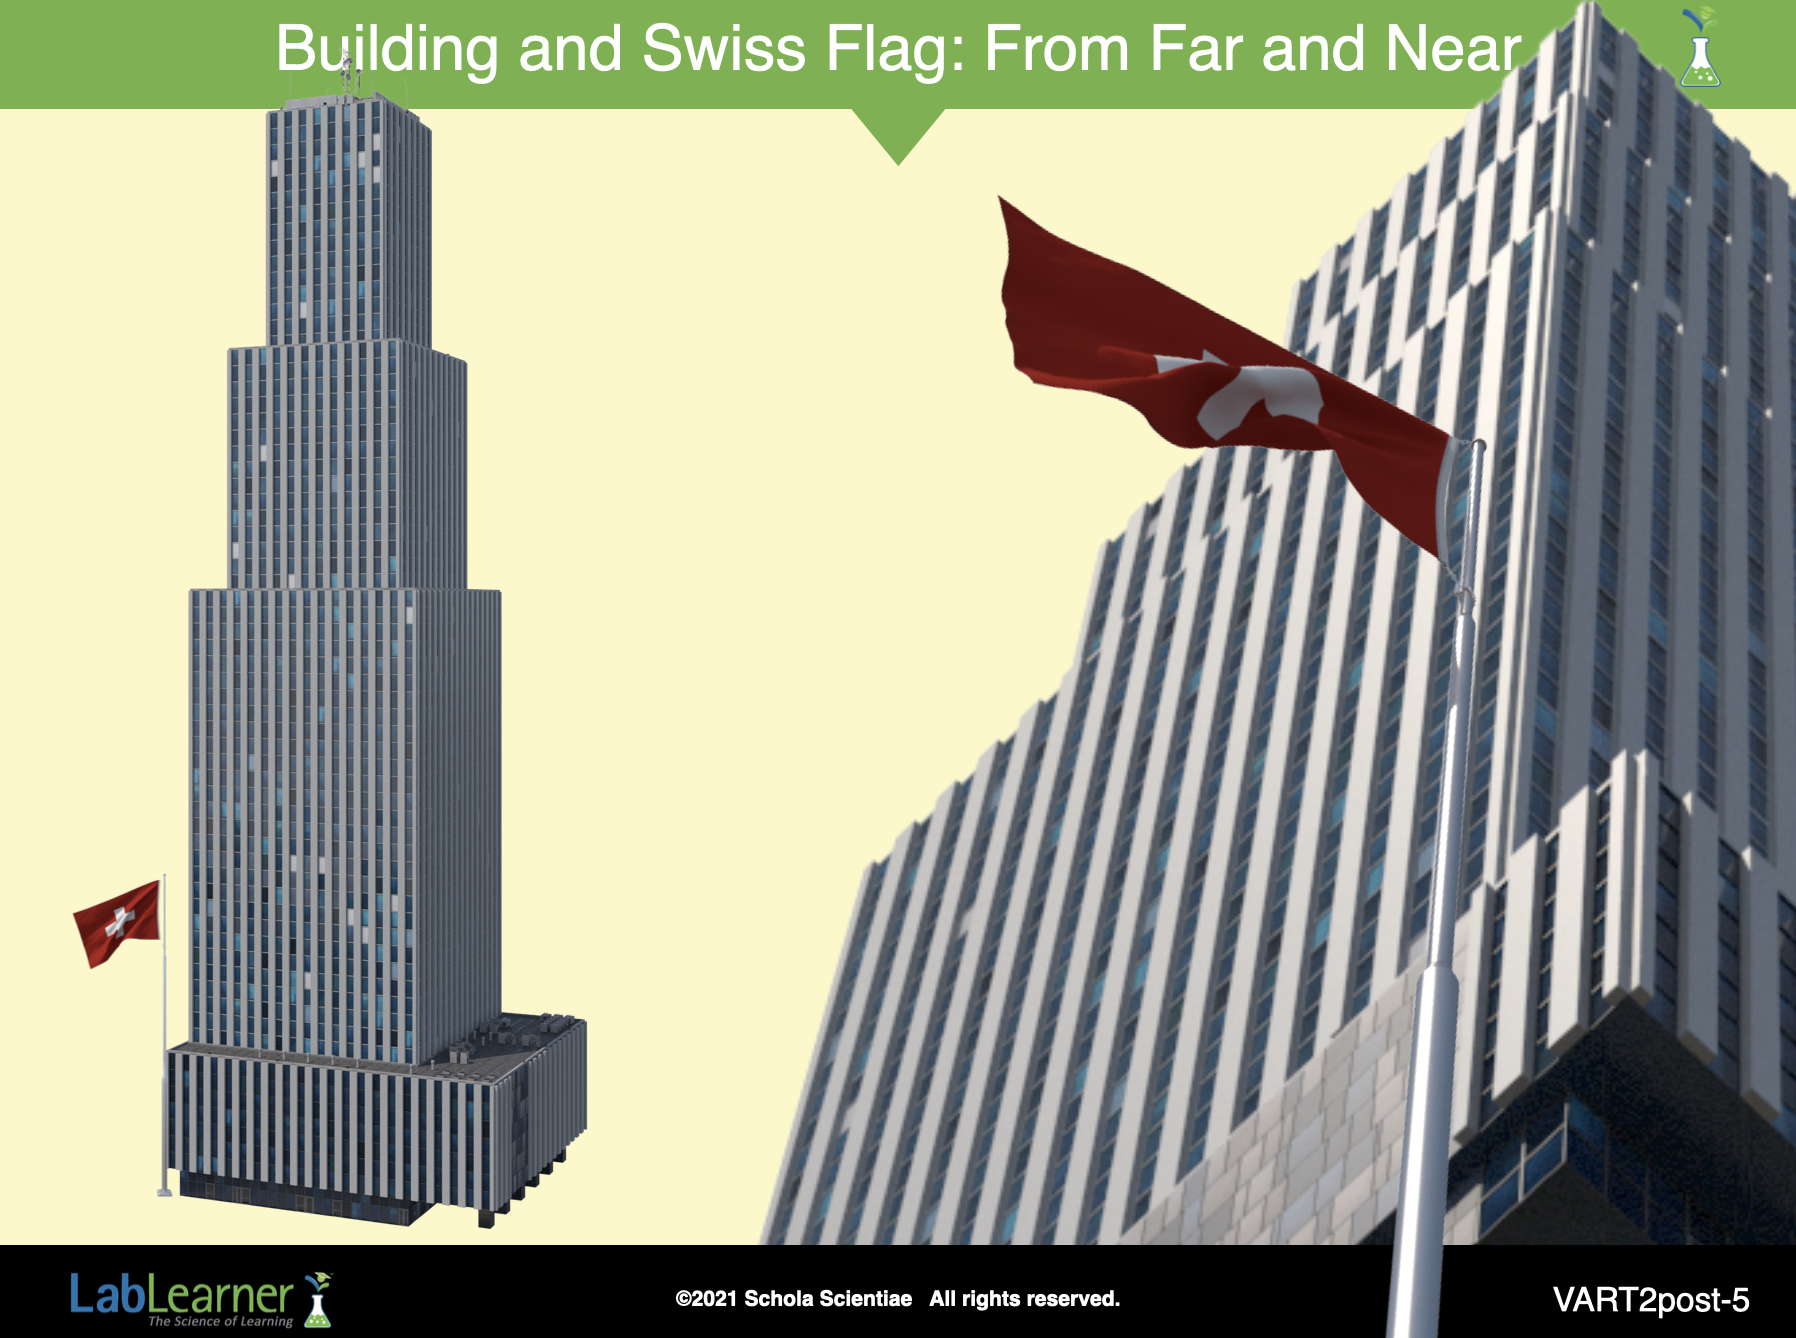
NOTE: There is a point at which some distortion will occur for some objects when viewed at very small visual angles. For example, imagine looking up at a skyscraper and flagpole from directly below (right side of the slide).
The overall shape of the building may appear slightly different than if the building were viewed from a farther away (left side of the slide). This is because the distance between the top and bottom of the building is greater than the distance between the viewer and the building. As a result, the top of the building has a smaller visual angle than the bottom because it is farther from the viewer than the bottom. However, this specific phenomenon involves small distances between the viewer and the object and very tall objects.
______________________________________________
SLIDE VART2post-6
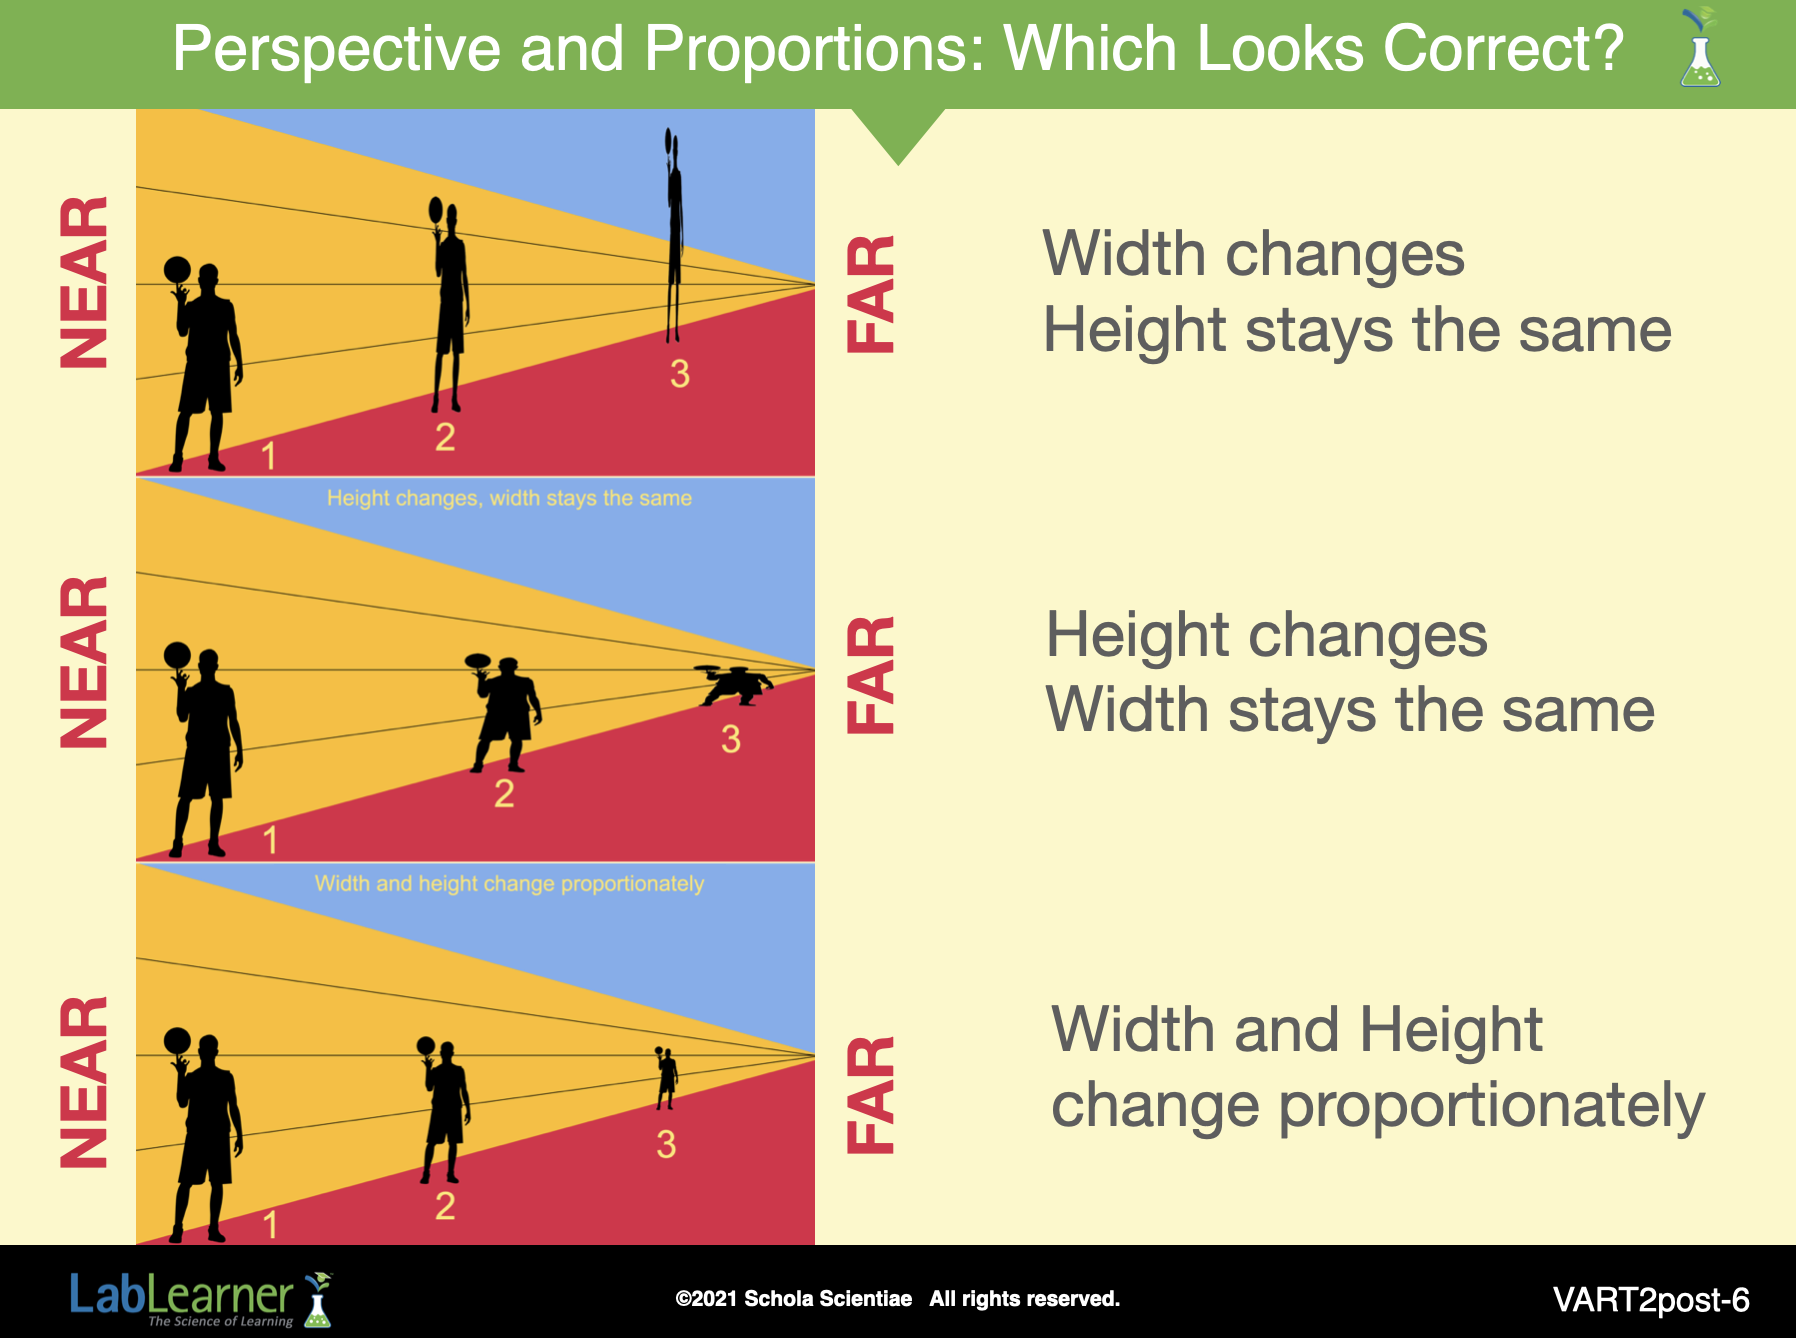
This and the following slide illustrated the importance of maintaining proportion when depicting three dimensions and distance on a 2-dimensional surface.
Notice how odd the three pictures look when the height and width of objects change as they appear to decrease into the distance. In the bottom illustration, the basketball player’s width and height decrease proportionately, making the player seem further away but still clearly recognizable.
______________________________________________
SLIDE VART2post-7
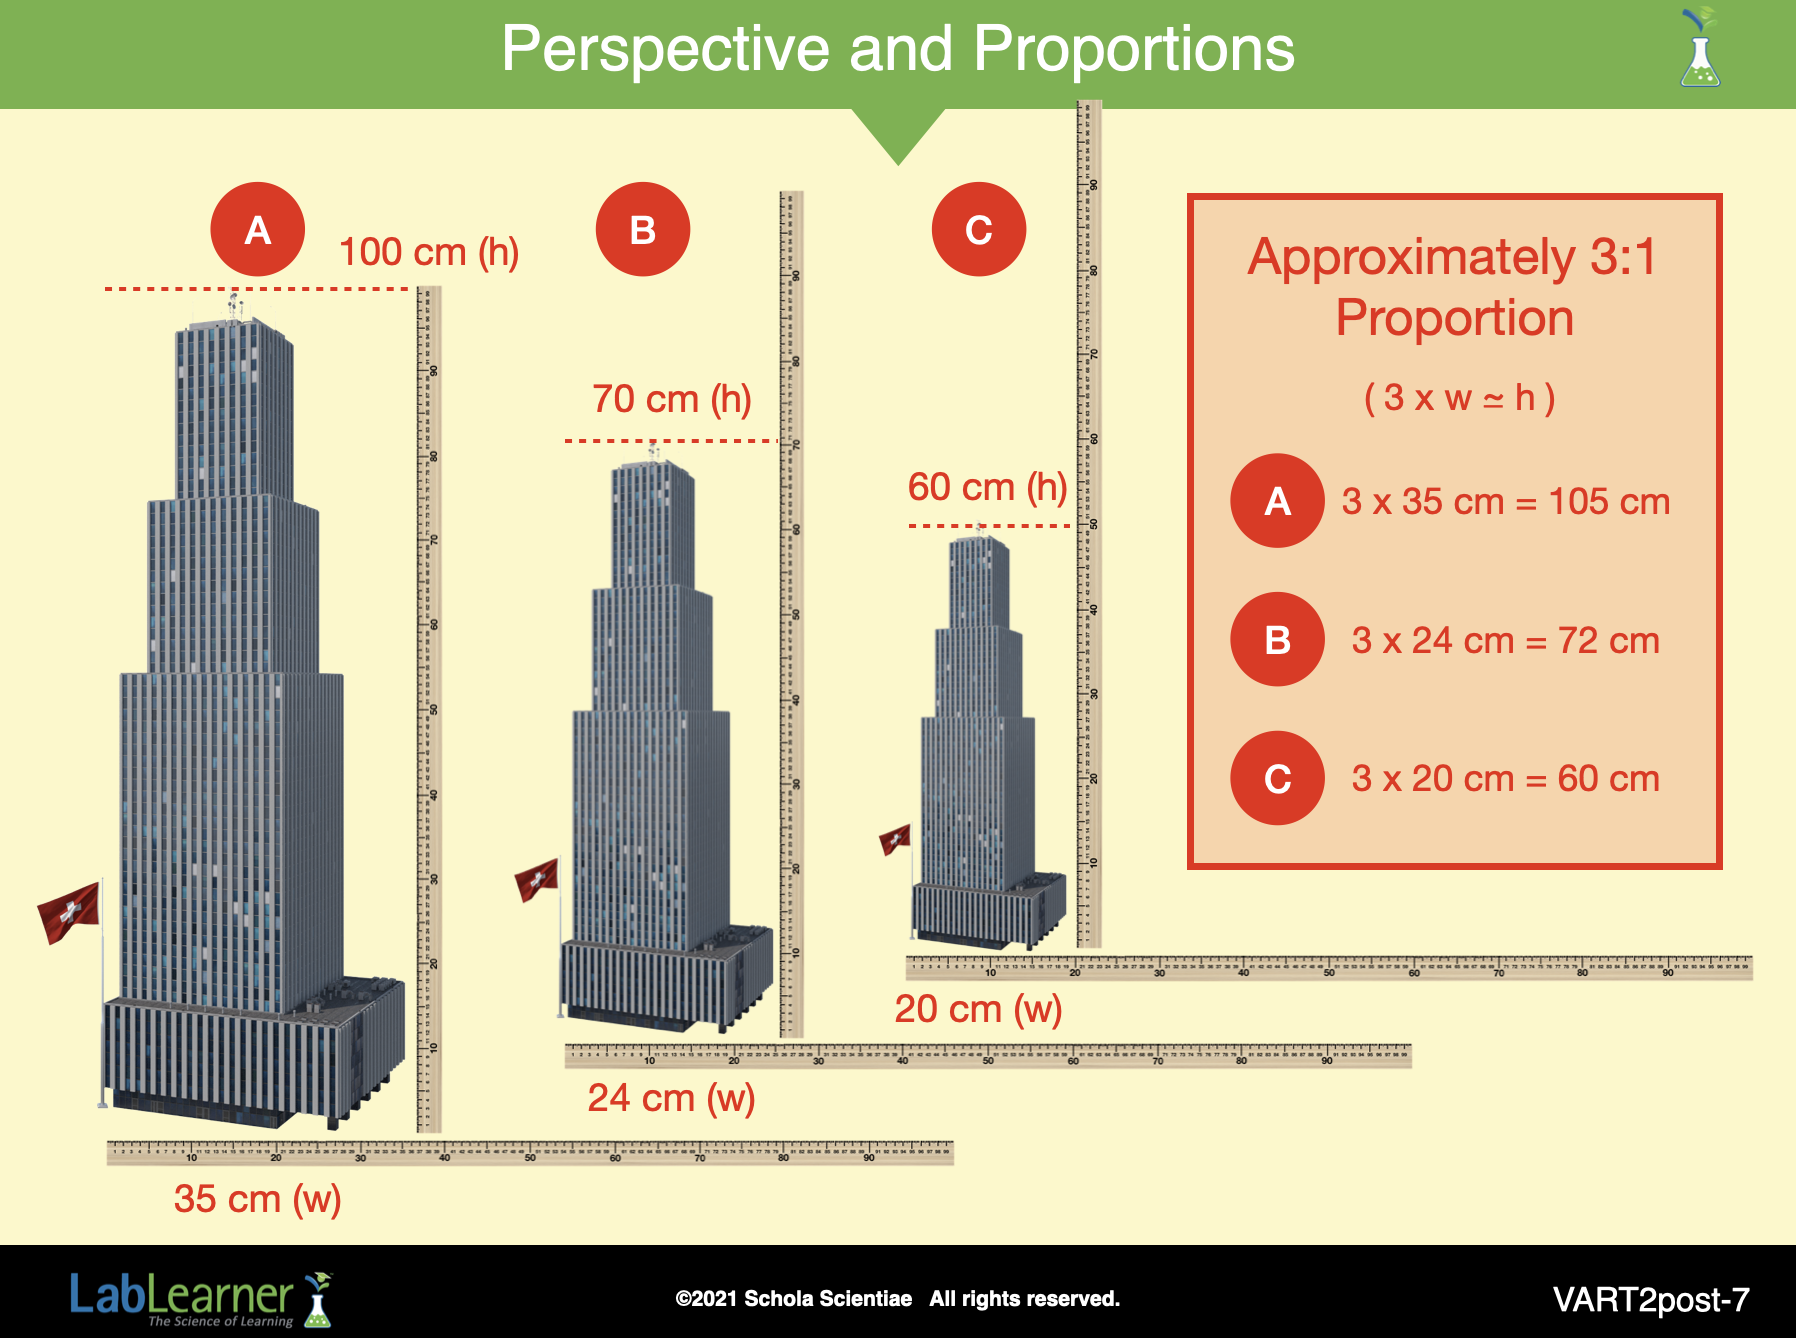
This slide further illustrates the importance of maintaining proportion when depicting three dimensions and distance on a 2-dimensional surface.
This slide introduces the simple mathematics of proportions. Thus, if we measure the height and width of skyscraper A, which appears visually closest to us, we find a ratio of approximately 3 to 1 (height to width, 3:1). Notice that this ratio is maintained as the building is reduced in size (B and C), creating the illusion of distance.
______________________________________________
SLIDE VART2post-8
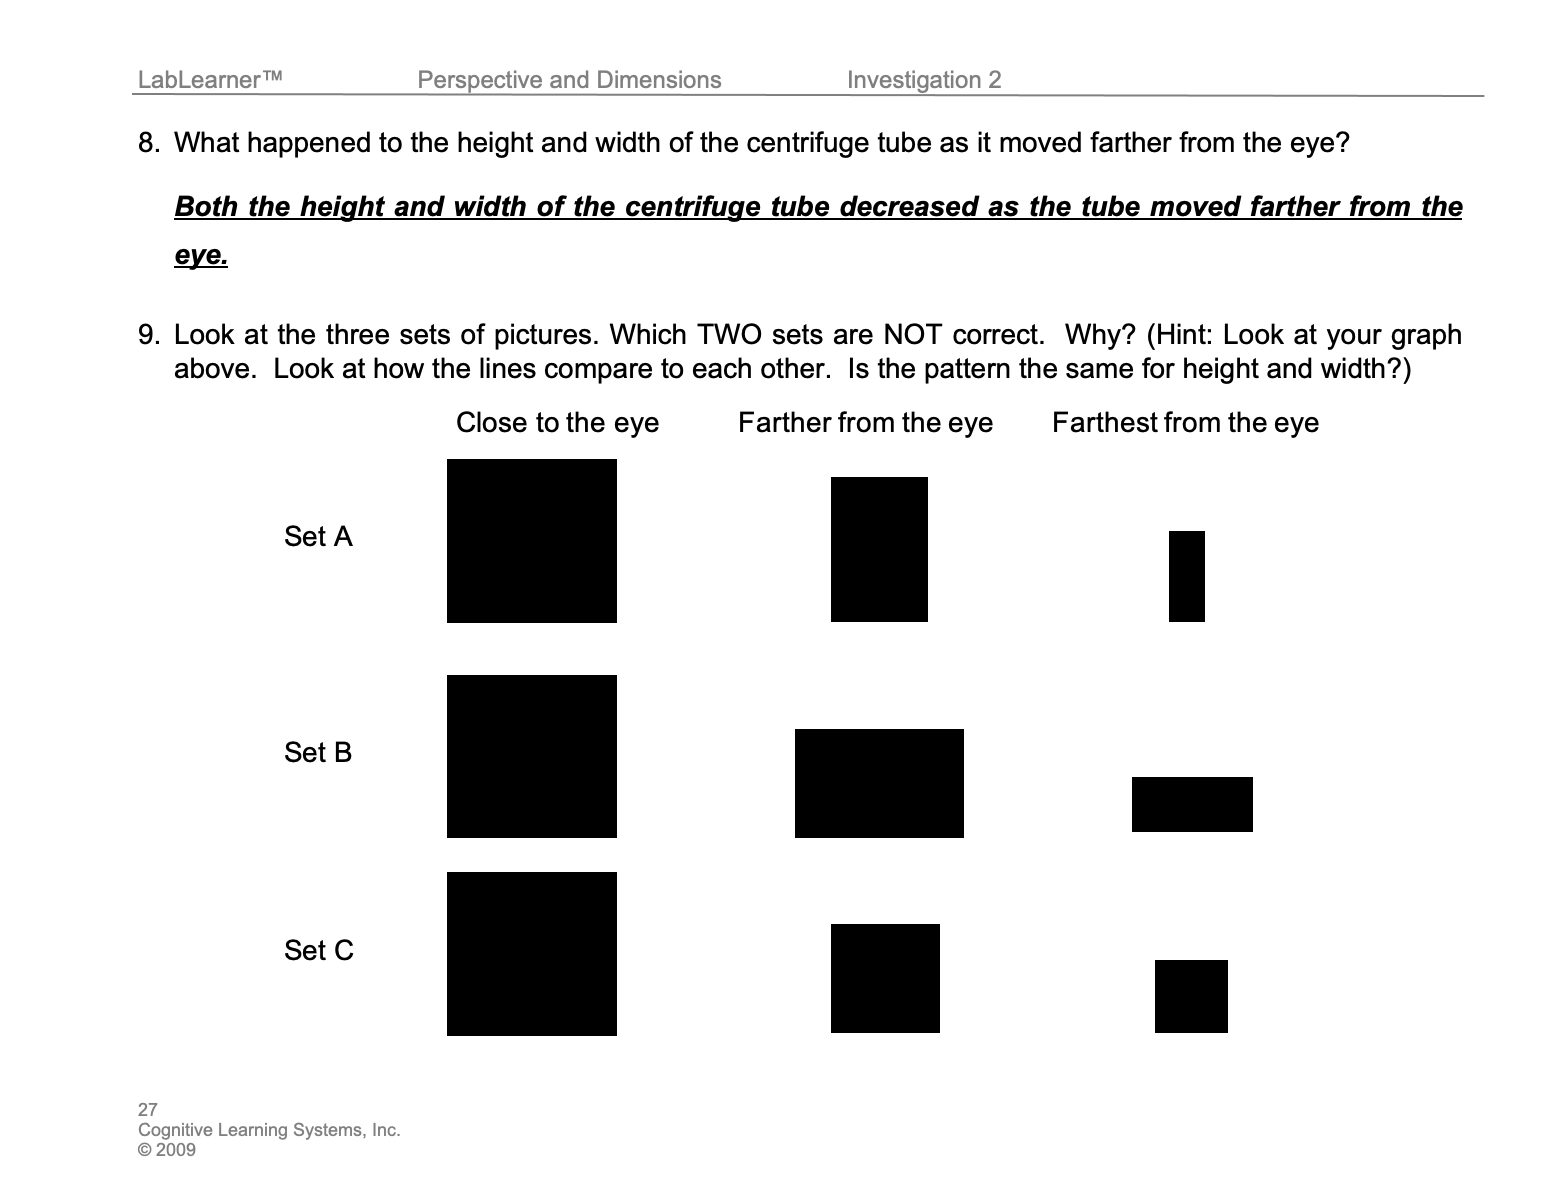
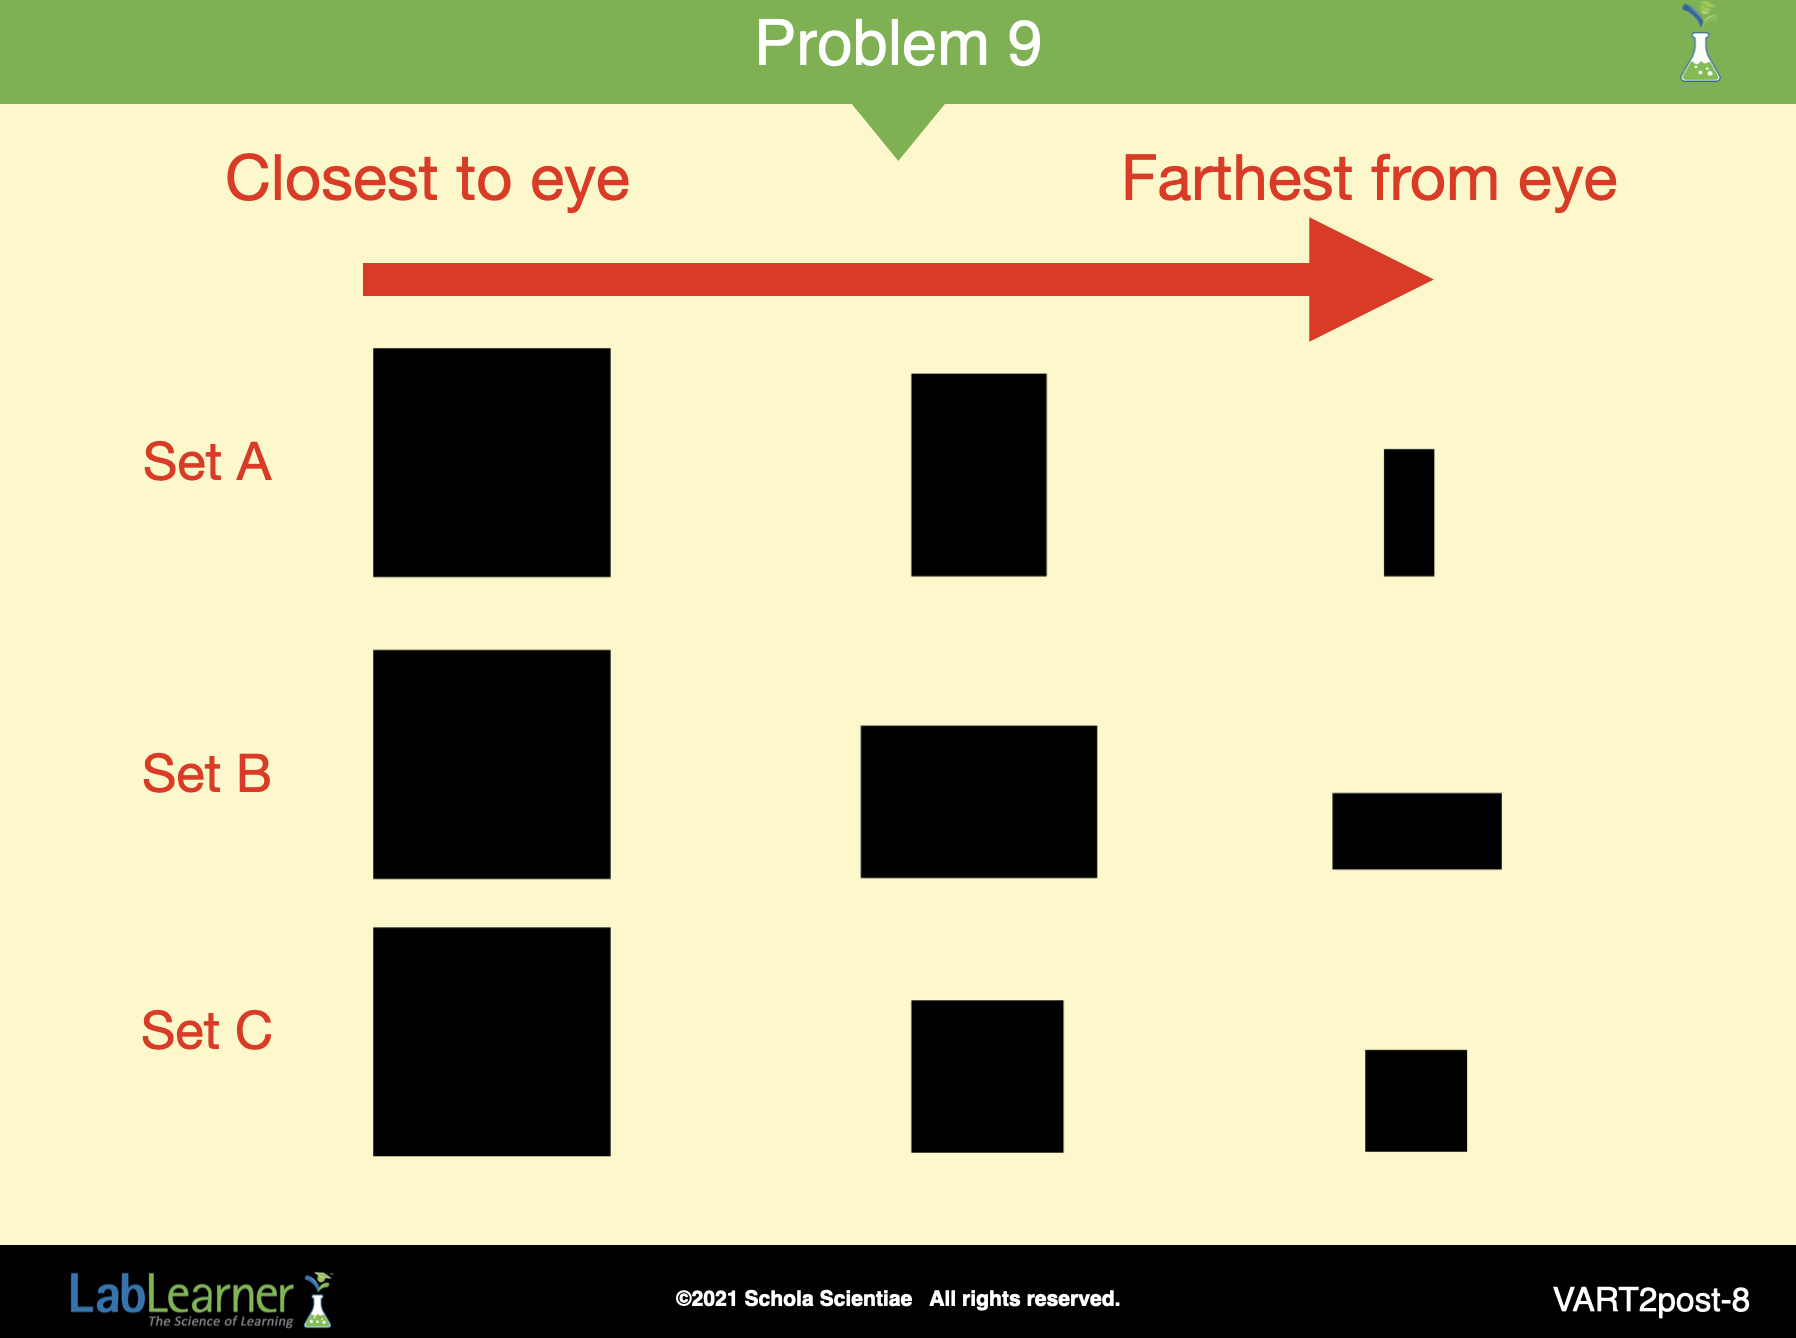
3. Provide an opportunity for students to apply what they have just learned by looking at the three sets of figures in Problem 9 in their Student Data Record (reproduced on this slide). This problem shows a square object at different distances from the eye. Each set presents how the square would look at those different distances.
Students should think about how the height and width of the object change in relationship to each other to select which set of objects shows how the square would look at different distances. Students should realize that Set C correctly shows how the object would look at different distances because BOTH the width and height of an object change in proportion to each other as the distance from the eye increases. Sets A and B do not show how the object would appear at different distances.
______________________________________________
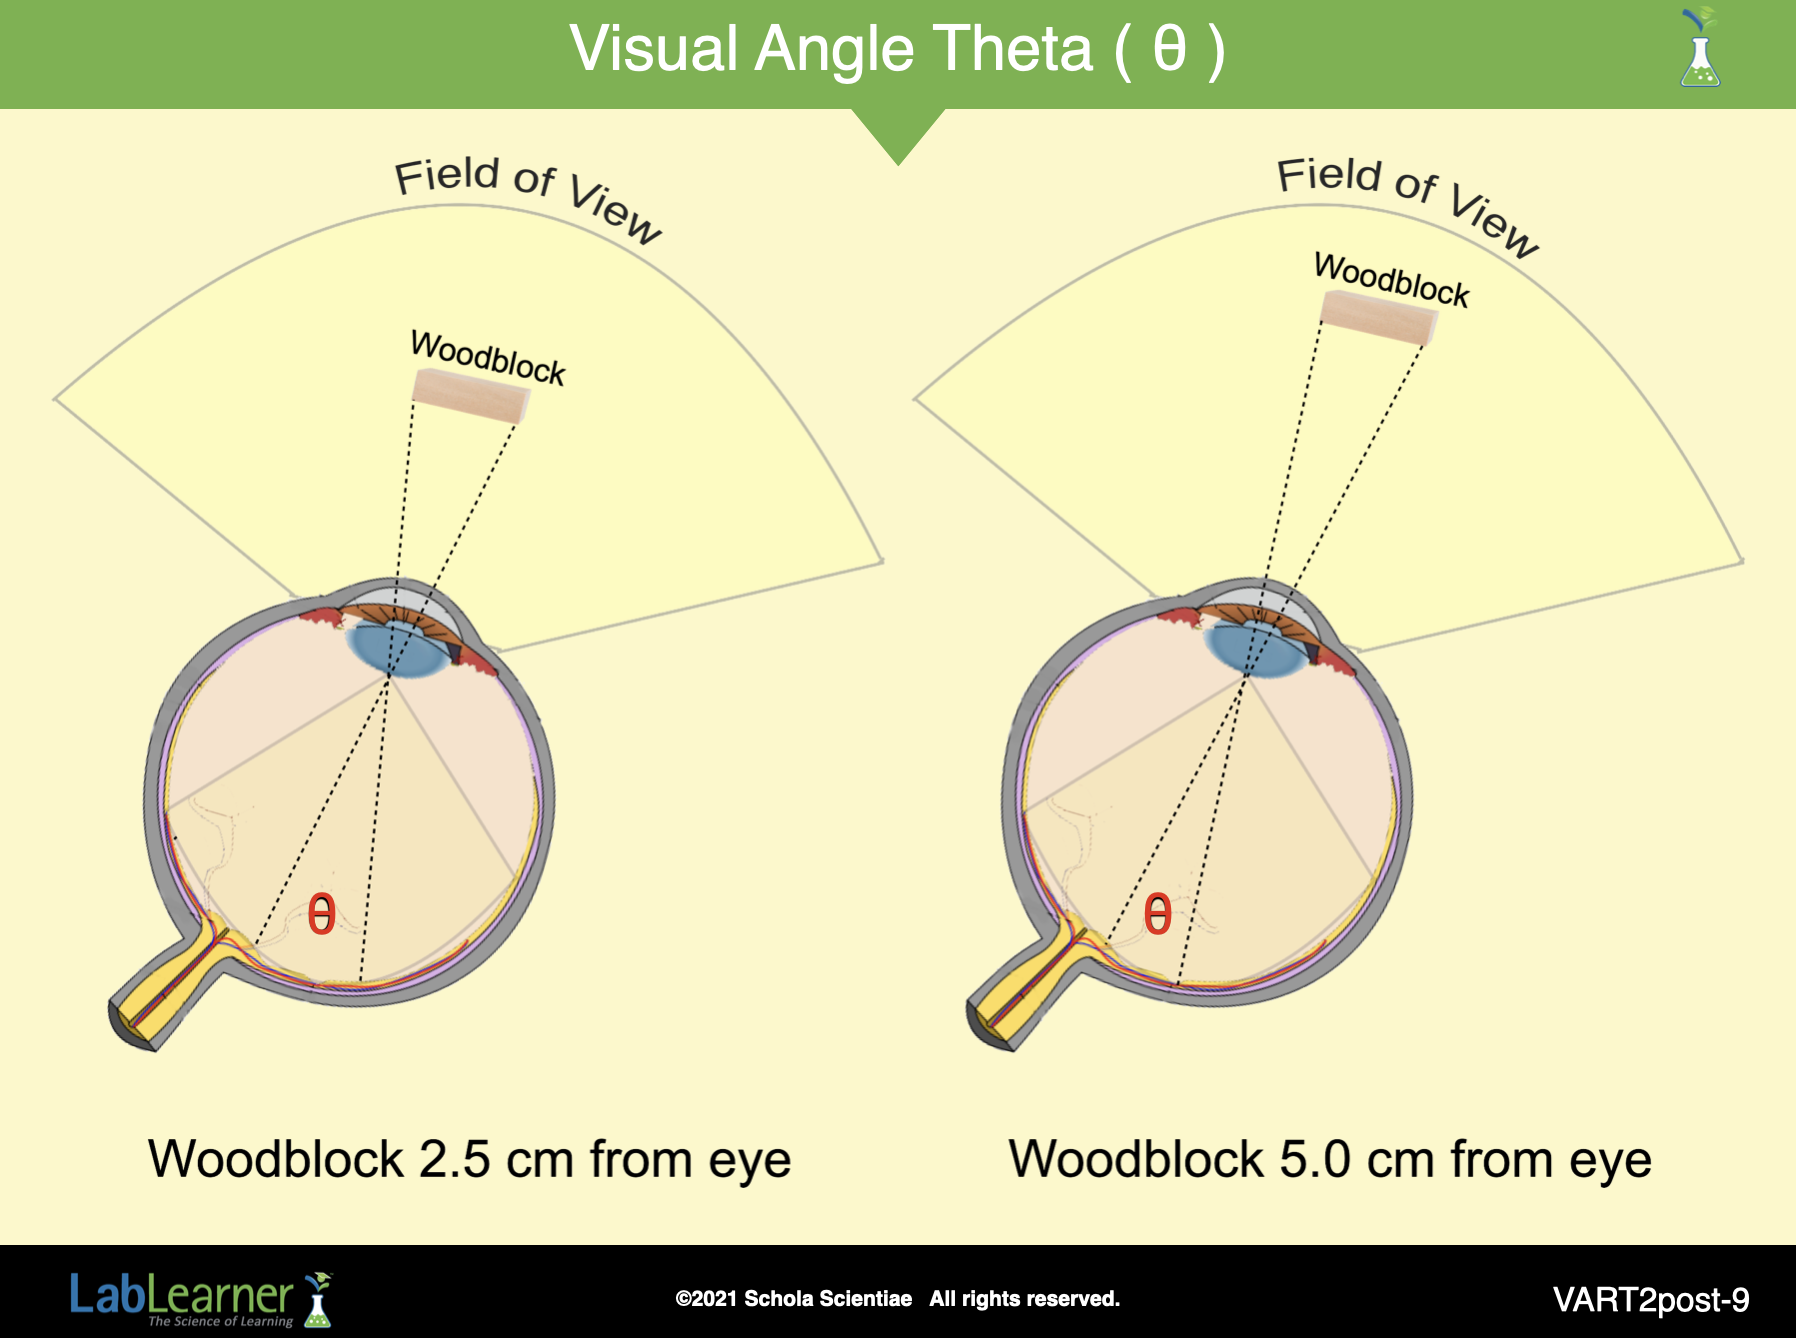
SLIDE VART2post-9
C. Continue the analysis by questioning students about why the height of the object appears to decrease as the object is moved farther from the eye.
1. Remind students that in the previous Investigation, they concluded that the width of an object decreases as the object moves farther from the eye because the object takes up less of the field of view. Students also related the width of an object to the size of the visual angle that the object encompassed as it passed through the lens of the eye. The smaller the visual angle, the more narrow the object appeared.
2. Tell students that part of their experiments in Investigation Two was to discover what happened to the appearance of the height of an object as it moved farther from the eye. To do this, students measured the height of the centrifuge near and far from the eye and the visual angle of the centrifuge tube as it entered the eye at different distances.
3. Review the definition and concept of visual angles. Use the questions below to help guide the discussion. In addition, refer to this slide which was seen in the PreLab session as well.
a. Ask students: When viewing an object, what is meant by the visual angle? The visual angle can either refer to the angle at which the light from an object enters the eye or the angle the light rays form as they pass through the inside of the eye to the retina.
b. Ask students: Look at Table A in your Student Data Record. Compare the outside visual angles for the centrifuge tube when placed at different distances from the eye. What happened to the visual angles as the centrifuge tube moved farther from the eye? The visual angles decreased as the centrifuge tube moved farther from the eye.
______________________________________________
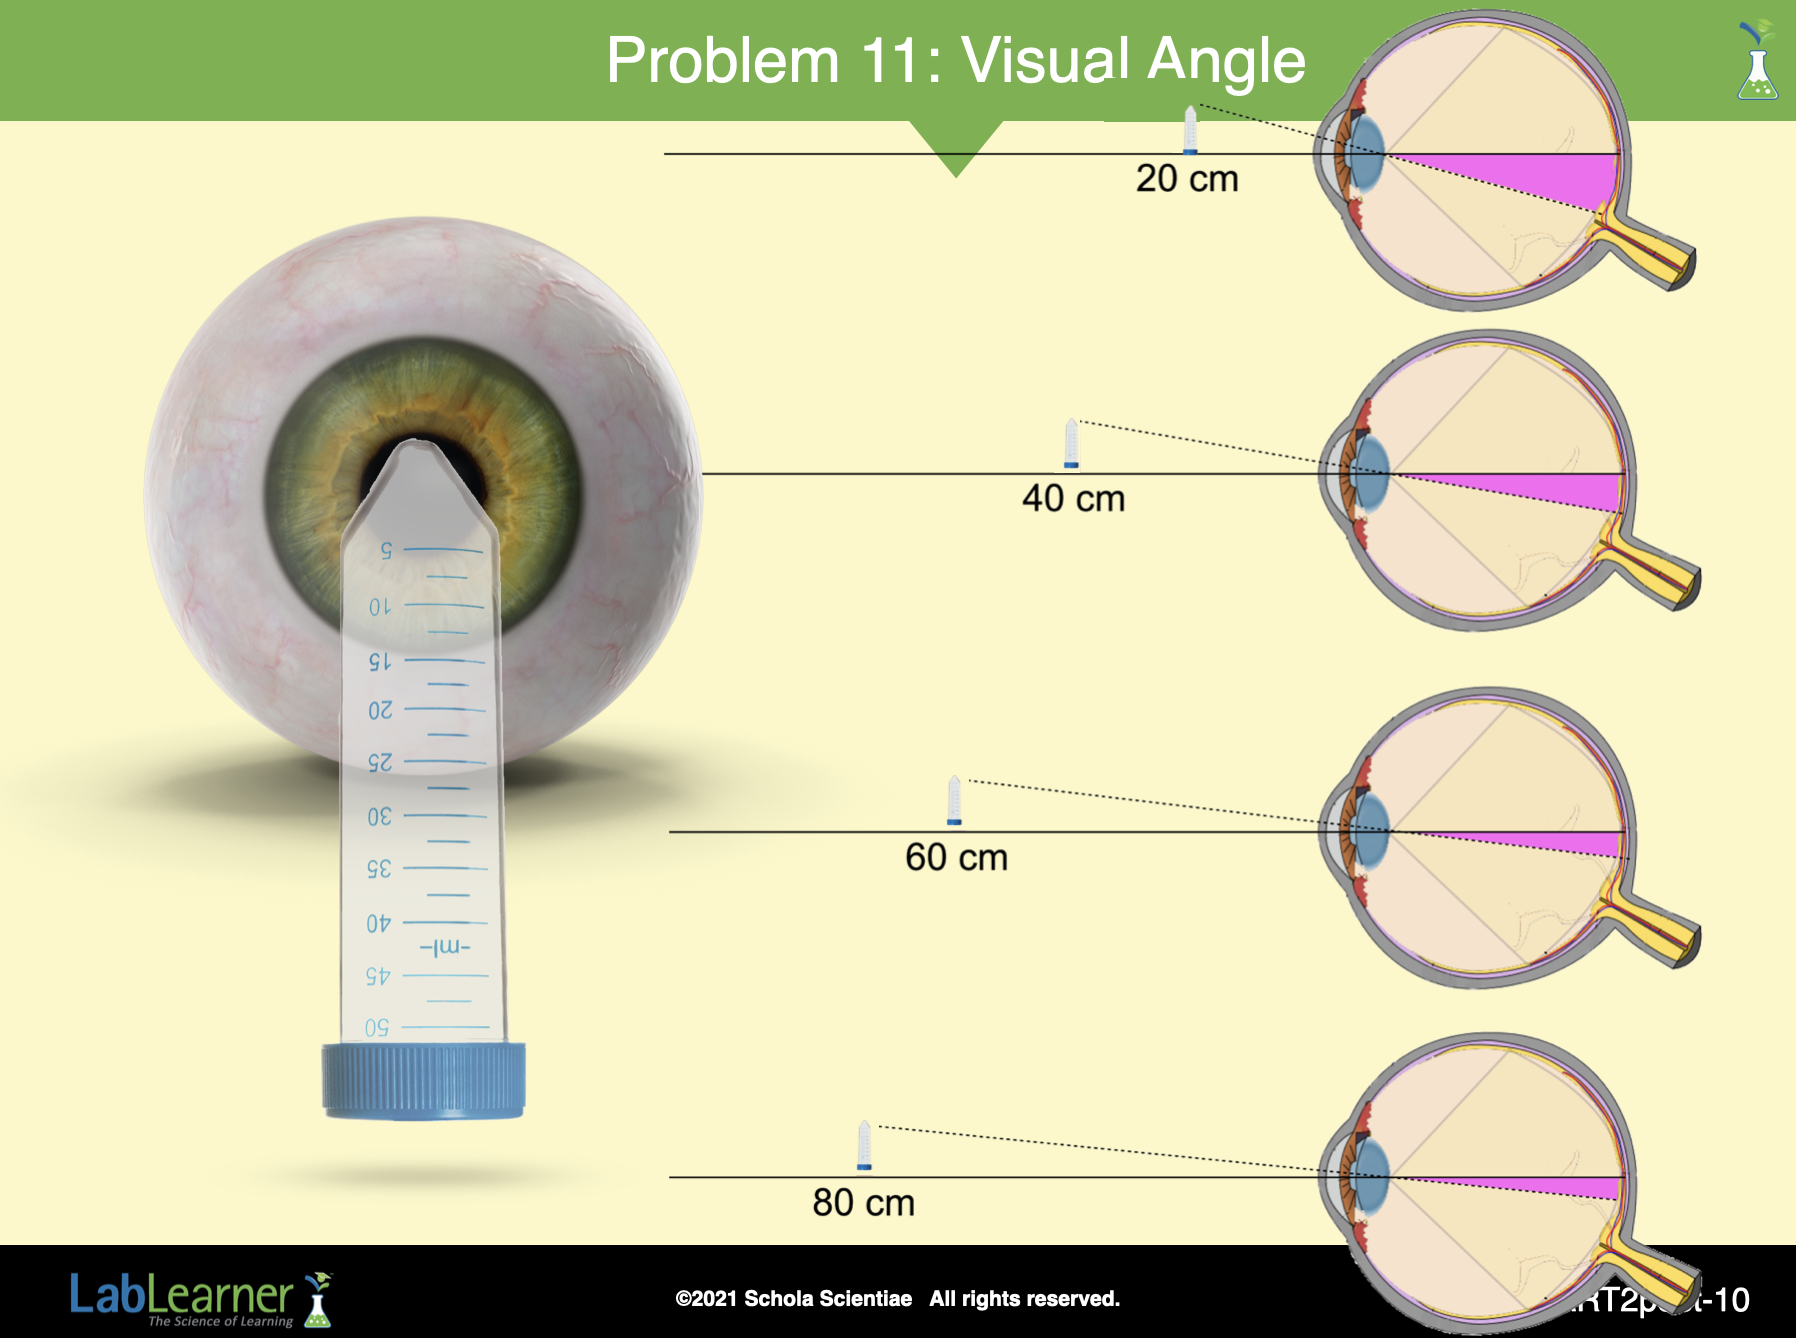
SLIDE VART2post-10
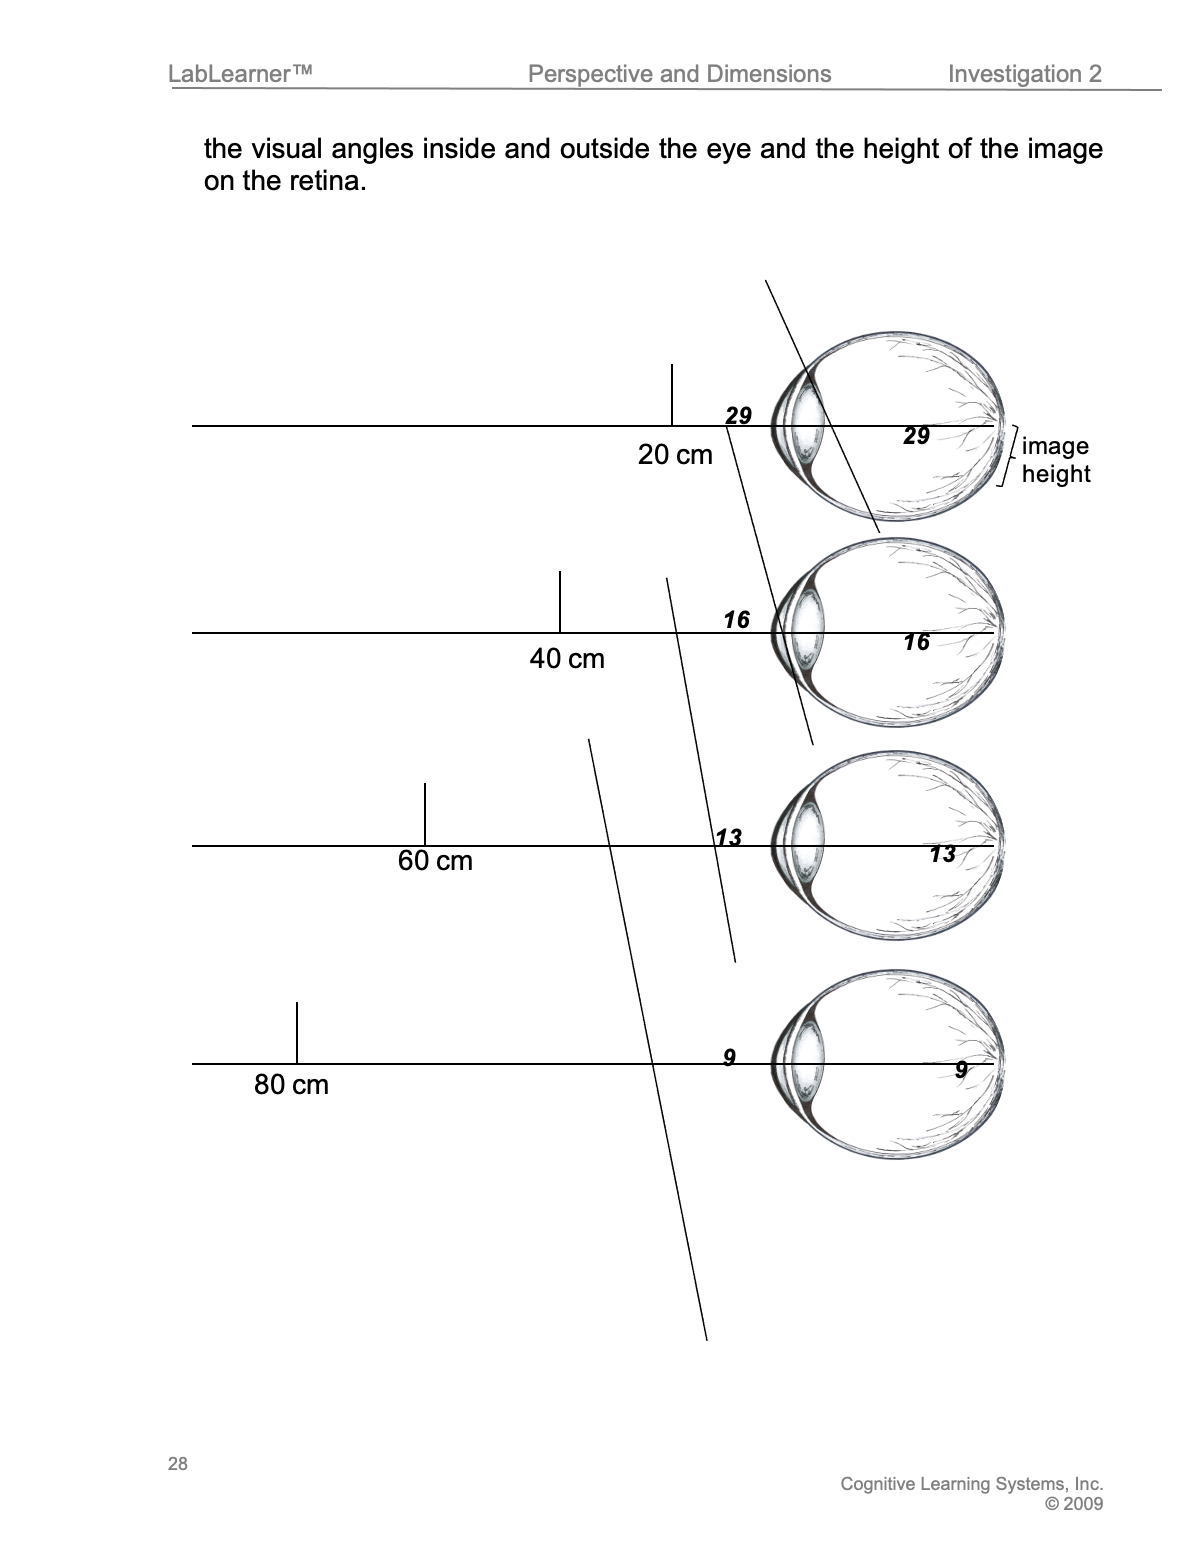
4. Tell students that there is a special relationship between the visual angles outside and inside the eye. Direct students to Problem 11 in their Student Data Record.
a. Encourage students to look at the four diagrams in Problem 11 (reproduced on this slide).
b. These diagrams illustrate the movement of the centrifuge tube during Trials 1 and 2.
c. Ask students: Look at the visual angle outside the eye in the diagrams. Is it increasing or decreasing as the centrifuge tube moved farther from the eye? It decreased as the centrifuge tube moved farther from the eye.
d. Ask students: Look at the visual angle INSIDE the eye in the diagrams. Is it increasing or decreasing as the centrifuge tube moved farther from the eye? It decreased as the centrifuge tube moved farther from the eye.
e. Ask students: What do you notice about the change in the visual angle INSIDE the eye and the visual angle OUTSIDE the eye as the centrifuge tube moved? Both visual angles decreased as the centrifuge tube moved farther from the eye.
5. Explain that the visual angles inside and outside the eye are similar to vertical ones. Vertical angles are angles that are across from each other. Vertical angles have the same measurement.
6. Tell students that the visual angles inside and outside the eye are not exactly the same because of the substance inside the eye. However, when scientists estimate, they often think of the two visual angles as vertical angles—having the same measurement.
7. Encourage students to use the data from Table A to write the magnitude of the visual angles both inside and outside the eye in the diagrams in Problem 11 in their Student Data Record.
8. Direct students to look at the size of the image of the object on the retina in each of the diagrams.
Ask students: What happens to the height of the image as the centrifuge tube moves farther from the eye? The height of the image decreases as the centrifuge tube moves farther from the eye. This occurs because the height of the image is directly related to the visual angle of the object inside the eye.
______________________________________________
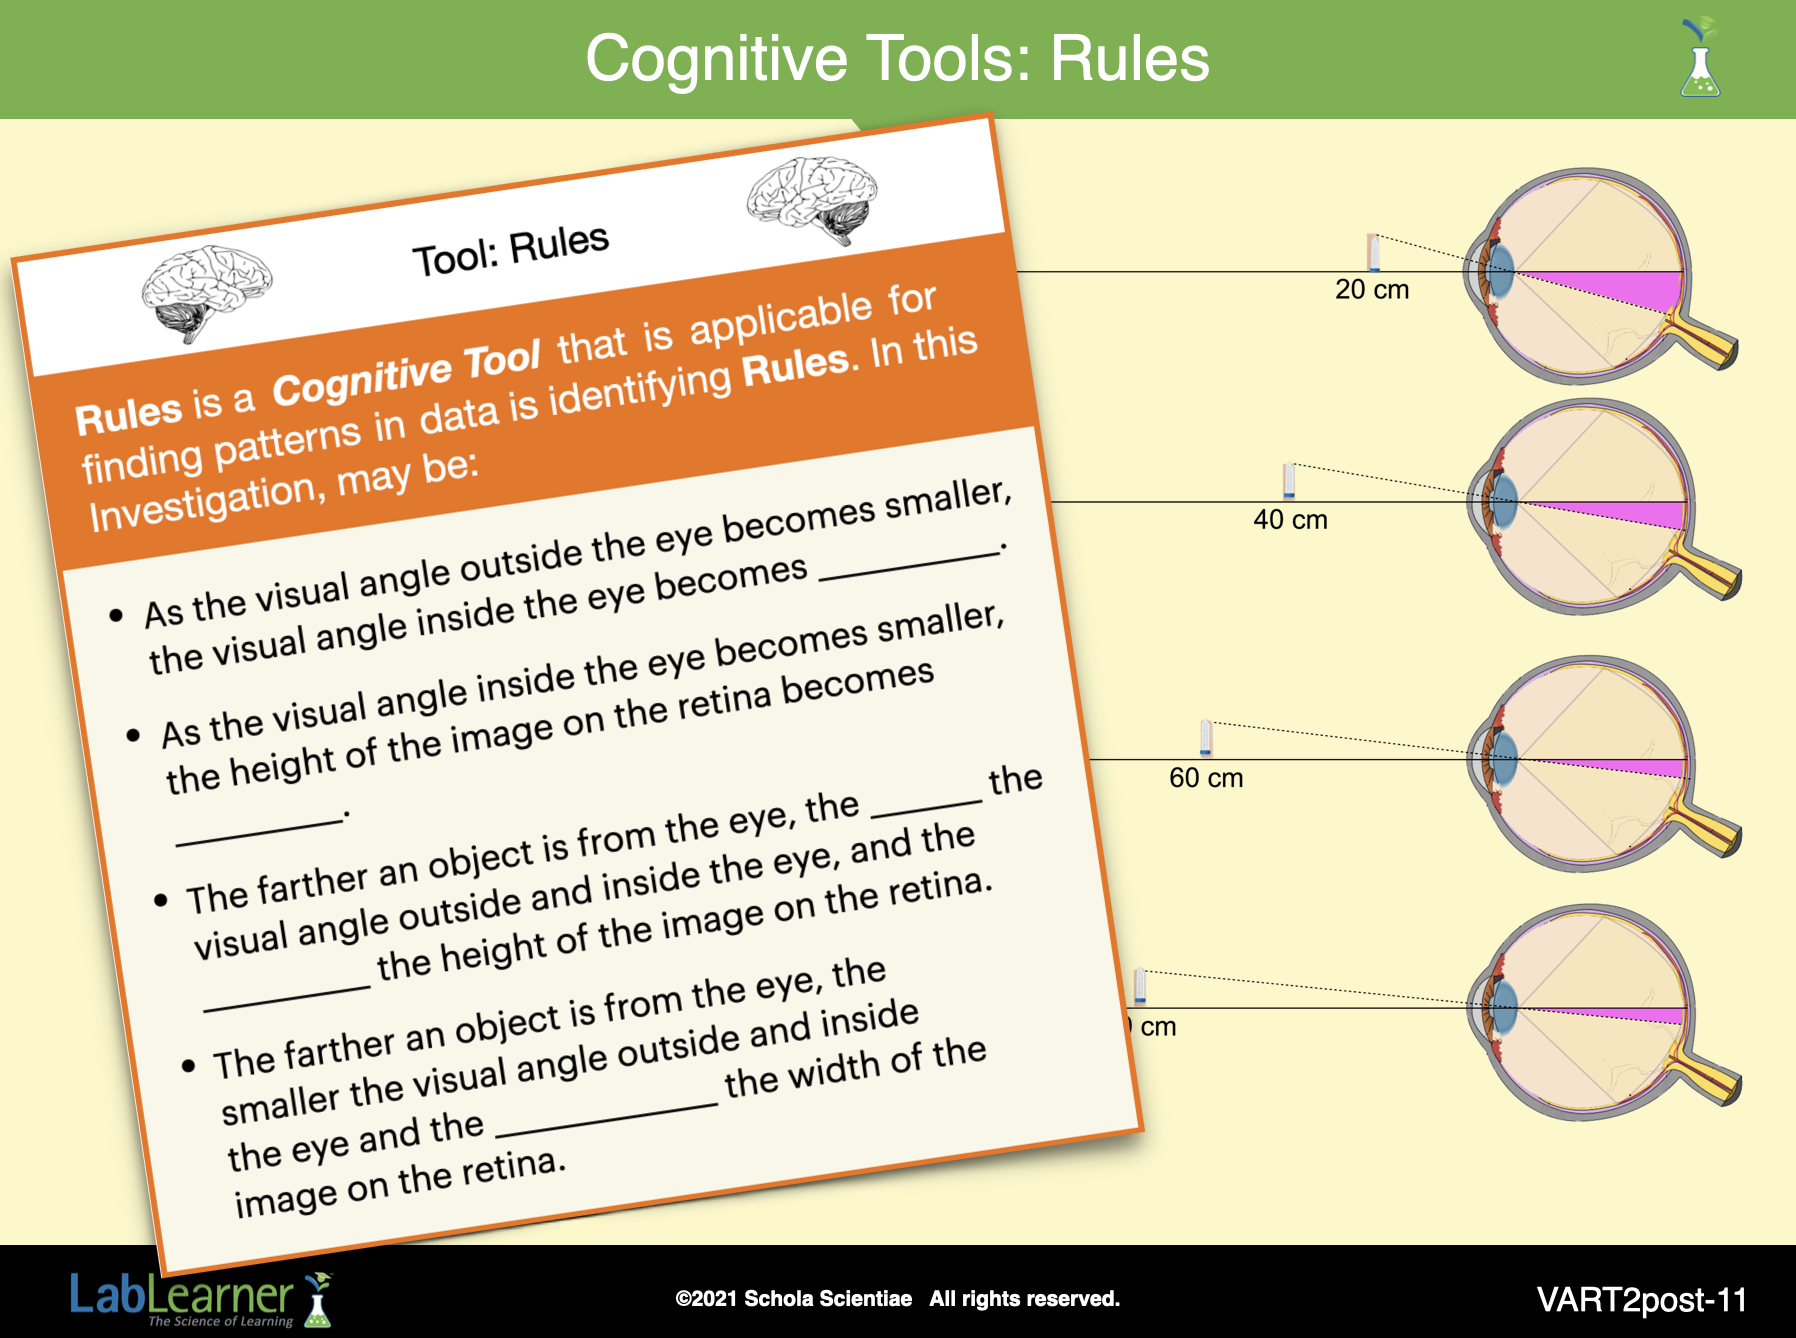
SLIDE VART2post-11
D. Explain the patterns that students just discovered and those they made in Investigation One and explain how we see depth.
1. Our eyes have a field of view. Objects in that field of view take up a certain portion or ratio. The closer the object, the more of the field of view is taken up. The farther the object, the less of the field is taken up. This applies to both the height and width of an object.
2. Another way to think about this is to describe what happens to the visual angles when an object is moved at different distances from the eye. As an object moves farther from the eye, the visual angle decreases, and the image formed on the retina becomes shorter and narrower. As an object moves closer to the eye, the visual angle increases, and the image of the object on the retina is taller and wider.
3. Discuss how the vanishing point is related to this concept: in terms of our eyes, a vanishing point is the distance that is so far away that an object takes up so little of the field of vision it appears to disappear. At the vanishing point, the visual angles are so small that the image on the retina is almost non-existent.
4. Although not specifically addressed in this CELL, students may find it interesting that microscopes and telescopes use lenses to create a magnified image of objects so that a larger visual angle is shown to the eye. If microscopes and telescopes are not used, the visual angle of the objects that a person observes is so small that the eye cannot resolve the image.
5. Conclude the PostLab by encouraging students to apply what they have learned by looking at the paintings in the following several slides.
______________________________________________
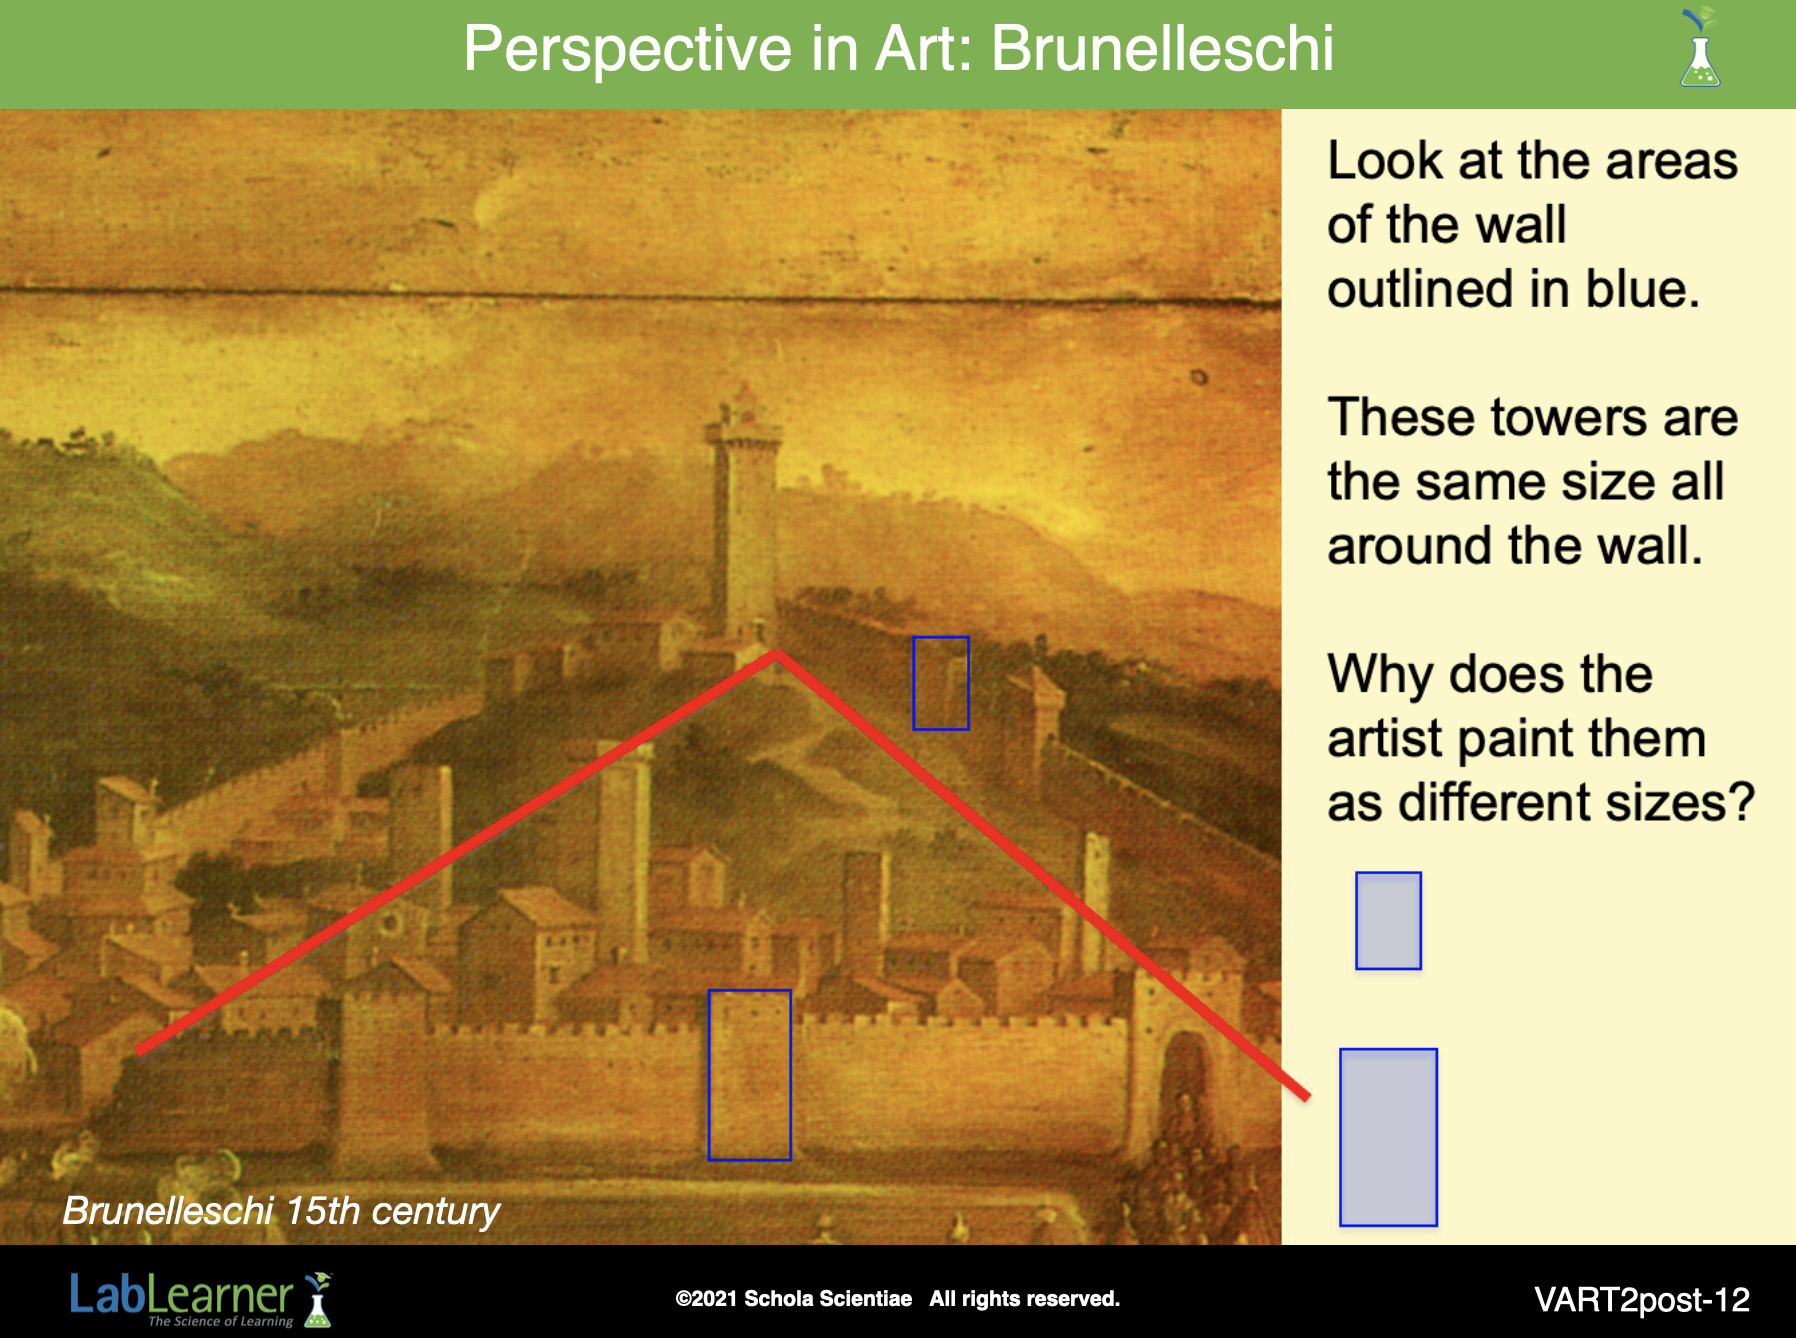
SLIDE VART2post-12
The following series of slides is designed to reinforce the concept of vanishing point and to illustrate how Renaissance and Post-Renaissance artists create a feeling of depth in their work by portraying the size of objects on a two-dimensional canvas the way in which the eye and brain perceive the objects in real life. In other words- the same object appears smaller when farther away than when close to the eye. In the following paintings, the size of objects are sized to reflect this generality.
As students look at each painting, the red lines illustrate the vanishing point. As students view the lines that point to the vanishing point, they should realize that the objects along the lines become progressively smaller because the objects are becoming closer to the vanishing point.
Colored outlines are drawn around other objects to illustrate differences in size.
Ask students the questions on the slide. Students should discuss that if a person were standing in the position of the artist they would “see” the tower that is in the distance as smaller—both more narrow and shorter – than the tower closer to the eye because of the difference in visual angles or the portion of the field of view taken up by the object. The artist recognized this and used this relationship when painting.
______________________________________________
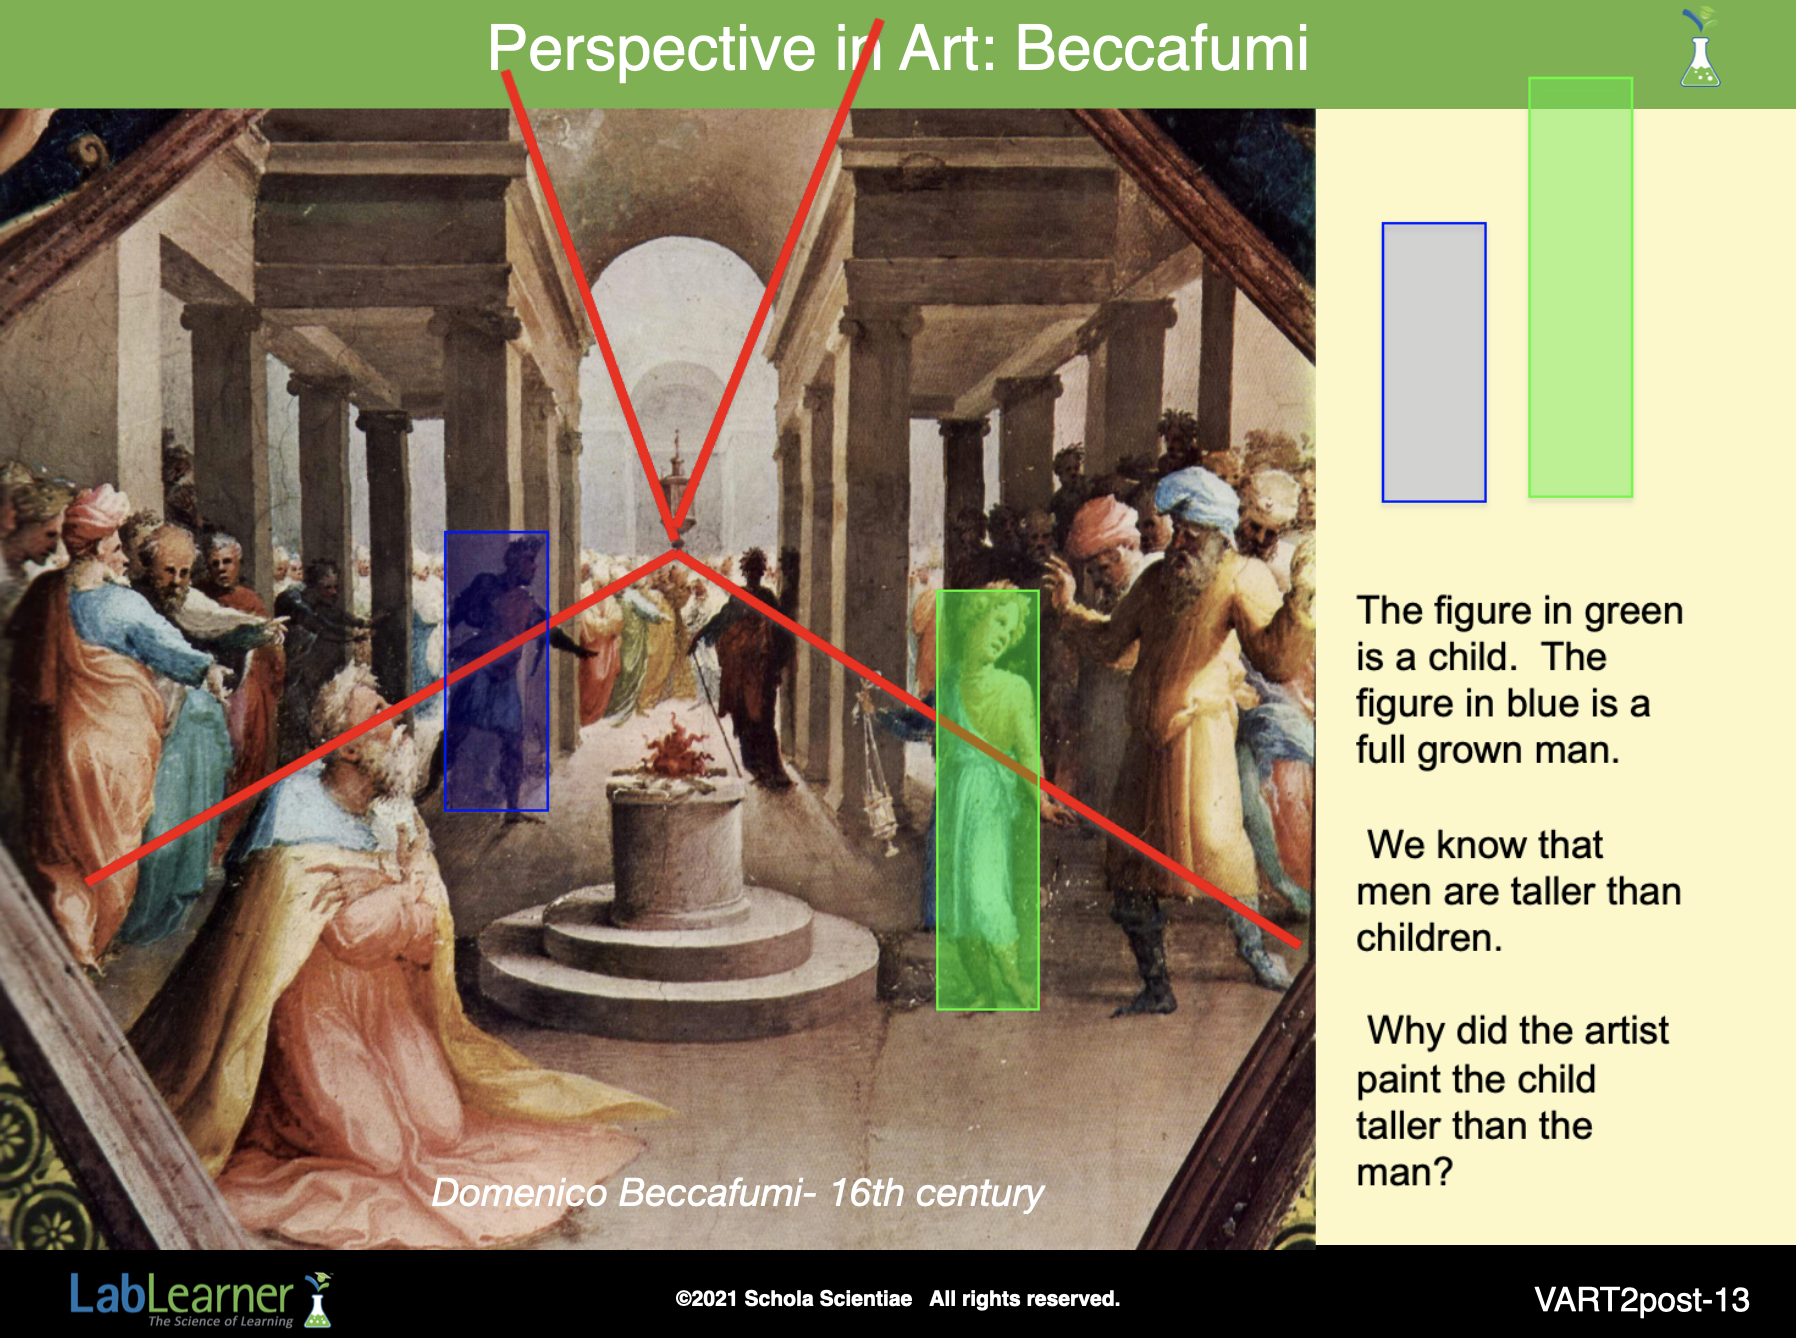
SLIDE VART2post-13
Ask students the question on the slide.
Students should discuss that the artist used the concept of vanishing point to achieve a feeling of depth or three dimensions in the painting. One of the depth cues for humans is that objects farther from the eye are shorter than objects closer to the eye.
Therefore, to create a feeling of depth or three dimensions in a two-dimensional painting, the artist painted the child as taller than the man to create the feeling that the child was in front or closer to the viewer than the man.
______________________________________________
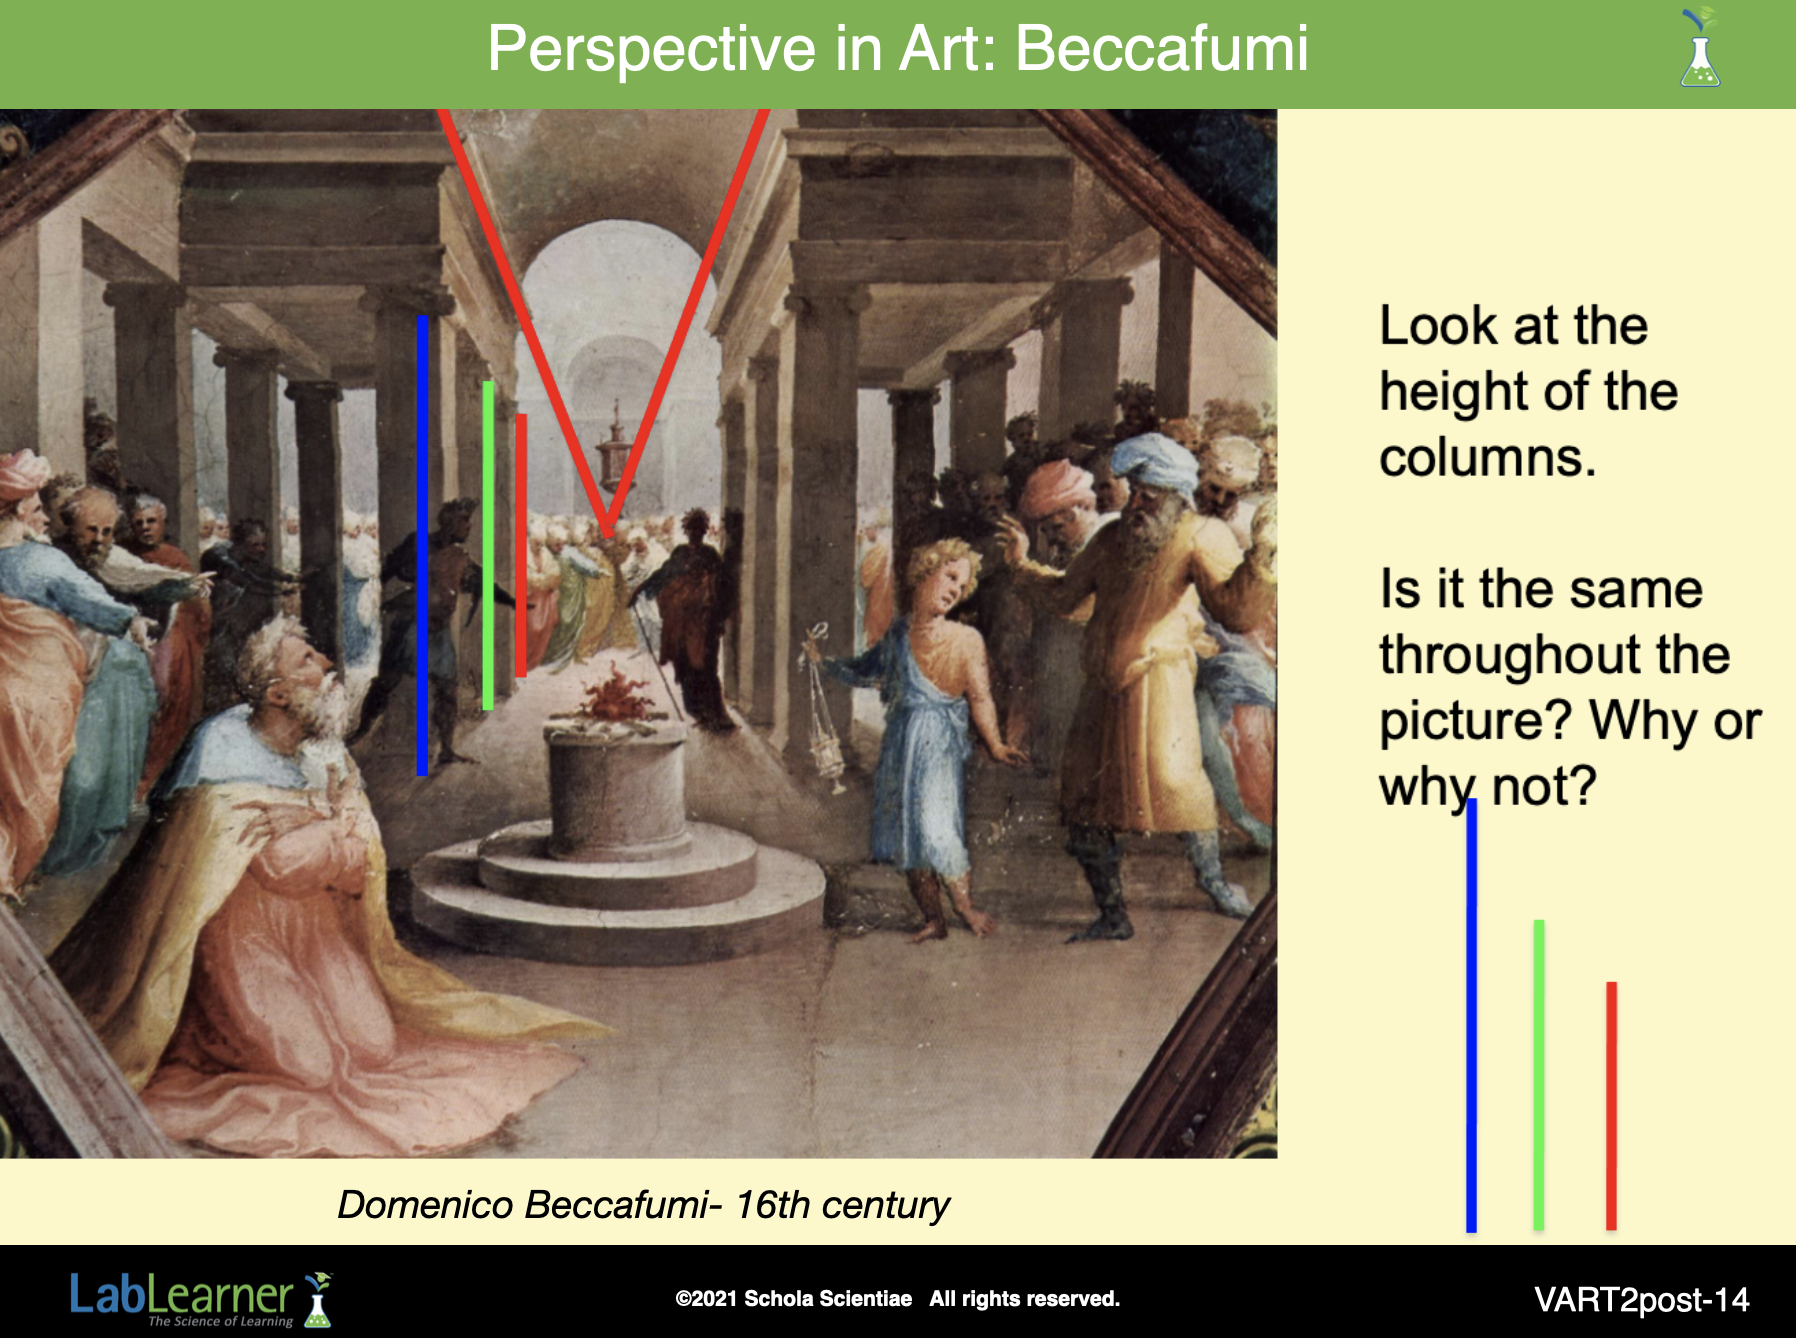
SLIDE VART2post-14
Ask students the question on the slide.
Students should see this as another example of how the artist purposely paints the columns he “sees” in the back of the structure as shorter because this is how the eyes and brain perceive distant objects in real life. By painting the columns at different heights he creates a feeling of depth or three dimensions.
______________________________________________
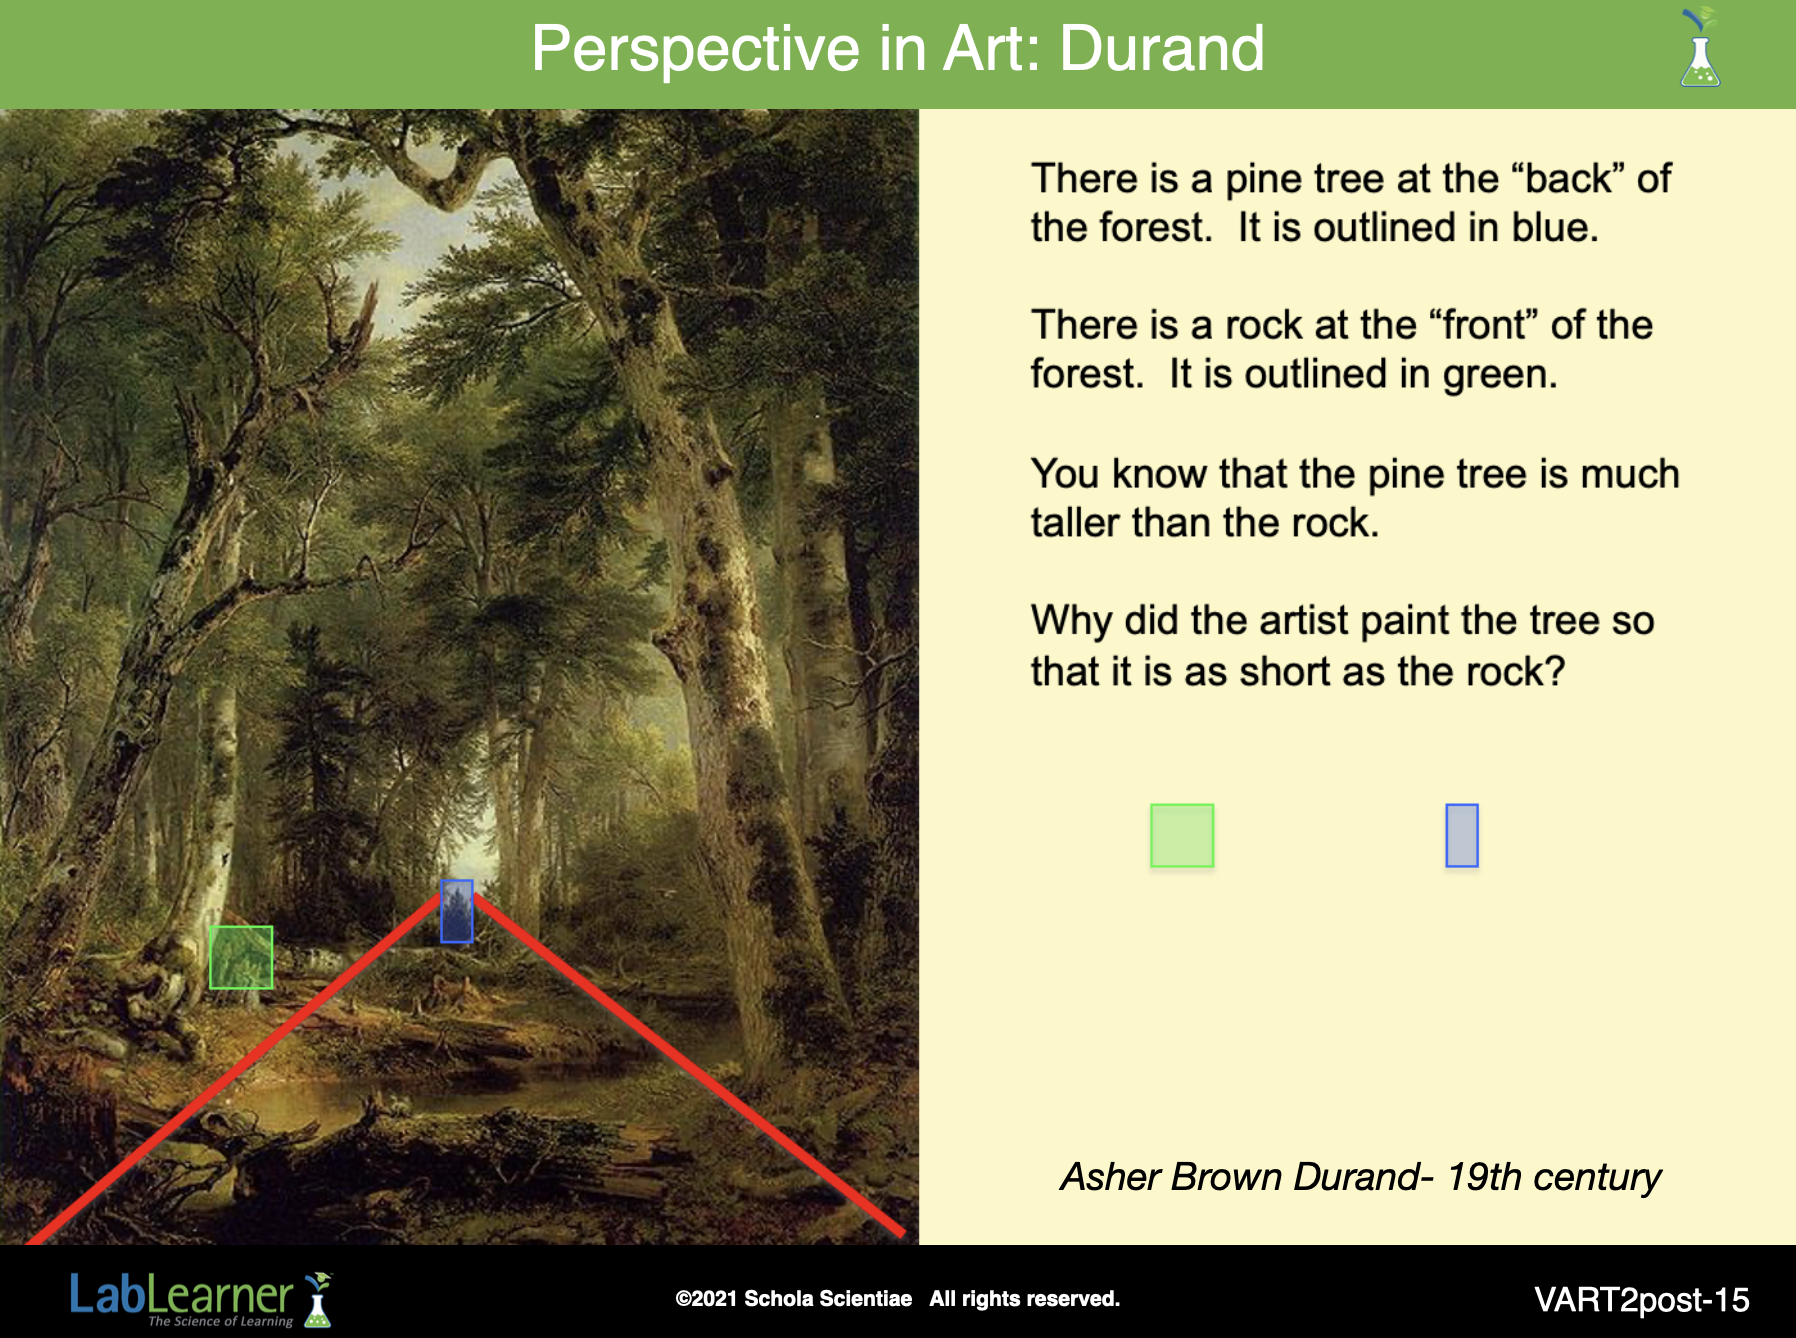
SLIDE VART2post-15
Ask students the question on the slide.
Students should see this as another example of how the artist purposely paints the tree he “sees” in the back of the forest as shorter because this is how the eyes and brain perceive distant objects in real life. By painting the pine tree as very short, he creates a feeling of depth or three dimensions. In this case, the pine tree is so small because it is at the vanishing point of the painting.
KEYS: POSTLAB