Teacher Portal:
Photosynthesis
Investigation 2 – PostLab

ZERO-IN
Italicized font represents information to be shared orally or physically completed with the students at this time.
The non-italicized font represents additional information included to support the teacher’s understanding of the content being introduced within the CELL.
ANALYZE IT
Note: Questions marked with a triangle (∆) are included to enrich students’ understanding. These questions do not appear in students’ SDRs but should be used as additional discussion points during the PostLab.
- As a class, discuss the carbon dioxide experiment.
Note: It is helpful if the equation used to represent photosynthesis can be displayed on the board or transparency for this discussion.

- ∆ How does photosynthesis involve carbon dioxide? Carbon dioxide is one of the substances plants use during photosynthesis.
- ∆ What do you suppose happened to the carbon dioxide in the test tube with the Elodea? The Elodea plant likely used the carbon dioxide in the water of the test tube while photosynthesis was occurring.
- ∆ If photosynthesis occurred in the test tube, decreasing the amount of carbon dioxide, what happened to the pH of the water? The pH of the water increased. The water became more basic.
- ∆ If the water became more basic, toward what color would the water have changed? The water would have become more red or pink.
- ∆ Did your results match this conclusion? Students answers may vary. Students should have seen a slight shift in the color of the water in the test tube with the Elodea plant from slightly orange to slightly pink. This change in color correlates with a decrease in carbon dioxide, a result of photosynthesis.
Note: Students may wish to test the pH of the water in each test tube using a pH strip. If students test the pH, they will find no observable difference in the pH, because the difference in pH is too subtle to observe using the pH strips. In this scenario, phenol red acts as a better indicator of a change in pH than a pH strip.
- Discuss the data collected using the oxygen meter.
Note: It is helpful if the equation used to represent photosynthesis can be displayed on the board or transparent for this discussion.
![]()
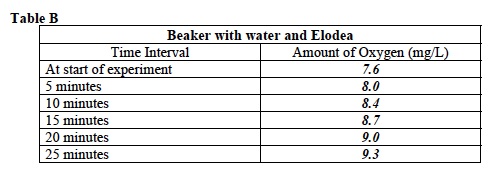
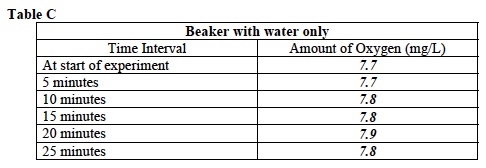
- ∆ Why did half of the class measure the oxygen content in water and the other half measure oxygen content in water with Elodea? The half of the class measuring the amount of oxygen in water without Elodea provided a control. Students may observe a trend in the oxygen content in water with Elodea, but without the experimental control, students would not be able to determine whether the trend was due to the Elodea or another variable, such as stirring, temperature of the water, size of beaker, and so forth.
- ∆ How does Elodea affect the level of dissolved oxygen in water? Student answers will vary. Students may be able to look at the data on their chart and draw the conclusion that the level of oxygen in the water with Elodea increased more than the level of oxygen in the water without Elodea. The following graphing activity will help students see this trend.
Instruct students to complete the Analysis Questions in their SDRs then discuss them as a class. Use the suggested responses below to guide students’ answers.
- Did you see a change in the color of the water in the two test tubes? If so, what might the change in color represent? Students likely saw a change in the color of the water around the Elodea. When compared to the water in the test tube without the Elodea, the water with the Elodea changed from having a slight red-orange tint to having a slight red-purple tint. This change in color came as a result of the change in pH of the water. As photosynthesis occurred in the Elodea plant, carbon dioxide from the water was used. Using the carbon dioxide made the pH of the water higher, or more basic. This change in pH resulted in a change in the color of the water due to the pH indicator, phenol red.
- Graph: Use the grid below to make a graph that compares time to oxygen level in a beaker of water with or without Elodea. Draw a best fit line through your data points. If you need help, refer to the procedure, Drawing of a Best Fit Line.
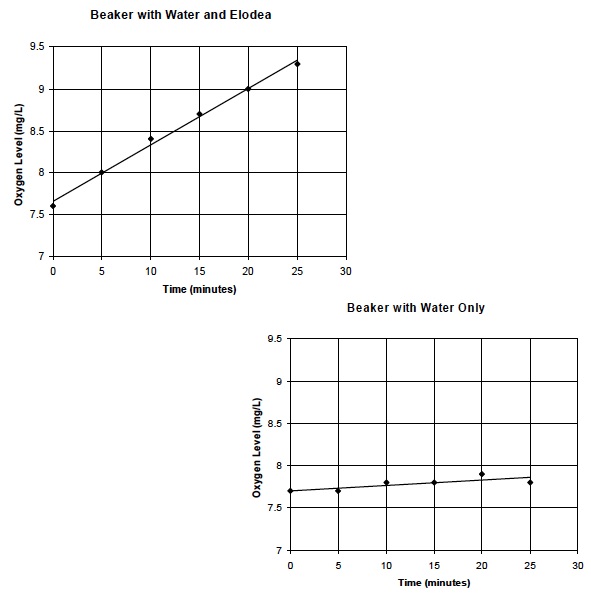
- Based on your graphed data, do you observe any trend in oxygen level over time? When students placed the beaker with Elodea next to the light, the amount of oxygen present in the water increased significantly. In the sample experiment, the amount of dissolved oxygen increased by 1.7 mg/L over the course of the experiment and the graph shows a line with a positive slope close to 1 indicating a continuous increase in oxygen concentration at each time point of the experiment. When students placed the beaker with no Elodea next to the light, the amount of oxygen present in the water may have risen slightly but not as significantly. In the sample experiment, the amount of dissolved oxygen increased by 0.1 mg/L over the course of the experiment. In addition, the best fit line of this data has a slope of zero, indicating very little or no increase in oxygen at each time point.
- What may have caused the observed change in the level of dissolved oxygen? During photosynthesis, light and chlorophyll are needed to convert carbon dioxide and water into sugar, water, and oxygen. When the light shined on the Elodea in the beaker, photosynthesis occurred and oxygen was produced. Since the other beaker of water contained no Elodea, photosynthesis did not occur and the level of dissolved oxygen did not increase significantly over the course of the experiment. Students may have recorded a slight increase in dissolved oxygen in the beaker with only water. This may be due in part to the effect of stirring. As water is stirred, more oxygen from the air is dissolved in the water.
GET FOCUSED
Instruct students to complete the Focus Questions in their SDRs then discuss them as a class. Use the suggested responses below to guide students’ answers.
- How do light and photosynthesis affect carbon dioxide levels? Light is necessary for photosynthesis. In the presence of light, carbon dioxide levels decreased in water containing Elodea but not in water alone. This indicates that carbon dioxide is used in the process of photosynthesis.
- How do light and photosynthesis affect oxygen levels? Light is necessary for photosynthesis. In the presence of light, oxygen levels increased in water containing Elodea but not in water alone. This indicates that oxygen is a product of photosynthesis.