Teacher Portal:
Light
Investigation 3 – Concept Day
ZERO-IN

Italicized font represents information to be shared orally or physically completed with the students at this time.
The non-italicized font represents additional information included to support the teacher’s understanding of the content being introduced within the CELL.
ASK WHY
Explain to students that light is all around us. It has the ability to tan or burn our skin. It can be harnessed to melt metals, create electricity, and heat our food. It gives us sight, color, warmth, and enables gadgets like computers, cameras, televisions, traffic lights, mirrors, eyeglasses, and microscopes to function.
BRANCH OUT
Explain to students that forensic scientists use black lights to analyze crime scenes. To pick out fingerprints, for example, they often dust with fluorescent dye under a black light. This makes it easier to pick the fingerprints out from surrounding dirt.
PRINT IT
Use your browser to download a printable PDF as a help during the slide presentation and to make additional notes. In your browser, go to File > Print and then choose to save as PDF.
NAVIGATE IT
Once the slide presentation is launched
- use your left and right arrows to advance or go back in the slide presentation, and
- hover your mouse over the left edge of the presentation to get a view of the thumbnails for all the slides so that you can quickly move anywhere in the presentation.
- Click HERE to launch the slide presentation for the CELL.
SHARE IT

SLIDE LIGHT-3-1
- In this Investigation, we will continue our study of light by discussing it’s color and wave properties. We will begin by seeing where visible light fits into the entire electromagnetic spectrum.
- We will return to the concepts of absorption and reflection of light, this time in terms of how different objects preferentially absorb or reflect light of different wavelengths and understand that this is why we perceive different colors in the world around us.
- Finally, we will see that filters can be used to selectively allow the transmittance of some wavelengths of light while absorbing others.
______________________________________________

SLIDE LIGHT-3-2
- This slide contains quite a lot of information. All of the important information is derived from the central graphic that shows how electromagnetic radiation comes in very different forms and that these forms are due to the wavelength. This central graphic is shown in isolation below:
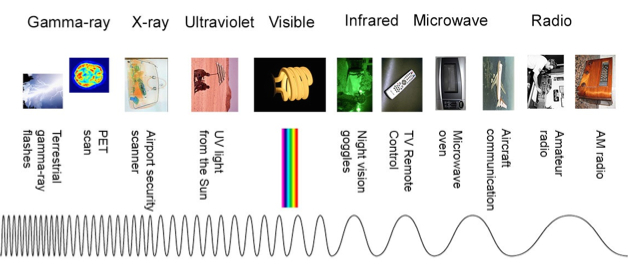
- This graphic shows one continuous wave with its wavelength increasing as we move along it from left to right (bottom to top in the slide). As a reminder, a simple graphic describing what one wavelength is is shown in the insert to the left and below:
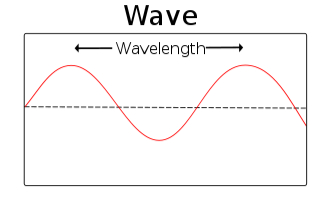
- A wavelength is the distance of one complete cycle of a wave. Here the wave is measured from peak to peak. This length is also shown near the top of the wave on the central graphic of the slide in blue dashed lines. The actual length is measured in meters for long wavelengths but this is often converted to nanometers for shorter wavelengths. For example, if we measured the wavelengths of visible light in meters, they would range from 4×10⁻⁷ to 7×10⁻⁷ meters. Rather than use exponents, these wavelengths are usually reported as 400nm to 700nm (in nanometers).
- The blue triangle simply indicates that radio waves (at the top) are long compared to gamma waves (at the bottom). The red triangle summarizes the energy (in Joules) of the various wavelengths. The gamma-ray end of the spectrum has very high energy, whereas radio waves have very low energy.
______________________________________________

SLIDE LIGHT-3-3
- From this point forward, we will only focus on waves in the visible range; the only waves that are visible to the human eye. This slide simply illustrates that “white light”, such as comes from the sun or a regular light bulb, is actually composed of a mixture of wavelengths, all having different colors.
- Prisms are able to separate white light into its component wavelengths. The order in which the light is separated by a prism is always the same. Red is followed by orange, which is followed by yellow, and so on to violet. Wavelengths longer than red are referred to as infrared and those shorter than violet are call ultraviolet.
______________________________________________

SLIDE LIGHT-3-4
- This slide shows the actual wavelengths of colors in the visible spectrum. The shortest wavelengths of visible light are positioned to the far left. It is here we find violet at around 400nm. Red is to the far right at around 700nm. As can be seen, the colors gradually meld into each other when moving through the spectrum.
- The wavelength range for various common colors are shown on the next slide.
______________________________________________

SLIDE LIGHT-3-5
- This slide simply shows that the spectrophotometer can be set to various different wavelengths. When analyzing samples in the spectrophotometer, we always need to choose the specific wavelength of light that we wish to use. When we select a wavelength with the wavelength dial of the spectrophotometer, we can choose one of the colors indicated in the chart on this slide.
______________________________________________

SLIDE LIGHT-3-6
- This slide gives a quick review of reflection, absorption, and transmittance of light from Investigation 1. We will discuss reflection and absorption of light in the next two slides and then in a final slide related to the transmittance of light.
______________________________________________

SLIDE LIGHT-3-7
Note: The teacher should emphasize the point made in #1 on the slide. That is that only light of three wavelengths are shown in this graphic – red, green, and blue. As we have seen, visible light contains a whole “spectrum” of different wavelengths and colors. We have chosen to depict only three of them strictly to simplify the illustration.
- In this slide, various color blocks are shown. In order for us to see light of a certain wavelength, it must be reflected from the object we are looking at. Obviously, if an object absorbs light of a particular wavelength or color, that wavelength will no longer be available to enter our pupils and be perceived by our eyes and brain.
- This slide suggests that students observe whether blue, red, and green light waves are absorbed or reflected by the different color blocks. Further, it asks them to determine if there is any rule(s) they can deduce from looking at the patterns of absorption and reflection of light of the three wavelengths from the different blocks.
- Black objects absorb all three of the wavelengths; therefore, little light is reflected from black surfaces for our eyes to perceive. In a sense, black is the absence of color and not a color at all.
- White objects do not absorb any wavelengths in the visible spectrum. When we see a white object, we are seeing all of the wavelengths of light that strike its surface. Light reflected from a white surface is essentially the same as that that shined on it. We call this white light.
- The red, blue, and green blocks all show that the color we perceive an object to be is determined not by the wavelengths it absorbs, but only by the wavelengths it reflects. Thus, the blue block absorbs red and green but reflects blue wavelengths. The red block absorbs blue and green and reflects only red. The green block absorbs red and blue and reflects green.
______________________________________________

SLIDE LIGHT-3-8
Note: This is an animated. The teacher should practice the animation prior to presenting it to the class.
- This slide provides students with some immediate practice in deciding which wavelengths of light (colors) are absorbed and reflected by some common food items.
- The teacher and class should go through the 5 objects on the slide slowly enough so that the fate of each of the three colors shined on the objects (red, green, and blue) are accounted for – is each color wavelength absorbed or reflected?
______________________________________________

SLIDE LIGHT-3-9
Note: This is an animated. The teacher should practice the animation prior to presenting it to the class.
- We now will include the transmittance of light into our discussion of visible light. The lab for Investigation 3 will involve experiments very similar in concept to the experiment illustrated here.
Note: Here again, the teacher should emphasize to the class that white light contains all of the colors of the visible light spectrum but that only red, green, and blue are shown on this slide for simplicity.
- Color filters are made of materials that absorb light of all but a few wavelengths. A red color filter, for example, will absorb all wavelengths (blue and green here) except red. From our previous discussion, we know that a red block absorbs green and blue but reflects red. Therefore, when we look at a red block through a red filter it still appears red because the filter allows the red wavelengths to transmit through it and reach our eyes. This is shown in the red block/red filter combination at the top.
- When the red block is observed through a blue filter, we get a different result. We know that only one color wavelength can be transmitted through the blue filter – blue. On the other hand, we know that the only wavelength reflected from the red block is red; the green and blue wavelengths were absorbed. So even though red wavelengths are reflected from the red block’s surface, they are absorbed by the blue filter and cannot reach our eye. As a result, the red block, when viewed through the blue filter, appears dark or colorless.
- With one step (or click) of animation, two blue blocks appear on the right side of the slide. At this point, the teacher may ask for predictions as to what we will see if the blue block is first viewed through a red color filter and then a blue filter. Subsequent steps (or clicks) of animation will reveal the results.
______________________________________________
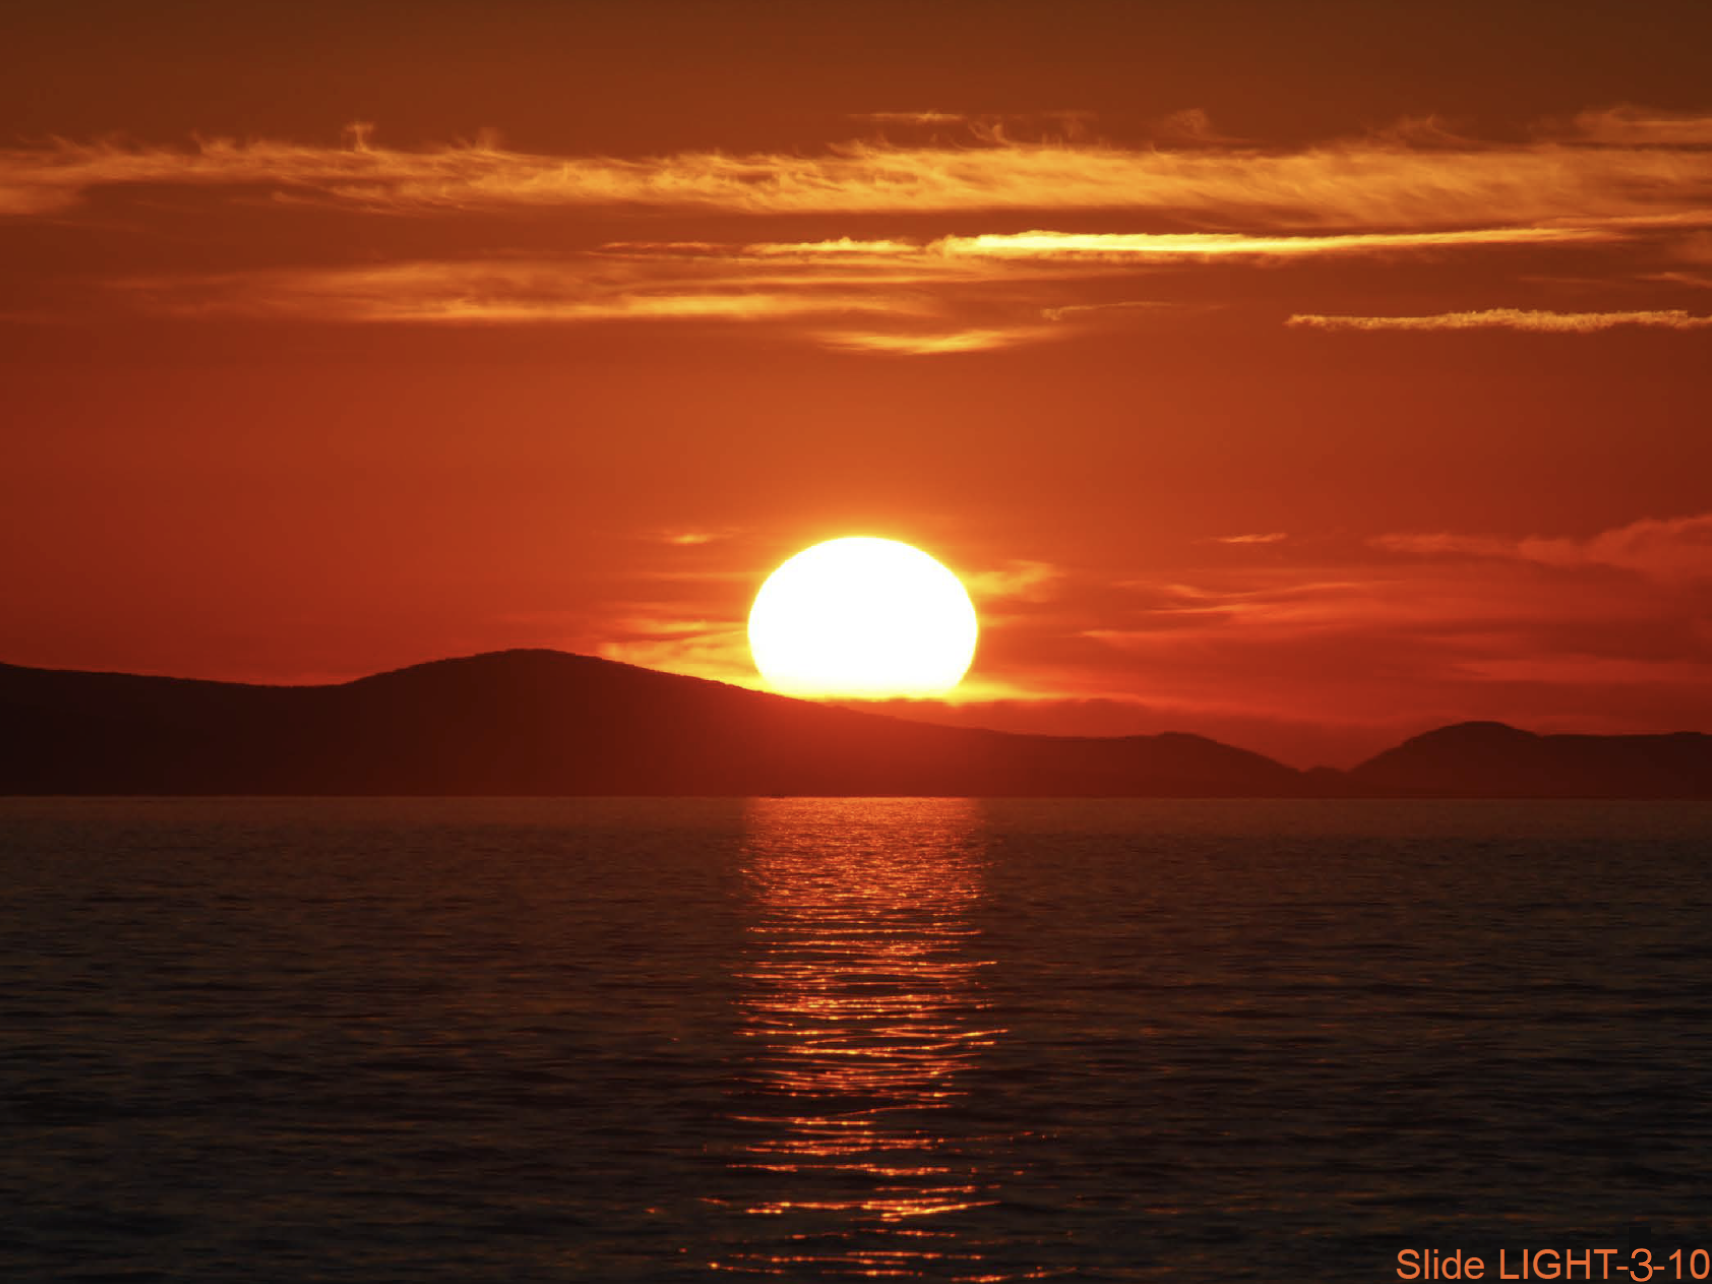
SLIDE LIGHT-3-10
- This is a magnificent picture of a sunset (although it could be a sunrise). Notice the intense red that is associated with the Sun and sky when it is very low on the horizon. The next slide explains this phenomenon. Essentially, the atmosphere acts almost like a red filter!
______________________________________________
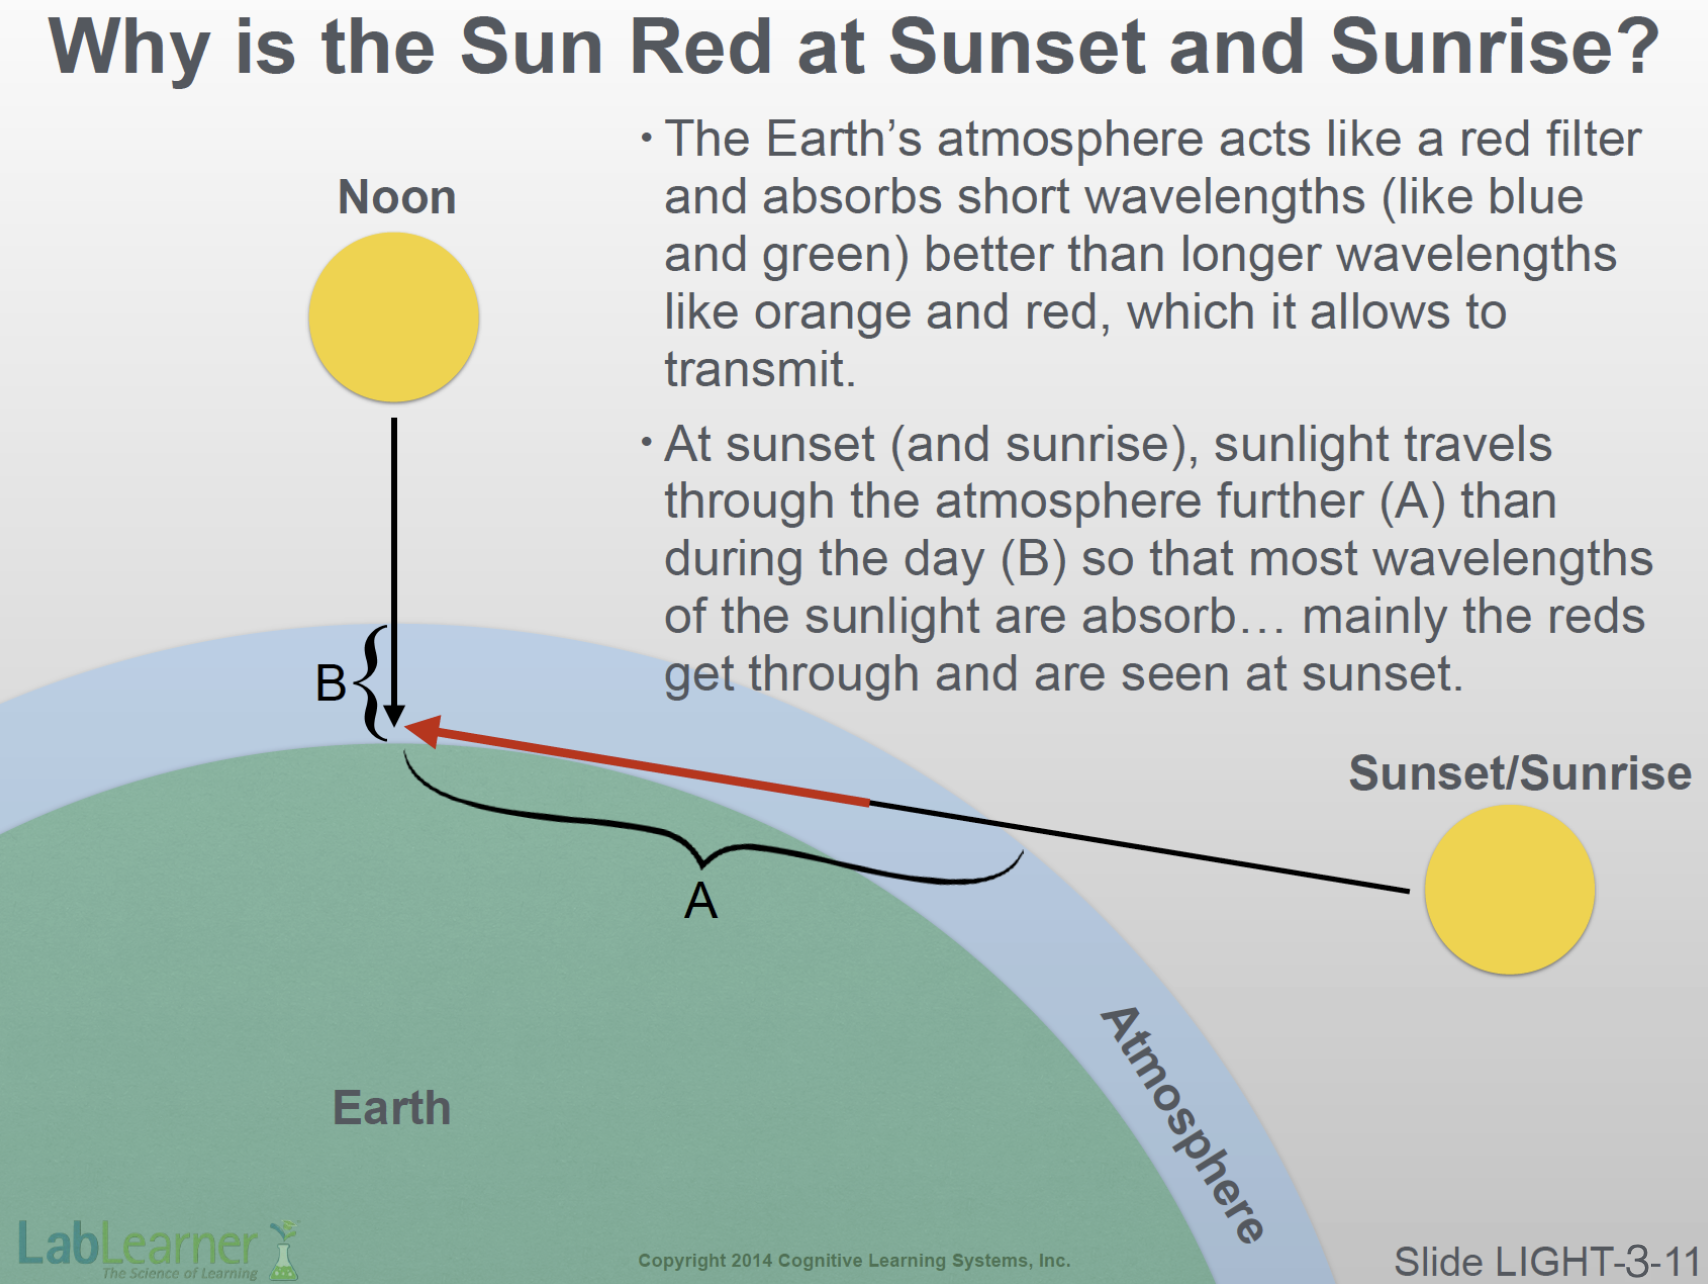
SLIDE LIGHT-3-11
- This slide shows that sunlight striking the Earth at almost a tangent, as at sunrise and sunset (A), travels through the atmosphere for a much longer distance than during the day, when the sun is higher (B).
- The molecules of the Earth’s atmosphere absorb shorter wavelengths like blue, green, and yellow better than it does longer wavelengths like reds and oranges. Consequently, the atmosphere acts somewhat like a red filter.
- As shown here, at noon, sunlight does not travel very far through the atmosphere before arriving at the Earth’s surface (B). The blue-filtering capacity of the atmosphere has minimal effect on sun rays at this time. On the other hand, at sunrise and sunset, the angle at which sunlight strikes the Earth causes it to travel much longer distances through the atmosphere (A). More blues and other colors are filtered out, leaving the brilliant reds to light up the evening sky!
______________________________________________