Teacher Portal:
Light
Investigation 1 – Lab
ZERO-IN
Italicized font represents information to be shared orally or physically completed with the students at this time.
The non-italicized font represents additional information included to support the teacher’s understanding of the content being introduced within the CELL.
MINDSET
This Investigation is designed to:
- promote student exploration of the reciprocal relationship between absorbance and transmittance of light in transparent substances: the more light transmitted by a transparent substance, the less absorbed by the substance,
- help students understand the relationship between the shade or concentration of a color and absorption and transmission of light: in transparent objects the darker the shade, the more light absorbed and the less transmitted,
- introduce students to a new tool from the Procedural Toolbox, the use and operation of a spectrophotometer, and
- help students apply the use of the best fit line tool from the Procedural Toolbox in order to create and use a concentration curve to determine the concentration of a solute in a solution.
BE PREPARED
Teacher Preparation for the Investigation includes the following. This preparation should be done prior to students arriving in the lab.
- Fill a liter pitcher with 400 ml of water. Add 4 drops of green food coloring and stir with a glass stir rod until all food coloring is dispersed. This solution will serve as the solution of unknown concentration later in the Investigation. Label the pitcher “Unknown”.
Note: Please check the absorbance of the “unknown” before using it to teach this lab. The food coloring that is being used with your lab may have a different concentration than what was used to collect data for this CELL.
- Label five (5) 100 ml beakers “Unknown” with masking tape and put 50 ml of unknown in each beaker. Rinse and dry liter pitcher.
- Place the materials at the distribution center.
- Divide the class into five cooperative groups.
Note: Each student lab group will need the materials listed below.
Student Preparation for the Investigation includes having students gather the following materials. This preparation takes place on lab day after student lab groups have settled at their assigned lab tables.
Note: The materials are listed in students’ SDRs. They are also listed below for your reference.
- (6) 400 ml beakers
- (4) 100 ml beakers
- (1) 100 ml beaker filled with 50 ml of the solution of unknown concentration
- (1) glass stir rod
- (1) 100 ml graduated cylinder
- (1) 200 ml graduated cylinder
- (7) 2cm pieces of tape
- (1) flashlight
- (1) metric ruler
- (1) sheet of white paper
- green food coloring
- (1) water bottle
- (1) spectrophotometer
- (1) cuvette
- (1) marker
- (5) plastic droppers
- (2) 1-liter pitchers filled with water
- (1) Kim wipe
- paper towels
Direct one student from each lab group to collect the materials listed in their SDRs.
INVESTIGATE
- Remind students that in this first Investigation, they will explore two ways in which light interacts with matter, absorption, and transmission.
- Encourage students to reflect on the PreLab video as they move through the procedural steps.
- Explain to students that during the Experiment, every procedural step is important. If one step is skipped, data can become invalid. To help students keep on track, direct them to read each step thoroughly, complete the step, then check it off (Read it – Do it – Check it off).
- Direct students to complete the procedural steps in their SDRs.
Note: The procedural steps are listed below for your reference. Teacher “Notes” are inserted, as needed, to help facilitate the lab.
Trial 1:
- Label the four 100 ml beakers A, B, C, and D with tape.
- Use the 100ml graduated cylinder to add 50 ml of water to each beaker A, B, C, and D.
- Add green food coloring to the following beakers:
A. Beaker B 1 drop green food coloring
B. Beaker C 5 drops green food coloring
C. Beaker D 10 drops green food coloring
- Stir the solution in beakers B, C, and D with the stir rod until the green food coloring is completely mixed.
- Look at the table and make predictions.
A. Which solution do you think will transmit the most light? Put a checkmark in Table A.
B. Which solution do you think will absorb the most light? Put a checkmark in Table A.
C. Explain the reasons for your predictions. Student answers will vary based upon their predictions.
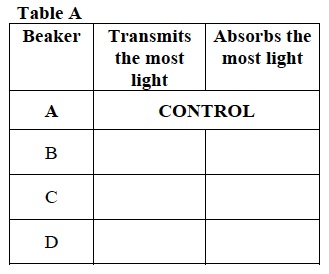
Note: Beaker A will serve as the control or “blank” for the experiment because it has no food coloring added to it. Students can use this “blank” as a reference for discerning differences in the amount of light absorbed or transmitted through the other solutions.
- Test your predictions. Stand the flashlight upright on the table. The flashlight should be turned on with the light facing the ceiling.
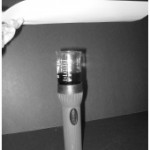
- Determine the amount of light is absorbed by the water and the beaker in control beaker A. Place Beaker A on top of the flashlight.
A. Hold the beaker and the flashlight steady to avoid spilling.
B. Hold the piece of white paper 10 cm above the beaker.
C. Observe the amount of light transmitted through the beaker onto the white paper.
8. Test the amount of light that shines through beakers B, C, and D by repeating steps 7a – d for each beaker.
9. Record: Use a checkmark to record your observations in Table B.
A. Which solution transmitted the most light? Put a checkmark in Table B.
B. Which solution absorbed the most light? Put a checkmark in Table B.
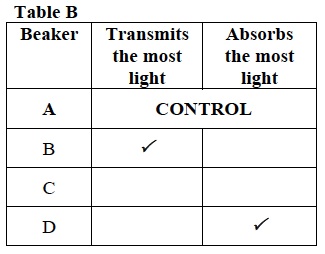
- How does the shade of the water affect how much light is absorbed and transmitted in each beaker? There appears to be a direct relationship between the shade of the solutions and the transmittance of light. The lighter the shade of the solution, the more light transmitted. The dark the shade of the solution, the less light transmitted. Assuming that very little light is reflected from the solutions, there appears to be an inverse relationship between the absorption and transmittance of light. That is, if light is only absorbed or transmitted by the solutions, then the solution that transmitted the most light, absorbed the least amount of light and the solution that transmitted the least amount of light absorbed the most amount of light.
Trial 2:
- Label the six 400 ml beakers A, B, C, D, E, and F with tape.
- Use the 200ml graduated cylinder to add 200 ml of water to each beaker A, B, C, D, E, and F.
- Add the following amount of green food coloring to the appropriate beakers:
- Beaker B 1 drop green food coloring
- Beaker C 2 drops green food coloring
- Beaker D 3 drops green food coloring
- Beaker E 4 drops green food coloring
- Beaker F 5 drops green food coloring
- Test your conclusions by obtaining numerical values for the absorbance and transmittance of light by each of the green solutions in Beakers B, C, D, E and F using the spectrophotometer. If you need help, you may refer to the Spectrophotometer Use and Operation.
A. Set the wavelength at 630 nm.
B. Use the water in beaker A as the blank.
C. Use a Kim-wipe to remove any fingerprints from the cuvette.
D. Begin with the solution in beaker B.
E. After completing the solution in beaker B, repeat steps 4a – d with the solutions in beakers C, D, E, and F.
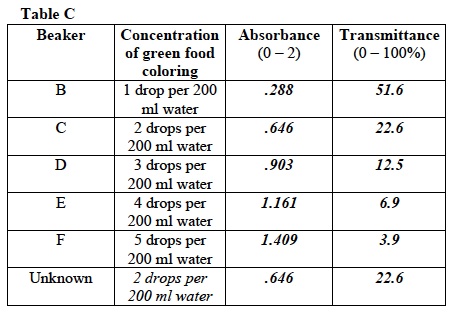
F. Record: Write the data in Table C
- How does the amount of food coloring in solutions B, C, D, E, and F affect how much light will be absorbed by the solutions? The higher the concentration of food coloring, the more light was absorbed. As the concentration of green food coloring increased from one to five drops of food coloring per 200 ml of water, the absorbance values increased.
- How does the amount of food coloring in solutions B, C, D, E, and F affect how much light will be transmitted by the solutions? The higher the concentration of food coloring, the less light was transmitted. As the concentration of green food coloring increased from one to five drops of food coloring per 200 ml of water, the transmittance values decreased.
- Obtain a 50 ml sample of the unknown solution.
- Compare the unknown sample to the solutions in beakers B, C, D, E, and F. What would you predict as the concentration of green food coloring in the unknown solution? Why? Student predictions will vary. However, students should suggest that by comparing the absorbance and transmittance values of the unknown solution to the values of the known solutions, they can predict the concentration of the unknown solution. The values of the unknown solution are between one and four drops of food coloring per 200 ml of water. Therefore the concentration of the unknown solution should be between one and four drops per 200 ml of water. In addition, students may suggest that observing the relative intensity of the shade in comparison to the shade of the solutions in the other beakers also provides a good basis for their prediction.
- Test your prediction.
A. Determine the absorbance and transmittance of the unknown solution using the spectrophotometer.
B. When you are finished using the spectrophotometer, turn the power off.
C. Record: Write the values in Table C.
CLEAN UP
Let students know your expectations for clean up. Ask them to clean up.