Teacher Portal
Friction: Investigation 3 –
Lab

ZERO-IN
Italicized font represents information to be shared orally or physically completed with the students at this time.
The non-italicized font represents additional information included to support the teacher’s understanding of the content being introduced within the CELL.
MINDSET
This Investigation is designed to:
- demonstrate to students that the frictional force between an object and a surface depends on the weight of the object,
- demonstrate to students that the frictional force between an object and a surface is independent of the surface area of the object
- use graphs to illustrate the relationships between frictional force and weight and frictional force and surface area.
BE PREPARED
Teacher Preparation for the Investigation includes the following. This preparation should be done prior to students arriving in the lab.
- Place all materials at a central location.
Note: Each student lab group will need the materials listed below.
- Divide students into cooperative groups of five students.
Student Preparation for the Investigation includes having students gather the following materials. This preparation takes place on lab day after student lab groups have settled at their assigned lab tables.
Note: The materials are listed in students’ SDRs. They are also listed below for your reference.
- (1) wood box with hook
- (1) woodblock with hook
- (3) 100 g weights
- (1) 5 N spring scale
- (1) triple beam balance
- (1) metric ruler
- (1) calculator
- (1) roll of masking tape (optional)
- (1) rubber band
- (1) meter stick (optional)
Direct one student from each lab group to collect the materials listed in their SDRs.
INVESTIGATE
- If students were unable to leave their pieces of tape on the table, instruct them to set up their lab table as in Investigations One and Two, using four pieces of tape to create a starting line and a finish line. The lines should be 50 cm apart.
- Tell students that the first variable they will investigate is weight. Instruct students to predict whether or not the weight of the wood box will affect the frictional force between it and the table. Tell students to record their predictions in their Investigation Three Data Record.
- Before beginning the experiment, ask students to identify the independent and dependent variables in this experiment. Weight is the independent variable and frictional force is the dependent variable in the experiment students will perform.
- Encourage students to reflect on the PreLab video as they move through the procedural steps.
- Explain to students that during the Experiment, every procedural step is important. If one step is skipped, data can become invalid. To help students keep on track, direct them to read each step thoroughly, complete the step, then check it off (Read it – Do it – Check it off).
- Direct students to complete the procedural steps in their SDRs.
Note: The procedural steps are listed below for your reference. Teacher “Notes” are inserted, as needed, to help facilitate the lab.
Trial 1
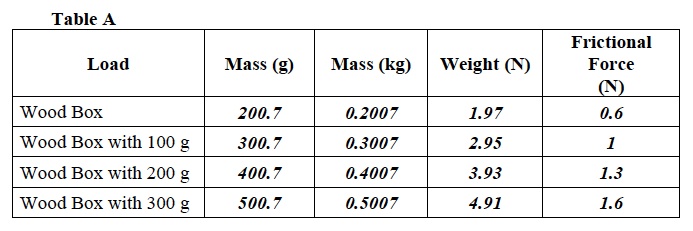
- Determine the weight of each load listed in Table A.
- To find the weight, you must first find the mass of each object.
- The mass of each 100 g weight is 100 g.
- Measure the mass of the woodblock using the triple beam balance.
- Record: Write the mass of each load in Table A.
- Calculate: Determine the mass of each load.
- Convert mass in grams to kilograms.
- This is done by dividing grams by 1000.
- grams ÷ 1000 = kilograms
- 200.7 g (wood block) ÷ 1000 = 0.2007 kg
- Record: Write the mass in kilograms in Table A.
- Calculate: Determine the weight of each load.
- Use the following formula:
- Weight (N) = mass (kg) × acceleration due to gravity (m/s2)
- Weight = 0.2007 kg × 9.8 m/s2
- Weight = 1.97 N
- Record: Write your answers in Table A.
- Use the following formula:
- Begin the trials.
- Pull each load from 20 cm behind the starting line to 20 cm past the finish line.
- Read the spring scale as the load is pulled.
- Remember to keep a constant velocity between the two lines.
- Record: Use the spring scale to determine the amount of frictional force between the load and the table. Record the value in Table A.
Note: Although the velocity at which students pull the load is not important, students must pull the load at a constant velocity.
Note: As one student is pulling the load, instruct another student should read the spring scale.
Briefly review the results as a class.
- Ask students if the amount of frictional force between the table and each load differed as the weight of the load changed? Yes, the frictional force differed.
- Graph: Use the grid below to plot the data.
- Determine which variable is the independent variable and which is the dependent variable.
- Draw a best fit line. If you need help, refer to the procedure, Drawing a Best Fit Line
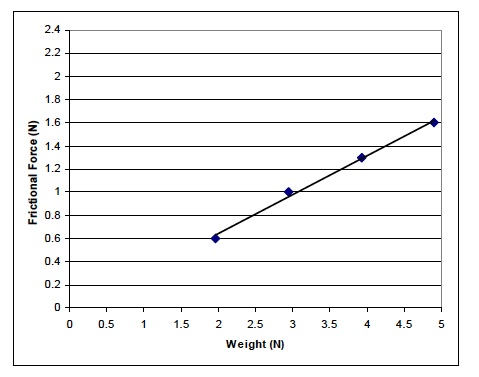
Briefly review the graph as a class.
- Ask students to describe the relationship between weight and frictional force based on their graph. As the weight of a load increased, the frictional force between the load and the surface over which it moved increased. Instruct students to answer this question in their Investigation 3 Student Data Record
Trial 2
- Tell students that the second variable they will investigate is surface area.
- Instruct students to predict whether or not the surface area of the woodblock will affect the frictional force between it and the table.
- Tell students to record their predictions in Trial 2 of their Investigation Three Data Record.
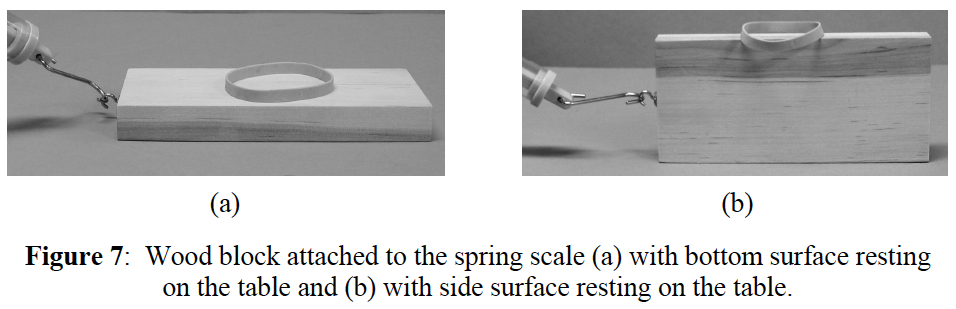
- You will pull the block across the table in three ways.
- You will pull it so that the larger bottom surface rests on the table (Figure 7a).
- You will pull it so that the smaller side surface rests on the table (Figure 7b).
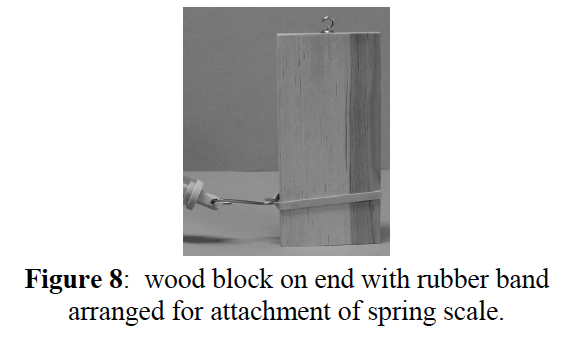
- You will pull it so that the end surface rests on the table (Figure 8).
Note: A rubber band will be needed to hook the spring scale when pulling the woodblock on its end surface. Therefore, the rubber band must be added when the woodblock is pulled on its bottom and side surfaces, as shown in Figures a and b. The rubber band must be added to each load so that the mass of the load is equalized.
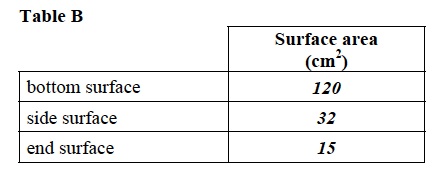
- Calculate: Determine the surface area (cm2) of each of the three surfaces.
- Use the following formula: Surface area (cm2) = length (cm) × width (cm)
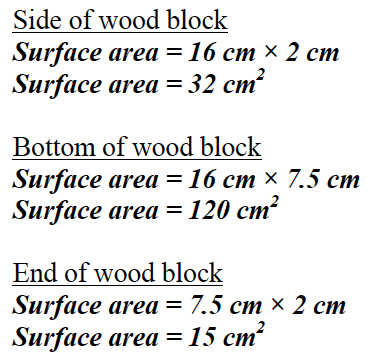
- Record: Write your answer in Table B.
Note: Teachers may give students the calculated surface area if appropriate.
- Begin the trials.
- Pull each load from 20 cm behind the starting line to 20 cm past the finish line.
- Read the spring scale as the load is pulled.
- Remember to keep a constant velocity between the two lines.
- Record: Obtain the data for surface area from Table C and write it in the second column of Table D.
- Record: Use the spring scale to determine the amount of frictional force between the load and the table. Record the value in Table C.

Briefly review the results as a class.
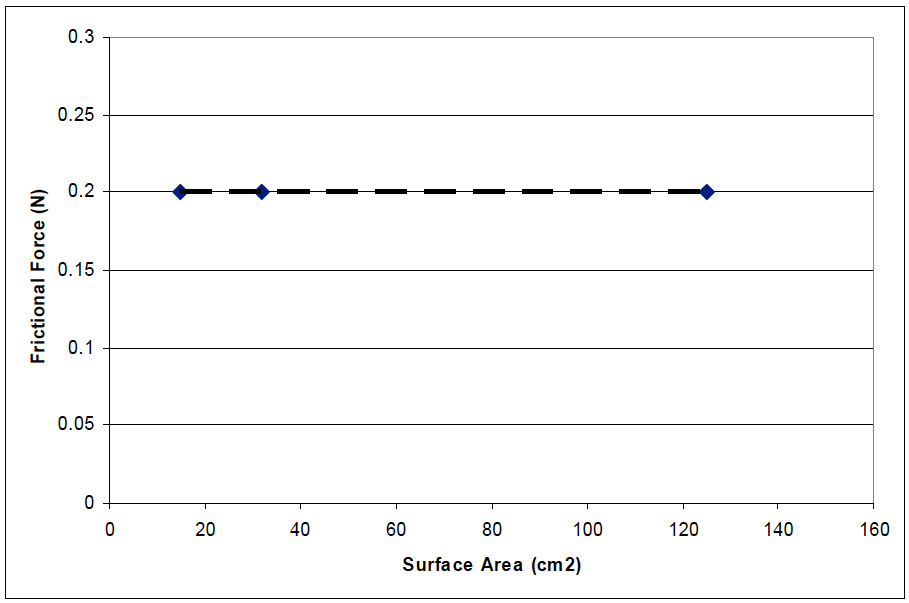
- Ask students whether the amount of frictional force between the table and the block differed as the surface area in contact with the table changed? No, the frictional force did not differ.
- Graph: Use the grid below to plot the data.
- Determine which variable is the independent variable and which is the dependent variable.
- Draw a best fit line. If you need help, refer to the procedure, Drawing a Best Fit Line.
Note: If possible, students may leave the pieces of tape marking the starting line and the finish line on their desks. These will be used for Investigation 4.
CLEAN UP
Let students know your expectations for clean up. Ask them to clean up.