Teacher Portal:
Ecosystems
Investigation 3 – PostLab

ZERO-IN
Italicized font represents information to be shared orally or physically completed with the students at this time.
The non-italicized font represents additional information included to support the teacher’s understanding of the content being introduced within the CELL.
ANALYZE IT
Note: Questions marked with a triangle (∆) are included to enrich students’ understanding. These questions do not appear in students’ SDRs but should be used as additional discussion points during the PostLab.
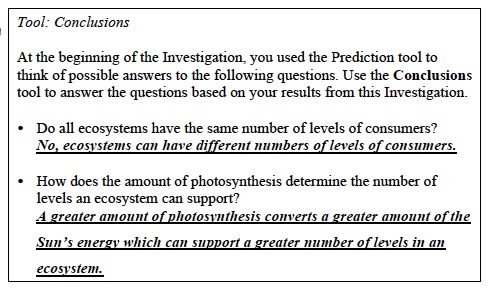
- ∆ Ask students if Ecosystem ML100 had fewer levels than Ecosystem ML300. Student answers may vary. Some groups may have demonstrated that Ecosystem ML100 could only support two levels of Carnivores, while Ecosystem ML300 could support three levels. However, other groups may have found that both ecosystems supported the same number of levels.
- ∆ Ask groups whose ecosystems had the same number of levels how their ecosystems differed. In cases where both ecosystems had the same number of levels of carnivores, Ecosystem ML100 should be able to support fewer animals in each level due to the lower amount of plant biomass. The plant biomass would have supported fewer herbivores, which in turn would have supported fewer Carnivores A, and thus fewer Carnivores B and C.
- ∆ Ask students why they think some groups found that Ecosystem ML100 supported fewer levels of carnivores than Ecosystem ML300 while other groups did not, given the fact that all groups had equal volumes of beans for each ecosystem. The differences observed between groups was a function of the average amount of biomass obtained from each ecosystem at the start of each model. There most likely was a large variation in sample size within each group’s ecosystems, as well as a large variation in sample sizes between groups. Therefore, the total amount of biomass would have varied between groups. This variation is an example of sampling error.
Note: Remind students that even though within their models they could have eliminated this variation by simply determining the total mass of beans for each ecosystem, their results illustrate one of the problems encountered by ecologists when studying ecosystems in real life.
- ∆ Ask students how they could have reduced the variation between groups for total biomass in order to obtain more consistent results when calculating animal numbers. Increasing the number of plant biomass samples taken within each ecosystem would have decreased the sampling error and increased the chance that all groups would have obtained the same results.
Instruct students to complete the Analysis Questions in their SDRs then discuss them as a class. Use the suggested responses below to guide students’ answers.
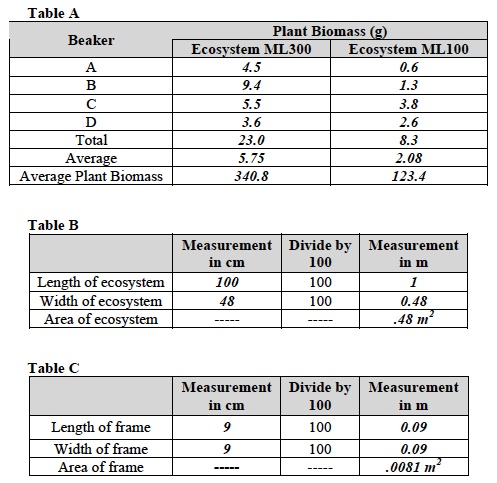
- Compare the two models. How does Ecosystem ML100 differ from Ecosystem ML300? Ecosystem ML100 had a smaller amount of plant biomass than Ecosystem ML300. This ecosystem also had fewer numbers of herbivores, Carnivore A animals, and Carnivore B animals than Ecosystem ML300, and did not have any Carnivore C animals. In addition there was less biomass at each level of the ecosystem in Ecosystem ML 100 than Ecosystem ML 300.
- Compare the amount of plant biomass in each ecosystem. What does the difference in biomass tell you about the amount of energy present in each ecosystem? Student answers may vary. The amount of biomass in an ecosystem determines the amount of energy present in an ecosystem because the energy is contained in the biomass. Therefore, the amount of energy present in Ecosystem ML300 is greater than the amount of energy present in Ecosystem ML100.
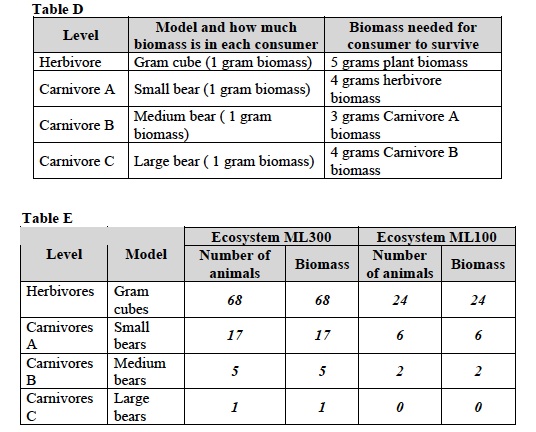
- Why was Ecosystem ML300 able to support more levels than Ecosystem ML100? Student answers may vary. Ecosystem ML300 had a greater plant biomass than Ecosystem ML100. The greater plant biomass in Ecosystem ML300 suggests that Ecosystem ML300 underwent more photosynthesis than Ecosystem ML100, allowing plants to create more biomass and thus store greater amounts of energy. The greater amount of biomass and stored energy in Ecosystem ML300’s plant level supported 68 herbivores, which supported 17 Carnivores A. The Carnivores A level had enough biomass to support 5 Carnivores B, supplying enough biomass to support 1 Carnivore C. In contrast, Ecosystem ML100 had enough plant biomass to support only 24 herbivores. The biomass in 24 herbivores supported 6 Carnivores A, which in turn supported 2 Carnivores B. There was not enough Carnivore B biomass to support any Carnivores C. Therefore, students should conclude that the number of levels in an ecosystem is dependent upon the amount of photosynthesis that occurs in the plant level.
GET FOCUSED
Instruct students to complete the Focus Questions in their SDRs then discuss them as a class. Use the suggested responses below to guide students’ answers.
- What is the relationship between the energy and biomass of producers and the levels that an ecosystem can support? The amount of energy that is stored by producers determines the amount of biomass they can form. The amount of biomass and energy at the producer level determines the amount of biomass and energy that can be produced in each of the upper levels of the ecosystem. As the amount of biomass and energy increases in upper levels, the greater the number of levels an ecosystem can support.
- What affects the amount of energy in an ecosystem? The amount of energy in an ecosystem is determined by the amount of biomass in the ecosystem. The amount of biomass in the ecosystem is determined by the amount of photosynthesis that occurs at the producer level. The amount of photosynthesis determines the amount of energy that is stored by the producers in their biomass and can thus move through the ecosystem.