Teacher Portal:
Ecosystems
Investigation 2 – PostLab
ZERO-IN
Italicized font represents information to be shared orally or physically completed with the students at this time.
The non-italicized font represents additional information included to support the teacher’s understanding of the content being introduced within the CELL.
ANALYZE IT
Instruct students to complete the Analysis Questions in their SDRs then discuss them as a class. Use the suggested responses below to guide students’ answers.
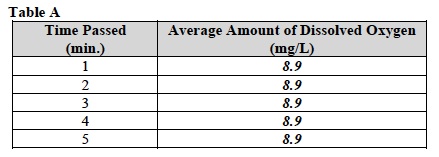
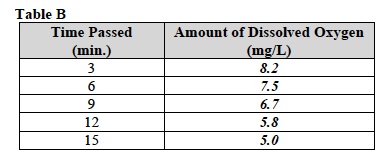
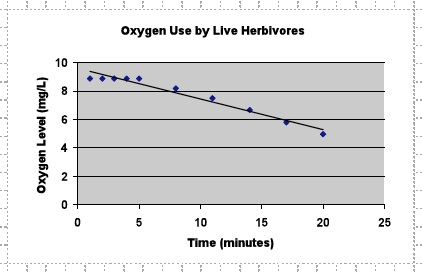
- Create a line graph (using a best fit line) that shows the amount of oxygen used by the “Live Herbivore” over time. Remember to start the graph by plotting the amount of oxygen that was in the beaker before the “Live Herbivore” was added. Use the data from Tables A and B to create your graph.
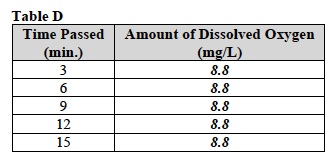
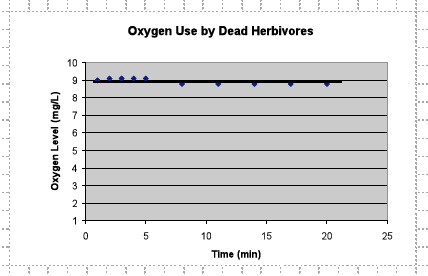
- Create a line graph (using a best fit line) that shows the amount of oxygen used by the “Dead Herbivore”. Remember to start the graph by plotting the amount of oxygen that was in the beaker before the “Dead Herbivore” was added. Use the data from Tables C and D to create your graph.
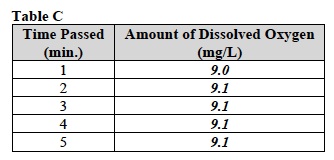
Note: Students may observe that the oxygen level initially decreases when the dead yeast is added to the beaker and infer that this decrease is due to oxygen consumption by the yeast. However, the initial decrease in oxygen level is due to the increase in the volume of the solution, which dilutes the oxygen concentration. The oxygen level does not decrease due to cellular respiration by the yeast, as the oxygen level does not change during the remainder of the model.
- Look at the graph of the “Live Herbivore”. What happened to the oxygen level over time? Oxygen levels decreased over time.
- Remember, the more oxygen that is used up, the more energy that an animal uses to live. Did the “Live Herbivore” use energy to live? Explain your answer. The live herbivore used energy to live because the oxygen level in the sugar solution decreased from 8.2 mg/L to 5.0 mg/L after the “Live Herbivore” was added to the water. The oxygen levels before the addition of the “Live Herbivore” did not change, indicating that the disappearance of oxygen after the addition was due to the use of energy by the “Live Herbivore”.
- Look at the graph of the “Dead Herbivore”. What happened to the oxygen level over time? Oxygen levels stayed the same.
- The more oxygen that is used up, the more energy that an animal uses to live. Did the “Dead Herbivore” use energy to live? Explain your answer. The “Dead Herbivore” did not use any energy to live. The oxygen level remained steady at 8.8 mg/L after the addition of the “Dead Herbivore”. This indicates that the “Dead Herbivore” was not using oxygen and therefore was not using energy.
- Describe the difference in the amount of oxygen that was used by the “Live Herbivore” and the “Dead Herbivore.” The live herbivore used more and more oxygen as it continued to live. After 3 minutes the average dissolved oxygen was 8.2 mg/L but after 12 minutes it was at 5.8 mg/L. The dead herbivore did not use any oxygen, as the data showed a steady rate of 8.8 mg/L.
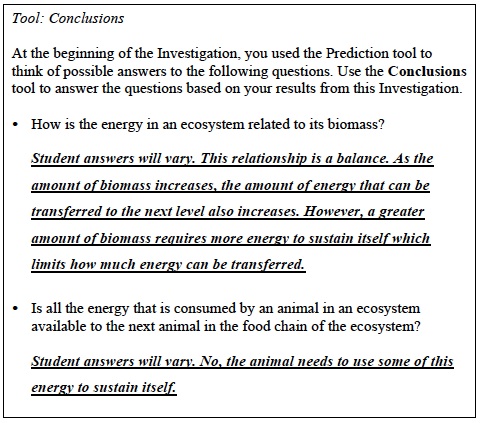
- In your models, sugar represented food, yeast represented an herbivore, and dissolved oxygen represented the energy consumed by the herbivore. Based on your results, was the live herbivore able to store all the energy it consumed? Use your data to explain your answer. The “Live Herbivore” was not able to store all the energy it consumed. During the experiment, the oxygen level decreased in the solution from 8.2 mg/L to 5.0 mg/L, indicating that the herbivore was using some of the energy it consumed to live.
- How does the data from the “Dead Herbivore” model show that cellular respiration is the reason for the decrease in the amount of energy available for transfer from the herbivores to the next level of the ecosystem? Both models contained sugar, yeast, and dissolved oxygen at the beginning of each experiment. The single difference between the two models was that in one model the yeast was dead. As the experiments progressed, the oxygen content of the solution decreased in the “Live Herbivore” model but did not decrease in the “Dead Herbivore” model. The only difference between the two models was that the yeast was undergoing cellular respiration in the model in which the oxygen level decreased. Therefore, the reason for the decrease in the amount of oxygen in the “Live Herbivore” model must be the use of oxygen, and thus energy, for cellular respiration.
- In theory, all of the energy that is consumed at one level should be available to the next level. Thus, energy transfer should be 100% efficient. How do the results of your experiment demonstrate why energy transfer between the levels of an ecosystem is inefficient? Student answers may vary. The results indicate that as the cells of an organism respire, they use some of the energy from their food instead of storing it. The only energy from the organism’s food that is available to its consumer is the energy that was stored by the organism. The energy that the organism used was not stored, so is not available to the consumer.
GET FOCUSED
Instruct students to complete the Focus Question in their SDRs then discuss it as a class. Use the suggested response below to guide students’ answers.
- What affects the efficiency of energy transfer within an ecosystem? The efficiency of energy transfer is affected by the use of energy by an organism. All organisms must use some energy to live, and therefore cannot store all the energy that they consume. Therefore, the transfer of energy from one level to another is not 100% efficient. This was demonstrated by the “Live Herbivore” model. The “Live Herbivore” consumed oxygen, indicating that it was using energy to live. The energy used by the herbivore to live was no longer available to any organism that might consume the herbivore.