Teacher Portal:
Atmosphere
Investigation 2 – Lab
ZERO-IN
Italicized font represents information to be shared orally or physically completed with the students at this time.
The non-italicized font represents additional information included to support the teacher’s understanding of the content being introduced within the CELL.
MINDSET
This Investigation is designed to:
- introduce students to the concept of atmospheric pressure,
- provide students with the opportunity to model changes in the movement of air associated with low and high-pressure centers or systems,
- help students correlate the high pressure and low-pressure symbols on a weather map with an understanding of how the air is moving in the atmosphere,
- encourage students to understand that wind is the result of differences in pressure between to areas in the atmosphere,
- help students understand that wind is the horizontal movement of air that is initiated by a force called the pressure gradient force,
- provide students with an opportunity to model how differences in pressure result in wind,
- promote the concept that the direction that wind blows is always from an area of higher pressure to an area of lower pressure,
- encourage students to understand that the greater the difference in pressure between two areas, the greater the strength of the wind, and
- give students the opportunity to create a model of a barometer and to use the model to simulate how changes in atmospheric pressure are measured with a barometer.
BE PREPARED
Teacher Preparation for the Investigation includes the following. This preparation should be done prior to students arriving in the lab.
- Prepare one copy of Isobar Maps A1, A2, A3, A4, B1, and B2 for each student group. Maps may preassembled for each student group to save time during the Investigation. In addition, if desired the Isobar Maps can be laminated and students can record their results using overhead pens. This alteration will allow for the same Isobar Map to be used for multiple classes.
- Each student group will need access to water for Trial 2. If access to water is not convenient, fill one (1) 400 ml beaker with 100 ml of water for each group. Several drops of food coloring may be added to the water for increased visibility.
- Prepare a 2 mm stack of 8.5”x 11” paper for each group.
- Prepare 4 pieces of masking tape for each group. Each piece should be 2-3 cm in length.
- Place all materials at a central location.
- Divide students into cooperative groups of five students.
Note: Each student lab group will need the materials listed below.
Student Preparation for the Investigation includes having students gather the following materials. This preparation takes place on lab day after student lab groups have settled at their assigned lab tables.
Note: The materials are listed in students’ SDRs. They are also listed below for your reference.
- (1) 500 ml Erlenmeyer flask
- (1) #7 one-hole rubber stopper
- (1) L tubing connector
- (2) pieces of tubing 30 cm long
- (1) test tube
- (1) lab marker
- (1) metric ruler
- (1) tubing clamp
- (1) 50 ml syringe (graduations up to 60 ml)
- (1) small rubber band
- (1) 100 ml graduated cylinder
- (1) 400 ml beaker
- (1) metric ruler
- one copy of Isobar Maps A1, A2, A3, A4, B1 and B2
- (1) square piece of aluminum foil
- (1) meter stick
- (1) stack of paper
- (4) pieces of masking tape
- green food coloring
Direct one student from each lab group to collect the materials listed in their SDRs.
Student Preparation for the Investigation includes having students gather the following materials. This preparation takes place on lab day after student lab groups have settled at their assigned lab tables.
Note: The materials are listed in students’ SDRs. They are also listed below for your reference.
- (1) 500 ml Erlenmeyer flask
- (1) balloon
- (1) medium size rubber band
- (1) hot plate/stirrer
- (1) pair of hot hands protectors
- (2) binder clips
- (1) stopwatch/timer
- (1) calculator
- (1) metric ruler
- (1) triple beam balance
- (1) liter graduated cylinder
- (1) piece of wire mesh
- (1) support ring
- (2) metal thermometers
- (2) thermometers (-20ºC – 150ºC)
- (1) pair of metal tongs
- (1) small container
- (1) 1L Erlenmeyer flask
- (1) liter pitcher
- (1) 2 prong clamp
- (1) metal cube
- (1) ring stand
- (1) ice pack
- (1) pair of goggles per student
- (2) paper towels
Direct one student from each lab group to collect the materials listed in their SDRs.
INVESTIGATE
- Explain that in the first trial, students will simulate how air moves in low and high-pressure centers. In the second trial, they will investigate the effect that differences in pressure have on weather.
- Encourage students to reflect on the PreLab video as they move through the procedural steps.
- Explain to students that during the Experiment, every procedural step is important. If one step is skipped, data can become invalid. To help students keep on track, direct them to read each step thoroughly, complete the step, then check it off (Read it – Do it – Check it off).
- Direct students to complete procedural steps in their SDRs.
Note: The procedural steps are listed below for your reference. Teacher “Notes” are inserted, as needed, to help facilitate the lab.
Note: In Trial One students will simulate the direction of airflow around high and low-pressure centers. Students will use the techniques for creating high and low-pressure centers from Trial 1 as part of Trial 2. Successful completion of Trial 2 requires that students feel the direction in which air moves in high and low-pressure centers. As students complete Trial 1 they should feel the downward movement of air when simulating a high-pressure center and the upward movement of air when simulating a low-pressure center. If necessary, encourage students to perform Trial 1 until they can feel the movement of air associated with the model of each type of pressure system.
Trial 1:
- In this Trial, you will model how areas of low and high pressure result from different movements of air.
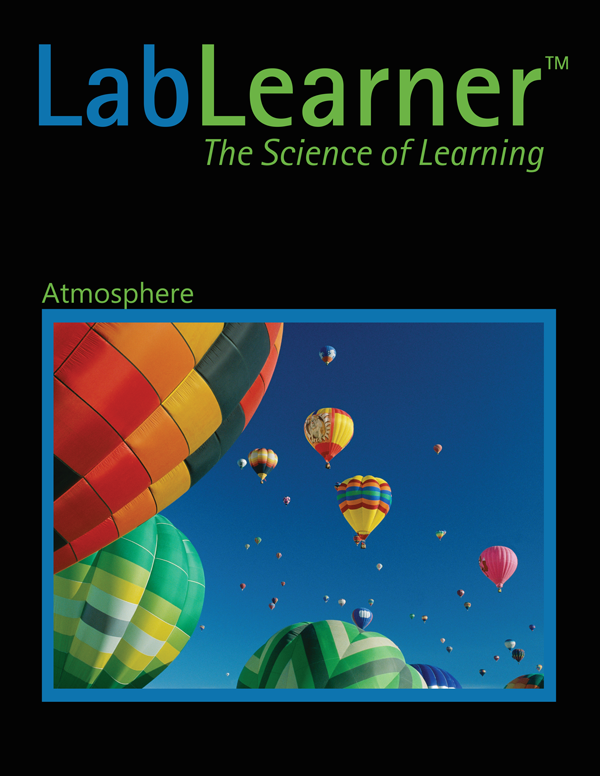
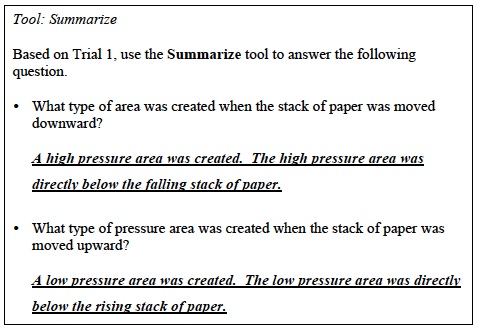
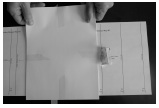
- Obtain a stack of white paper. Use masking tape to hold the stack together. Place a piece of masking tape on the paper in four different locations: the center of each side and the center of the top and bottom of the stack.
- Pull the masking tape from the top paper to the paper on the bottom of the stack and secure.
- The stack of paper will be used to create two different types of air movement.
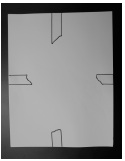
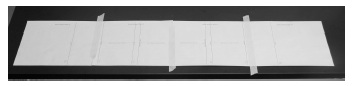
- Lift the stack of paper 50 cm above the surface of the table. Use the meter to help position the stack of paper.
- Model the downward movement of air from the upper levels of the atmosphere to the Earth. Grasp the paper stack with two hands and move it from the 50 cm mark to 2 cm above the surface of the table as fast as possible.
- Get ready to repeat step 6. This time, place a hand with the palm facing upwards on the surface of the table just below the raised stack of paper. Model the downward movement of air by repeating step 6.
- Did you feel the rush of air on the palm of your hand? In which direction was the air moving? Students should indicate that they felt air moving onto their palm. Air moved in a downward direction.
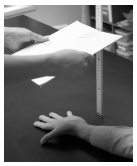
- Model the upward movement of air from the Earth to the upper levels of the atmosphere. Place the stack of paper on the lab table. Grasp it with two hands and move it as quickly as possible to the 50 cm mark.
- Get ready to repeat step 9. This time place a hand with the palm facing downward just above the 50 cm mark on the meter stick. Model the upward movement of air by repeating step 9.
- Did you feel the rush of air on the palm of your hand? In which direction was the air moving? Students should indicate that they felt air moving onto their palm. Air moved in an upward direction.
Trial 2:
Note: In Trial 2 students will create areas of different pressure by creating either a centrally located high or low-pressure center. Students will then be asked in which direction does air move? In this scenario, the horizontal movement of air is referred to as wind.
- In this Trial, you will investigate how differences in pressure affect the movement of air and winds.
- Obtain a copy of “Isobar Distance Map A1, A2, A3, and A4.” These maps will show two different areas of pressure separated by different distances.
A. Place the sheet together end to end.
B. Use a piece of masking tape to hold the pieces together.
C. Secure the map to the table using masking tape.
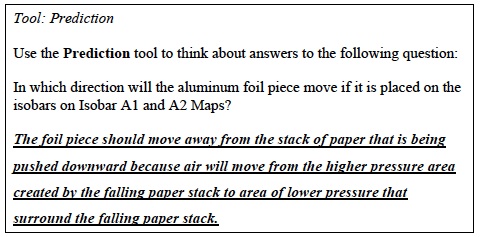
- Look at the pressure differences between the “High-Pressure Center” and the other isobars. Is the pressure of the other isobars higher or low than the “High-Pressure Center?” The pressure of the High-Pressure Center is higher than the other isobars.
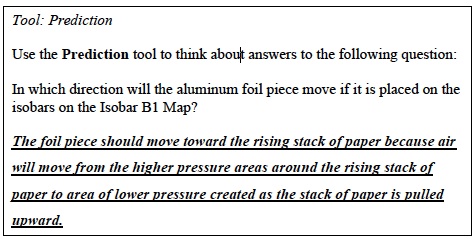
- Obtain one piece of aluminum foil. Fold the piece into the shape of a tent. This will be used to determine whether there is a movement of air between areas of different pressures.

- Place the front edge of the aluminum foil on the 1000 mb at 20 km line on Isobar Map A3. These isobars model an area of lower pressure 20 km from the “High-Pressure Center.” The “High-Pressure Center” has an atmospheric pressure of 1020 mb.
- Raise the stack of paper so that it is 10 cm above the center of the “High-Pressure Center.”
- Create an area that has a higher pressure than the surrounding isobars by dropping the paper stack onto the “High-Pressure Center” area of the paper. Observe the motion of the aluminum foil.
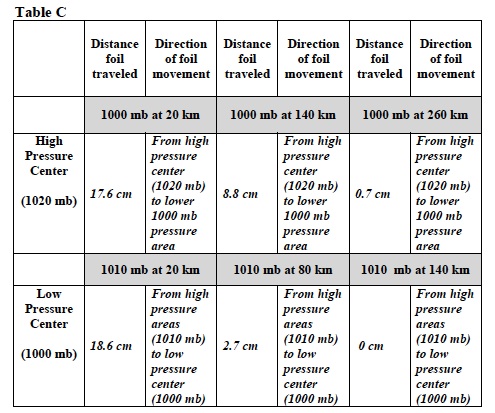
- Record: Place an X on the Isobar A3 map where the aluminum foil piece ended. Label the X “Distance 1” Distance 1= 25 cm
- Repeat steps 7 and 8 two more times. Label the X’s “Distance 1.” Distance 1= 11.5 cm, 16.5 cm
- Record: Measure the distances the aluminum foil piece traveled from the 1000 mb line at 20 km. Take the average of the three distances. Write the average distance in Table C.
- What happened to the piece of aluminum foil? Describe or use a drawing to show the direction in which it moved. Record the information in Table C.
- Test what happens if the distance between the higher and lower pressure areas is increased. Place the aluminum foil piece Isobar A3 Map at the 1000 mb isobar labeled “1000 mb at 140 km.”
- Create an area that has a higher pressure than the surrounding isobars by dropping the paper stack onto the “High-Pressure Center” area of the paper. Observe the motion of the aluminum foil pieces.
- Record: Place an X on the Isobar A3 map where the aluminum foil piece landed. Label the X “Distance 2” Distance 2= 7 cm
- Repeat steps 7 and 8 two more times. Label the X’s “Distance 2.” Distance 2= 10.5 cm, 9 cm
- Record: Measure the distances the aluminum foil piece traveled from the 1000 mb line at 140 km. Take the average of the three distances. Write the average distance in Table C.
- Test what happens if the distance between the higher and lower pressure areas is again increased. Place the piece of aluminum foil on IsoBar A4 Map on the 1000 mb isobar labeled “1000 mb at 260 km.” Drop the stack of paper to create an area of higher pressure. Label the locations “Distance 3” and record the average distance and all other observations in Table C. Distance 3= 0 cm, 2 cm, 0 cm
- Test the prediction. Place the aluminum foil piece on A1 and A2 isobar maps on the 1000 mb isobar at 20 km 140 km, and then 260 km. Drop the stack of paper to create an area of higher pressure for each isobar line and observe what happens.
- Record: In Table C, describe the direction the aluminum foil moved in.
- Obtain a copy of “Isobar Distance Map B1and B2.” These maps will show two different areas of pressure separated by different distances.
A. Place the sheets end to end.
B. Use a piece of masking tape to hold the pieces together.
C. Secure the map to the table with masking tape.
21. Look at the pressure differences between the “Low-Pressure Center” and the other isobars. Is the pressure of the other isobars higher or lower than the “Low-Pressure Center?” The pressure of the Low-Pressure Center is lower than the other isobars.
22. Obtain the piece of aluminum foil. It will be used to determine whether there is a movement of air between areas of different pressures.
23. Place the front edge of the aluminum foil on the 1010 mb at 20 km lines. These isobars model an area of higher pressure 20 km from the “Low-Pressure Center.” The atmospheric pressure at the “Low-Pressure Center” is 1000 mb.
24. Place the stack of paper on the areas labeled “Low-Pressure Center.”
- Create an area that has a lower pressure than the surrounding isobars by moving the stack of paper upward as quickly as possible. Observe the motion of the aluminum foil piece.
Note: It may be necessary for students to take several “practice” pulls on the stack of paper when creating the low-pressure system. In order to create an area of lower pressure, the stack of paper must be pulled or “jerked” up very quickly. If necessary, demonstrate this motion for students.
- Record: Place an X on the Isobar B2 map where the aluminum foil piece ended. Label the X “Distance 1” Distance 1= 18 cm 27.
- Lift the stack of paper to create a lower pressure area two more times. Label the X’s “Distance 1.” Distance 1= 22 cm, 16 cm 28.
- Record: Measure the distances the aluminum foil piece traveled. Take the average of the three distances. Write the average distance in Table C.
- What happened to the piece of aluminum foil? Describe or use a drawing to show the direction in which it moved. Record the information in Table C.
- Test what happens if the distance between the “Low-Pressure Center” and the area of higher pressure increases. Place the aluminum foil piece at the two other isobars on the Isobar Map B1. Create areas of lower pressure by lifting the paper stack upwards. Label the X’s “ Distances 2 and 3. Distance 2= 2.5 cm, 2.5 cm, 3 cm Distance 3= 0 cm, 0 cm, 0 cm
- Record: Write the average distances the foil piece traveled and describe or use a drawing to sketch the direction of movement in Table C.
- Test the prediction. Place the aluminum foil piece on the 1010 mb isobar at 20 km, 80 km, and then 140 km. Create areas of lower pressure for each isobar line by lifting the paper stack upwards and observe what happens.
- Record: Describe the direction the aluminum foil pieces moved in Table C.
Trial 3:
Note: In Trial 3 students will create a model of a barometer and use the model to simulate how changes in atmospheric pressure are measured using a barometer. Students should record the data for Trial 3 in Table D.
- In this Trial, you will construct a model of a barometer and observe how changes in atmospheric pressure are measured using a barometer.
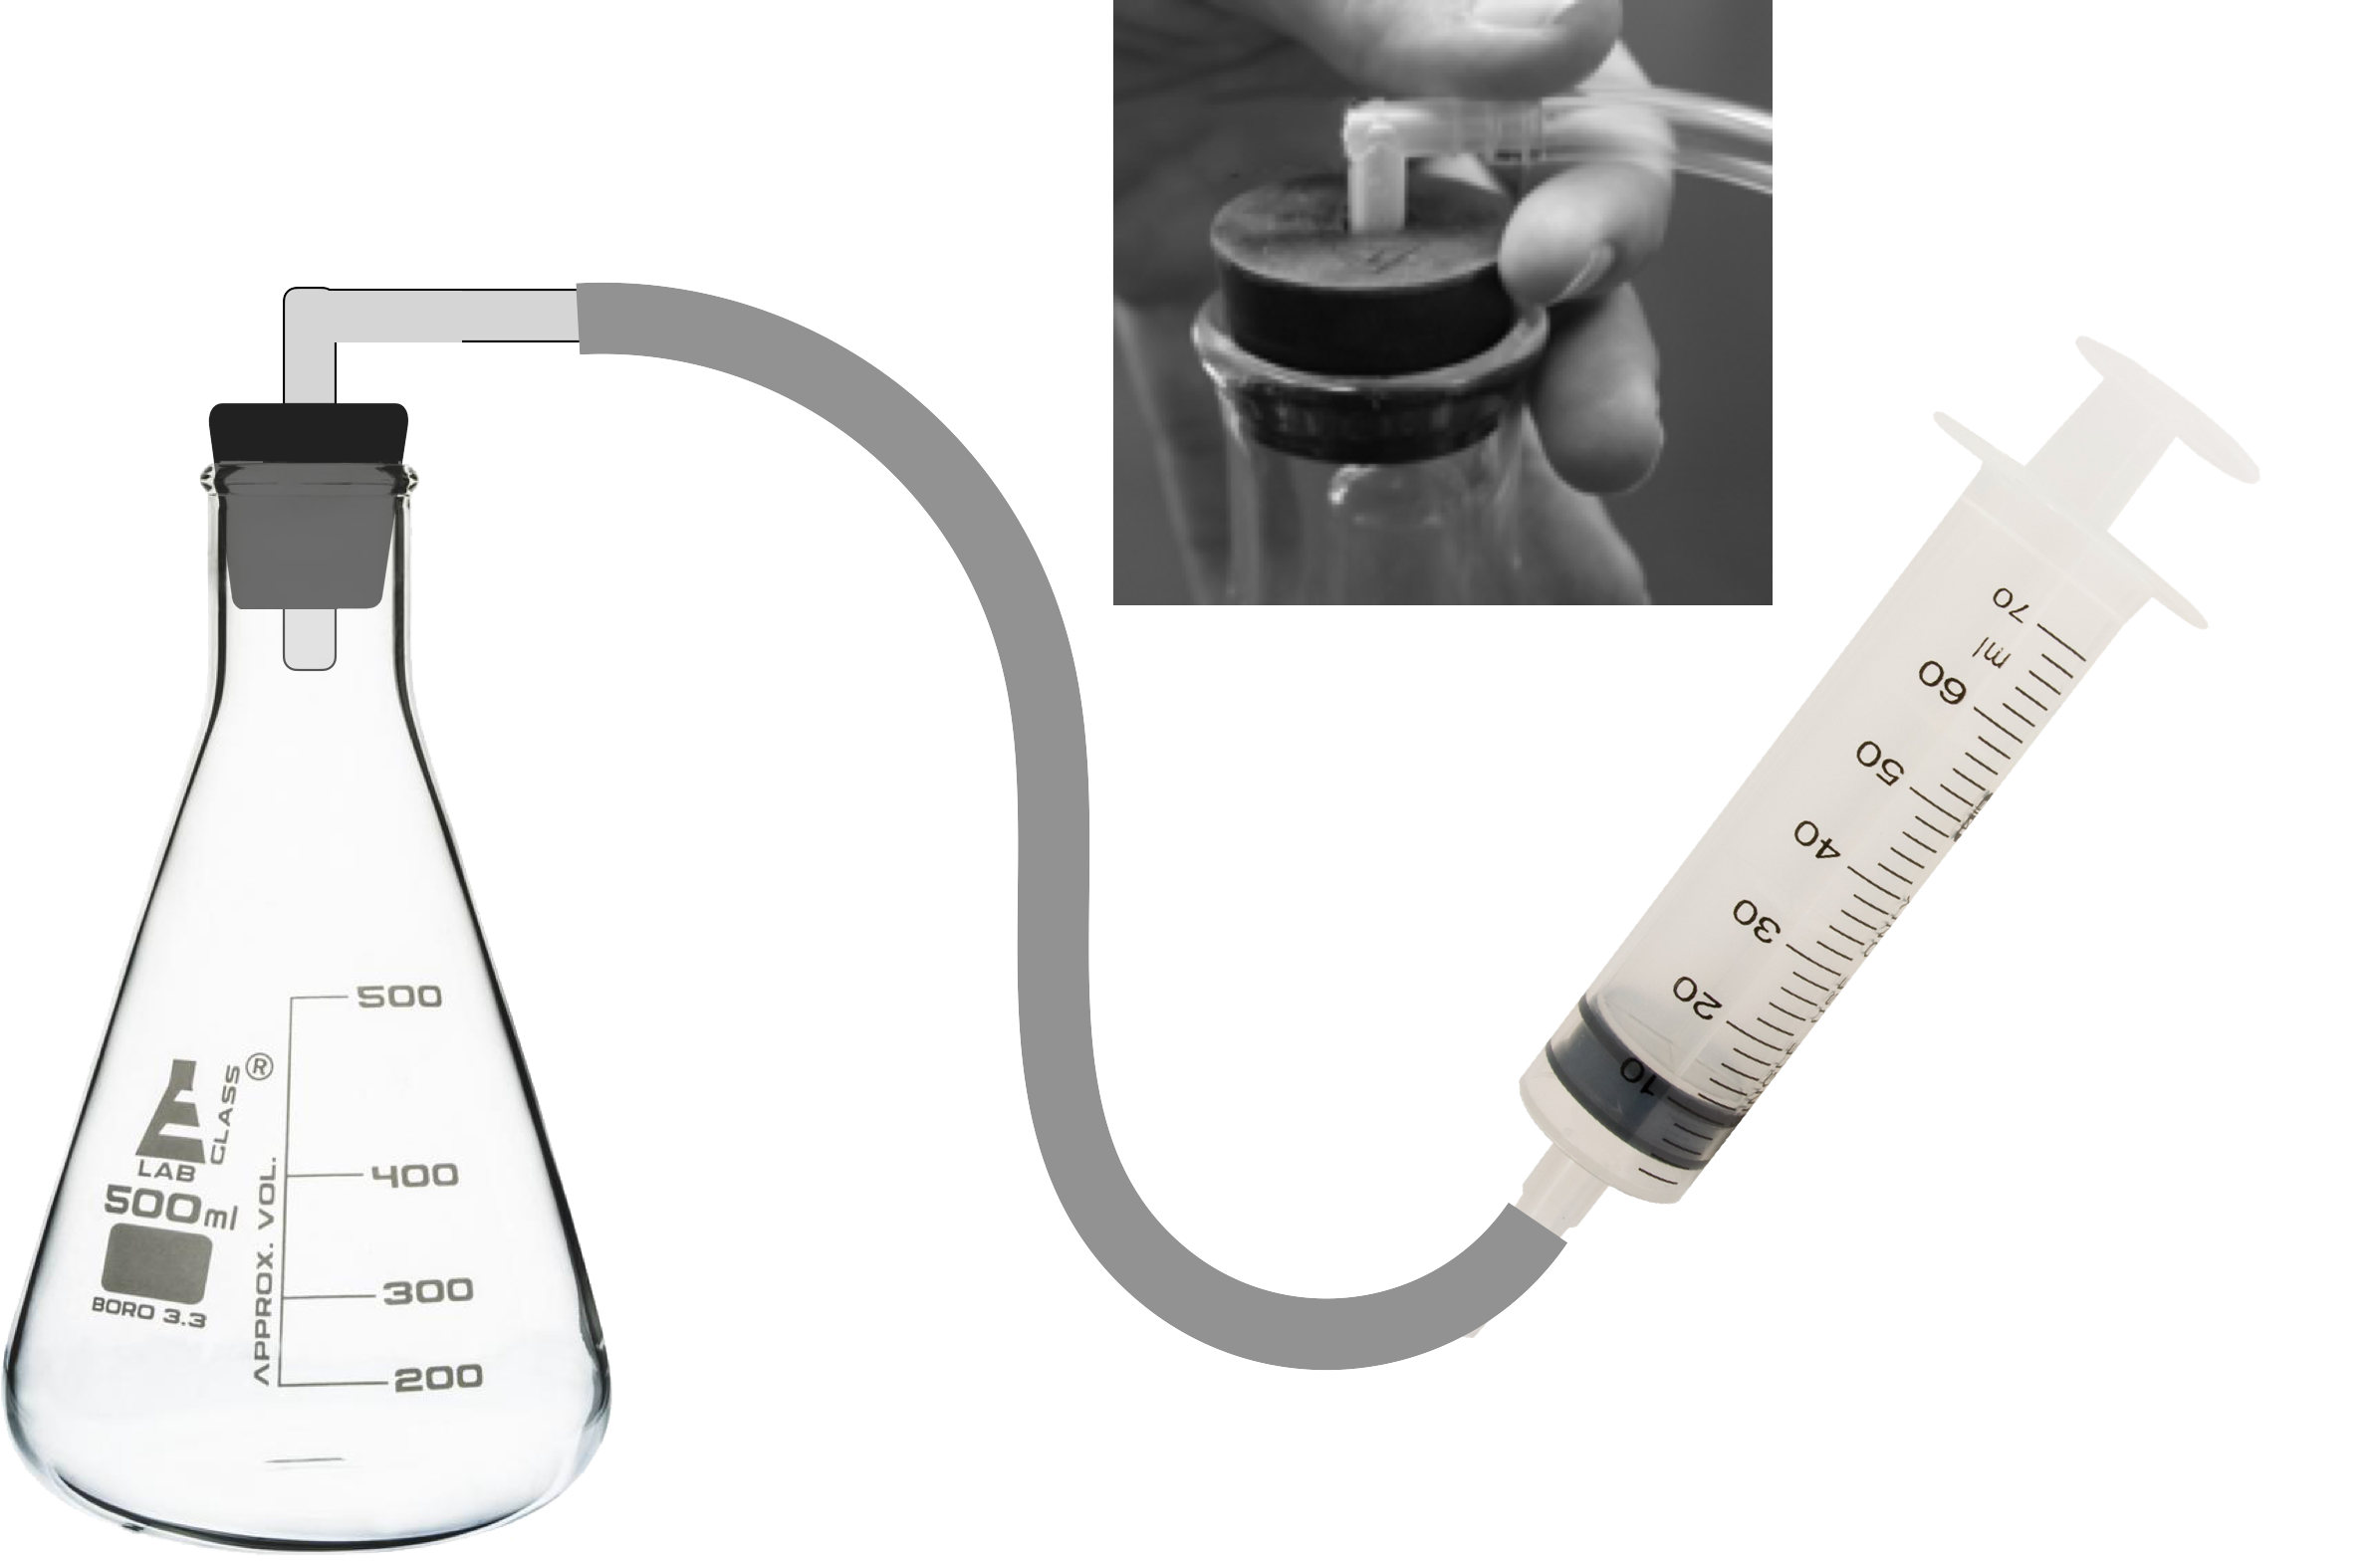
- Construct a model of a barometer.
A. Use a graduated cylinder to pour 100 ml of water into a 500 ml flask. Add one drop of green food coloring to the water.
B. Obtain a test tube and turn it upside down. Using a metric ruler, make marks at 0.5, 1, 2, 3, 4, 5, 6, 7, and 8 cm from the open end of the tube.
C. Place the test tube into the flask with the open end down. Some water will move into the test tube.
D. Insert the L connector into the stopper hole.
E. Put the 60 ml syringe into one end of the tubing and use a rubber band to secure the syringe onto the tubing.
F. Remove the syringe plunger from the syringe.
G. Place stopper with the L connector into the top of the flask. Gently push down on the rubber stopper to make sure that the stopper is sealed into the opening.
H. Re-insert the plunger into the syringe so that it passes the “stop line.” This is just above the 60 ml mark. As this occurs, there should be some resistance in the syringe.
I. Check the model using the picture to the right. Observe the level of water in the test tube. It should be just above or equal to the water level in the flask. If the water level is too high or too low, disconnect and then reconnect the tubing on the syringe and the tubing that runs from the syringe to the L connector.
- Model the changes in the barometer that occur with changes in atmospheric pressure.
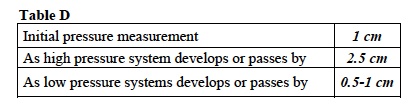
- Record: Take an initial pressure reading by determining the level of water in the test tube. Write the “pressure” in Table D under “Initial Pressure.” Record the pressure in cm of water.
- Model the creation of an area of high pressure. Push air into the flask slowly by pushing the syringe plunger into the syringe as far as it can go. Be careful not to push too quickly or the stopper will pop out.
- Record: Write the “pressure” in Table D under “As high-pressure system develops or passes by.”
- Model the creation of an area of low pressure. Pull air out of the flask by slowing pulling the plunger back to the stop line.
- Record: Write the “pressure” in Table D under “As low-pressure system develops or passes by.”
CLEAN UP
Let students know your expectations for clean up. Ask them to clean up.