Teacher Portal:
Atmosphere
Performance Assessment
 ZERO-IN
 ZERO-IN
The italicized font represents information to be shared orally or physically completed with the students at this time.
The non-italicized font represents additional information included supporting the teacher’s understanding of the content being introduced within the CELL.
MINDSET
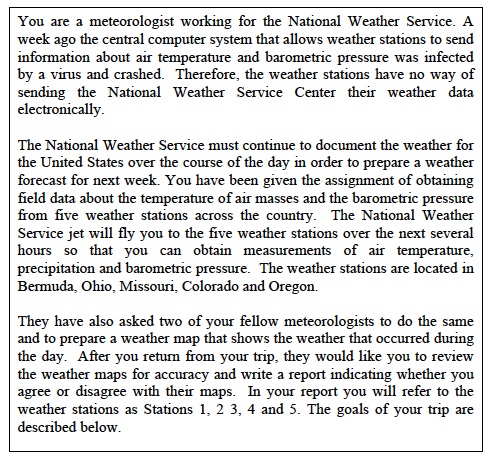
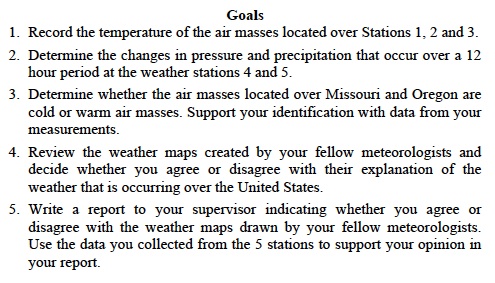
This Investigation is designed to allow students to solve a problem using the
- concepts with which they have become familiar during the previous investigations, and
- procedures used during the previous Investigations.
DOWNLOAD IT – PRINT IT
By clicking the link below, the Performance Assessment Grading Rubric may be downloaded as a PDF (Portable Document Format) and printed. It is suggested that the teacher uses the printed rubric as a guide and to make additional notes during the assessment.
BE PREPARED
Teacher Preparation for the Investigation includes the following. This preparation should be done prior to students arriving in the lab.
- Locate five places around the room to set-up the five weather stations and place a sign at each station with the station’s number.
- Identify Station 1 as Bermuda on the sign by writing “Bermuda” underneath the station number.
- Identify Station 4 as Colorado by writing “Colorado” underneath the station number.
- Identify Station 5 as Ohio by writing “Ohio” underneath the station number.
- Identify Station 2 as “Missouri” and Station 3 as “Oregon.”
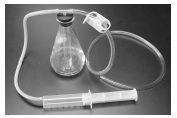
- Construct two model barometers for Stations 4 and 5. One model barometer will be placed at Station 4. One model barometer will be placed at Station 5. Students will take three readings for each model barometer during the Performance Assessment. The instructions below are for a single model barometer.
- Use a graduated cylinder to pour 100 ml of water into a 500 ml flask. Add one drop of green food coloring to the water.
- Obtain a test tube and turn it upside down. Using a metric ruler, make marks at 0.5, 1, 2, 3, 4, 5, 6, 7, and 8 cm from the open end of the tube.
- Place the test tube into the flask with the open end down. Some water will move into the test tube.
- Insert the T connector into the stopper hole.
- Put the 60 ml syringe into one end of the tubing and use a rubber band to secure the syringe onto the tubing.
- Remove the syringe plunger from the syringe.
- Obtain a second piece of tubing and place the tubing clamp onto it.
- Completely close the tube so that air is unable to move through the tubing.
- Place stopper with the T connector into the top of the flask. Gently push down on the rubber stopper to make sure that the stopper is sealed into the opening.
- Attach the two pieces of tubing to the T connector in the stopper.
- Re-insert the plunger into the syringe so that it passes the “stop line.” This is just above the 60 ml mark. As this occurs, there should be some resistance in the syringe.
- Check the model using the picture below. Observe the level of water in the test tube. It should be just above or equal to the water level in the flask. If the water level is too high or too low, disconnect and then reconnect the tubing on the syringe and the tubing that runs from the syringe to the T connector.
- Move the plunger to set the “barometer” to the first measurement students will take at each station. Move the plunger to the 30 ml mark.
- Create the surfaces at Stations 1, 2, and 3. Allow student access to the “stations” only once the beaker has been removed from the hot plate and placed on the table for Station 1. Stations 2 and 3 are cool air masses and will therefore be ready when Station is ready.
- For Station 1 (Warm air mass) (Bermuda)
- Add 150 ml water to a 400 ml beaker. Place the beaker on a hot plate/stirrer.
- Place a thermometer in the water.
- Turn on the hot plate/stirrer to a setting of 10 (500 ºC). Heat the water until it is approximately 76 ºC.
- Turn off the hot plate/stirrer.
- Use the hot hands protectors to remove the beaker from the hot plate. Place the beaker on the lab table or other heat resistant surface.
- Attach a thermometer to the support rod of the ring stand using a binder clip.
- Place a piece of plastic wrap on top of the beaker. Cut a small hole in the middle of the plastic wrap so the thermometer can be lowered into the beaker.
- Lower the thermometer so that it is 2 cm from the surface of the water.
- For Station 2 (Cool air mass).
- Add 150 ml sand to a 400 ml beaker.
- Place the beaker on the lab table or other heat resistant surface.
- Attach a thermometer to the support rod of the ring stand using a binder clip.
- Place a piece of plastic wrap on top of the beaker. Cut a small hole in the middle of the plastic wrap so the thermometer can be lowered into the beaker.
- Lower the thermometer so that it is 2 cm from the surface of the sand.
- For Station 3 (Cool air mass)
- Add 150 ml gravel to a 400 ml beaker.
- Attach a thermometer to the support rod of the ring stand using a binder clip.
- Place a piece of plastic wrap on top of the beaker. Cut a small hole in the middle of the plastic wrap so the thermometer can be lowered into the beaker.
- Lower the thermometer so that it is 2 cm from the surface of the gravel.
- Prepare the amount of precipitation at Stations 4 and 5.
- For Station 5 fill a 100 ml beaker with 50 ml of water. Label “Station 5- Total Precipitation over 12 hours.”
- Prepare an empty 100 ml beaker for Station 4. Label “Station 4- Total Precipitation over 12 hours.”
- Do not place the beakers at Stations 4 and 5 until later in the Performance Assessment.
- Divide students into cooperative groups of three students.
Note: There is no Student Preparation for this Performance Assessment.
INVESTIGATE
- Ask students to read the Background for the Performance Assessment, and discuss if necessary.
- Ask students to read the Goals of the Performance Assessment, and discuss if necessary.
- Explain to students that the Performance Assessment requires only those procedures and skills that they have used in the previous Investigations.
Note: Students will take measurements of temperature and barometric pressure and use knowledge of the temperature and density of air, air masses, atmospheric and barometric pressure and fronts to determine which of two weather maps accurately indicated the weather phenomena occurring over the United States.
- Assign each of the students groups a starting Weather Station. More than one group may begin at a station.
- Explain that each group will have approximately two to three minutes at each station to obtain their measurement.
Note: After they have completed recording their measurements, they should move to the next highest number weather station. For students starting at Station 5, they should move to Station 1.
- For Stations 4 and 5, remind students that they are recording the 8 AM weather measurements.
- After all students have completed one rotation, tell them to return to their seat to discuss their findings.
Note: During this time, make the following adjustments to the barometers at Stations 4 and 5. These adjustments will be the 2 PM weather measurements.
- Station 5- adjust the barometer to indicate a lower pressure. Move the plunger in the syringe to the 60 ml mark.
- Station 4- simulate the maintenance of pressure. Do not make any adjustments to the model barometer. The plunger should remain at the 30 ml mark.
- Provide time for students to rotate through Stations 4 and 5 to take their 2 PM measurements.
- Once students have completed their measurements, direct them to return to their seats to think about the Weather Maps A and B.
Note: During this time make the following adjustments to the barometers at Stations 4 and 5.
- Add the precipitation beakers for Stations 4 and 5 at this time also. These adjustments will be used for the 8 Pm weather measurements.
- Station 5- adjust the barometer to indicate a higher pressure. Move the plunger in the syringe to the 0 ml mark.
- Station 4- simulate the maintenance of pressure. Do not make any adjustments to the model barometer. The plunger should remain at the 30 ml mark.
- Provide time for students to rotate through Stations 4 and 5 to take their 8 PM pressure and precipitation measurements.
- After collection of the “8 PM data” at Stations 4 and 5, encourage students to study Weather Maps A and B and to complete the remainder of their goals.
CLEAN UP
Let students know your expectations for cleanup. Ask them to clean up.
ANALYZE IT
Discuss the results of the Performance Assessment as a class, including:
- all possible solutions to the posed problem,
- whether each student group met the goals of the Performance Assessment, and
- any procedural difficulties student groups had in meeting the goals.