Procedural Toolbox
Creation and Completion of a Bar Graph
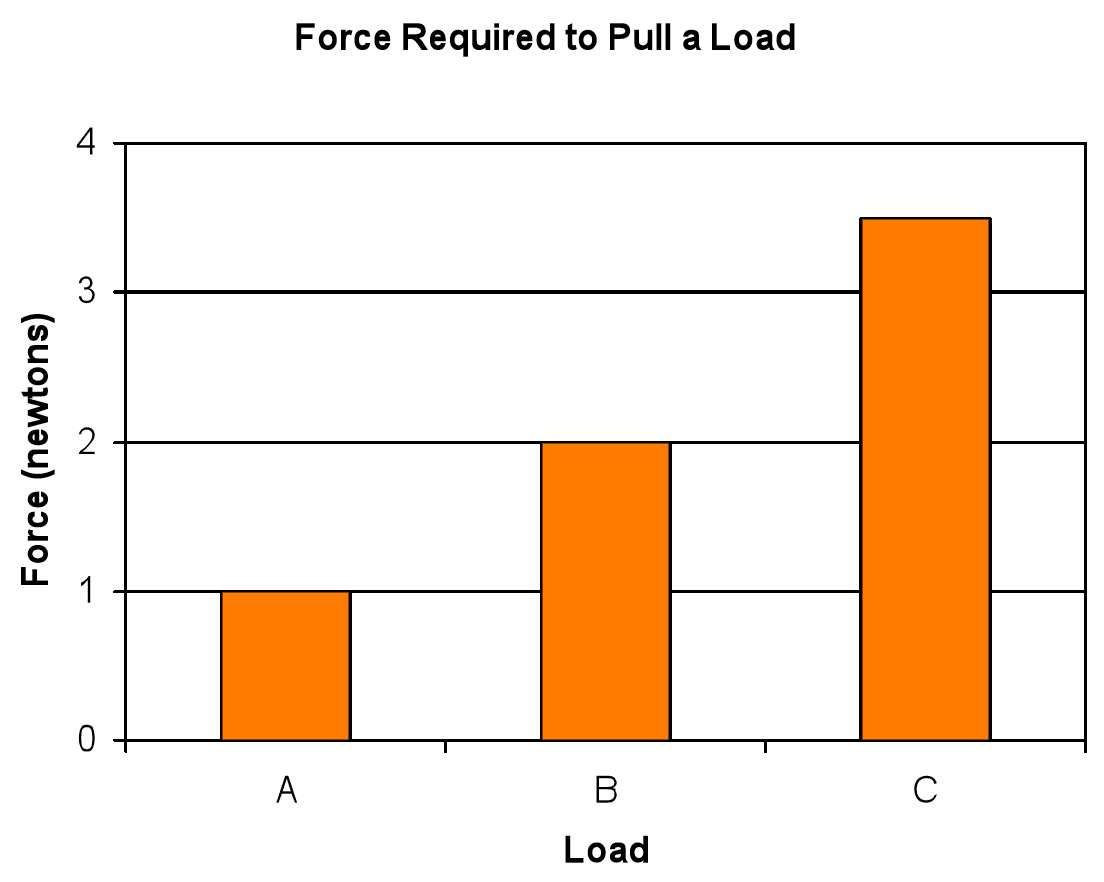
Mr. French’s class of students measured the amount of force required to pull three different loads across the table. The students recorded the amount of force required to pull each load.

1. To create a bar graph, draw an x-axis and a y-axis.
2. Evaluate your data. Determine which variable you will plot along the x-axis and which variable you will plot along the y-axis.
3. In experiments there is a variable changed by the person doing the experiment and a variable that is measured by the person doing the experiment. Typically scientists choose these two types of variables to the graph. In the sample experiment, one variable is the type of load. The other variable is the force required to pull the load.
4. Typically, scientists place the variable they control on the x-axis. In the sample experiment, students varied the load that they pulled, therefore this is the variable they controlled.
5. Typically, scientists place the variable they measure on the y-axis. In the sample experiment, students measured the force required to pull the load, therefore the force is the variable they measured.
6. Label your axis accordingly. In the sample experiment, Mr. French’s class placed the load on the x-axis and force on the y-axis.
7. Label the x-axis. Mr. French’s class had three loads: A, B, and C. These labels were placed on the x-axis.
8. Determine the beginning and ending numbers you will plot on the y-axis. The beginning and ending numbers should be selected so that you can plot all of your points on the graph. In the sample graph, the scale along the y-axis is from 0 to 4 newtons.
9. Determine the scale for the y-axis. A scale is the difference between numbers. For example, you may wish to include all numbers between your beginning and ending numbers. In the sample graph, all numbers between 1 and 4 are written on the y-axis. You could also create a scale that only uses some numbers that are multiples of each other. The y-axis could be placed at increments of 2 and include labels for 0, 2, and 4.
10. Create a bar for each label on the x-axis.
11. Mr. French’s class created the following graph.