Teacher Portal:
Friction
Investigation 2 – PostLab

ZERO-IN
Italicized font represents information to be shared orally or physically completed with the students at this time.
The non-italicized font represents additional information included to support the teacher’s understanding of the content being introduced within the CELL.
ANALYZE IT
Instruct students to complete the Analysis Questions in their SDRs then discuss them as a class. Use the suggested responses below to guide students’ answers.
Note: Students should refer to their data recorded in Table A to answer the following questions.
- Of all of the data recorded during the experiment, only two measurements varied greatly from trial to trial. Which two measurements varied? Time and velocity varied greatly. Students may notice a small change in force, but such changes should be so minute that they are inconsequential.
- What is the relationship between velocity and frictional force? Student answers will vary. Students may be able to look at the data on the chart and draw the conclusion that frictional force does not vary based on velocity. The following graphing activity will help students see this relationship.
Tell students that one way of observing relationships between variables is to graph the data. Students should use the following steps to graph the relationship between frictional force and velocity.
- Students should draw an x- and y-axis to set up their graph in their Investigation 2 Student Data Record.
- Students should determine how to label the x- and y-axis. Refer to the Determining How to Label the X-Axis and Y-Axis card in the Procedural Toolbox if necessary. Velocity, the independent variable, should be placed on the x-axis, and frictional force, the dependent variable, should be placed on the y-axis.
- Students should look at their values recorded in the table. Students should determine the range of numbers that should be included on each axis based on the range of their data. For example, if their values for velocity vary from 120 m/s to 240 m/s, students may wish to provide a range from 100 m/s to 250 m/s on their graph.
- After students have placed the appropriate numbers along each axis, students should plot their data.
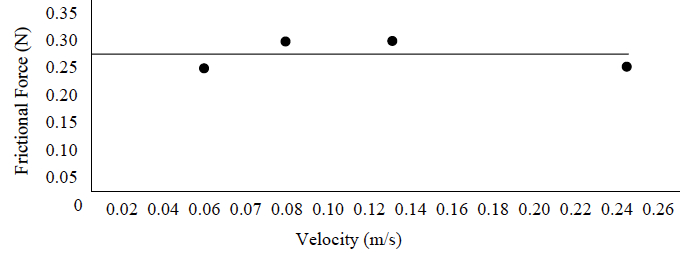
- Once students have plotted the data, they should draw the best fit line through the points on their graph. The best fit line may not exactly connect each point. Rather, the best fit line is a straight line that goes through the midpoint between all of the points.
Ask the following questions concerning the graph. Use the suggested responses below to guide students’ answers.
- Does the frictional force increase or decrease based on velocity? No, the frictional force remained constant regardless of velocity.
- What is the relationship between the frictional force and velocity? Frictional force is not dependent on velocity. Instruct students to record their answers in their Investigation 2 Student Data Record.
- According to your graph, what would be the applied force if the velocity was 0.05 m/s? According to the graph, the frictional force would be approximately 0.275 N. We know that the frictional force is independent to velocity and equal in magnitude to the applied force when an object is pulled at a constant velocity; therefore, the applied force would be approximately 0.275 N for the velocity of 0.05 m/s just as it was for al other velocities tested in the experiment. Instruct students to answer the question in their Investigation 2 Student Data Record.
GET FOCUSED
Instruct students to complete the Focus Question in their SDRs then discuss it as a class. Use the suggested response below to guide students’ answers.
- How does the velocity of an object affect the frictional force between it and the surface with which it comes in contact? Frictional force is independent of velocity. This was show on the graph where frictional force remained constant regardless of the change in velocity.