Teacher Portal:
Inheritance and Adaptations
Investigation 5 – PostLab
 PRINT IT
Use your browser to download a printable PDF as help during the slide presentation and to make additional notes. In your browser, go to File > Print and then choose to save as PDF.
NAVIGATE IT
Once the slide presentation is launched
- use your left and right arrows to advance or go back in the slide presentation, and
- hover your mouse over the left edge of the presentation to get a view of the thumbnails for all the slides so that you can quickly move anywhere in the presentation.
- Click HERE to launch the slide presentation for the CELL.
SHARE IT
SLIDE INHERIT5-post-1
Begin this part of the Investigation by reviewing the experiments performed in the Lab. Ask the following questions to promote discussion of the experiments:
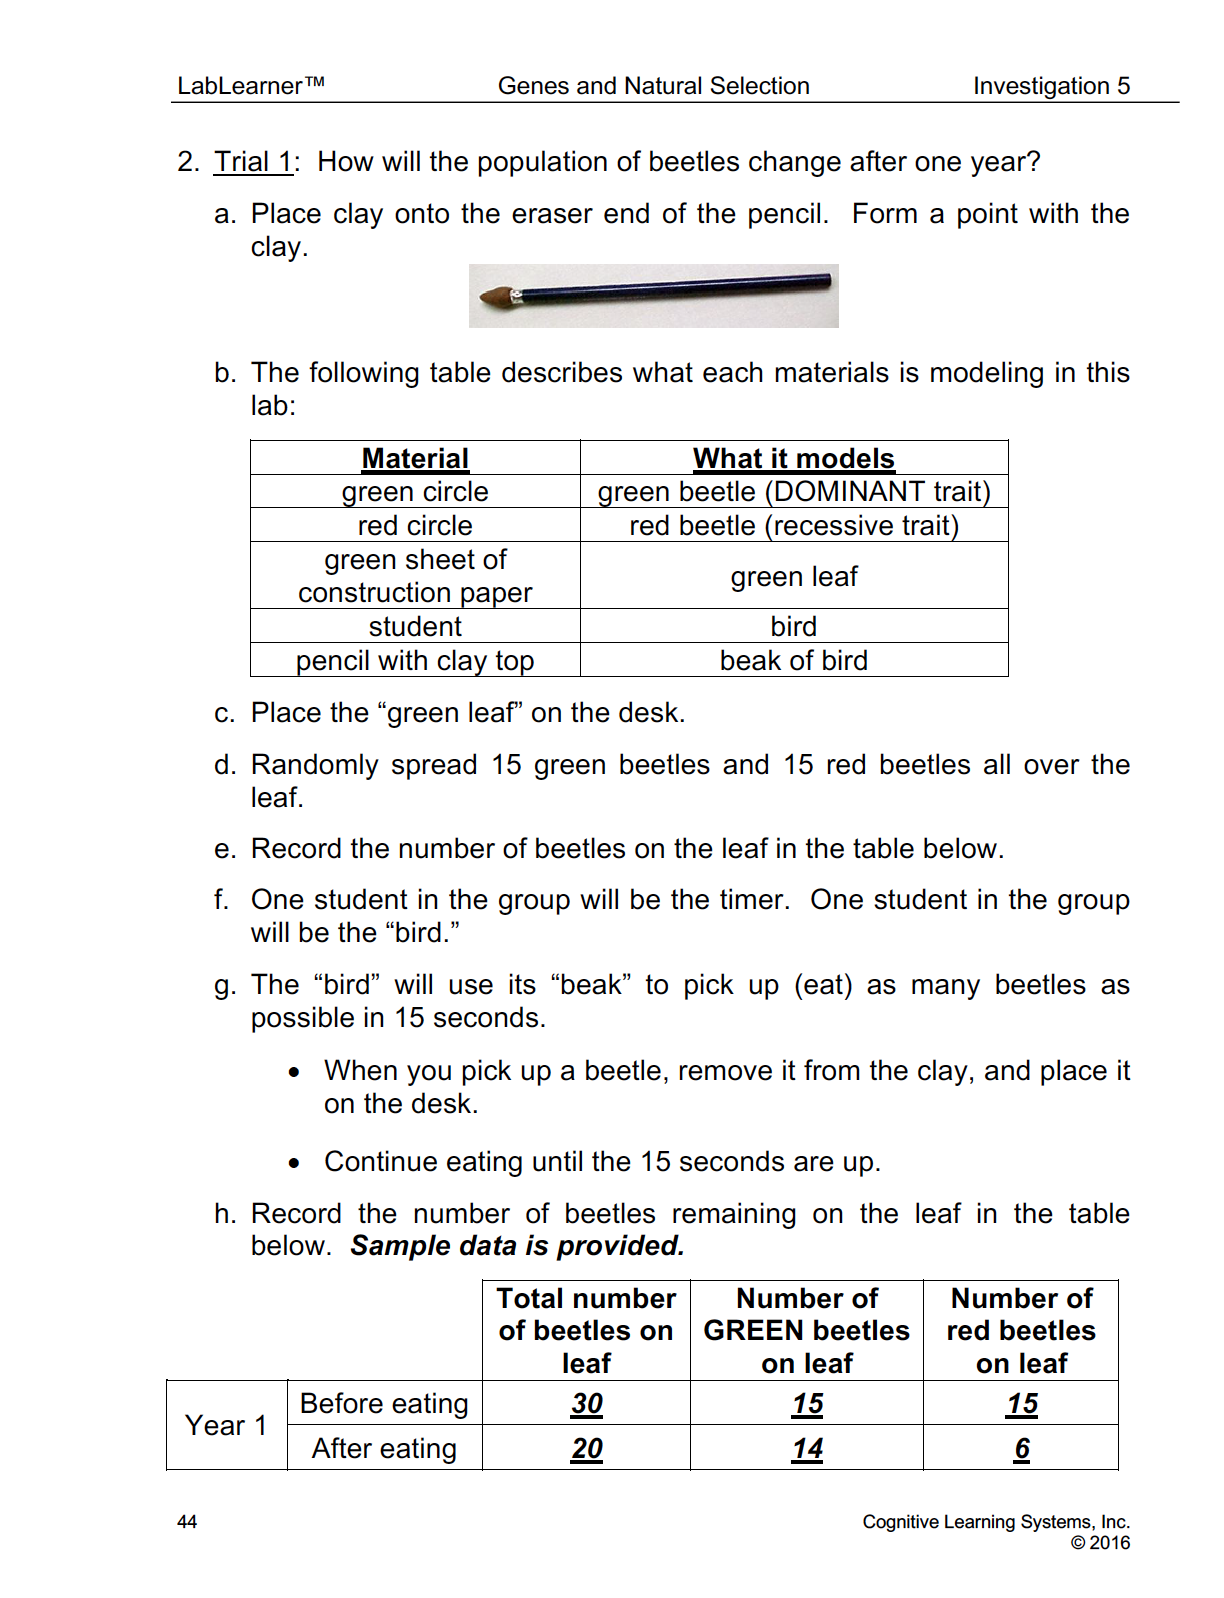
What were the main questions that were answered in this lab? The following questions were answered: How does a species with an advantageous trait change over time? How does a species with a disadvantageous trait change over time?
How did you demonstrate the process of natural selection in your experiment? Students should indicate that they placed the green and red “beetles” onto a piece of green construction paper. They then modeled a bird feeding by using a clay-covered pencil to pick up as many beetles as possible in 15 seconds. Students mated the remaining beetles and added their offspring to the construction paper. They repeated this process for two generations of beetles. Over time, the proportion of species of beetles changed.
______________________________________________
SLIDE INHERIT5-post-2
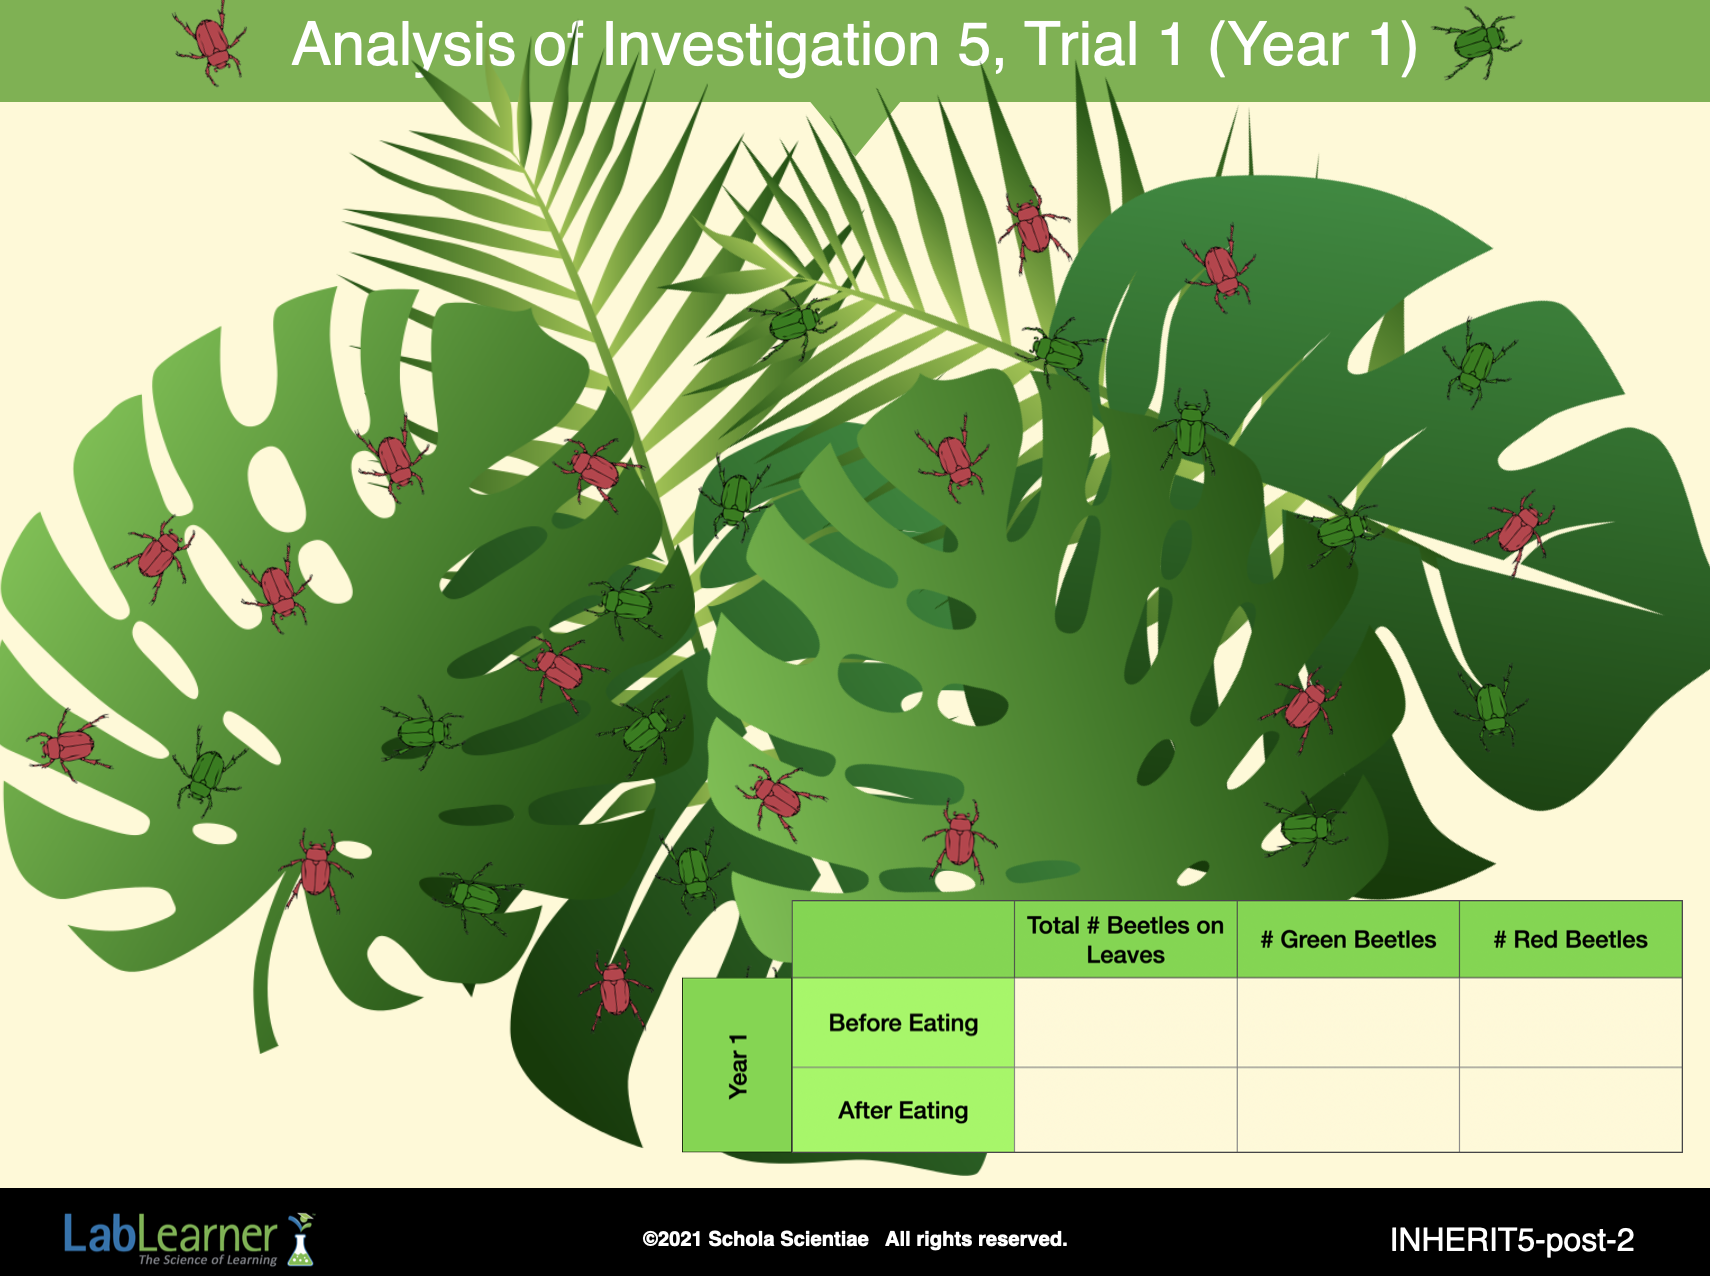
Trial 1: Analysis
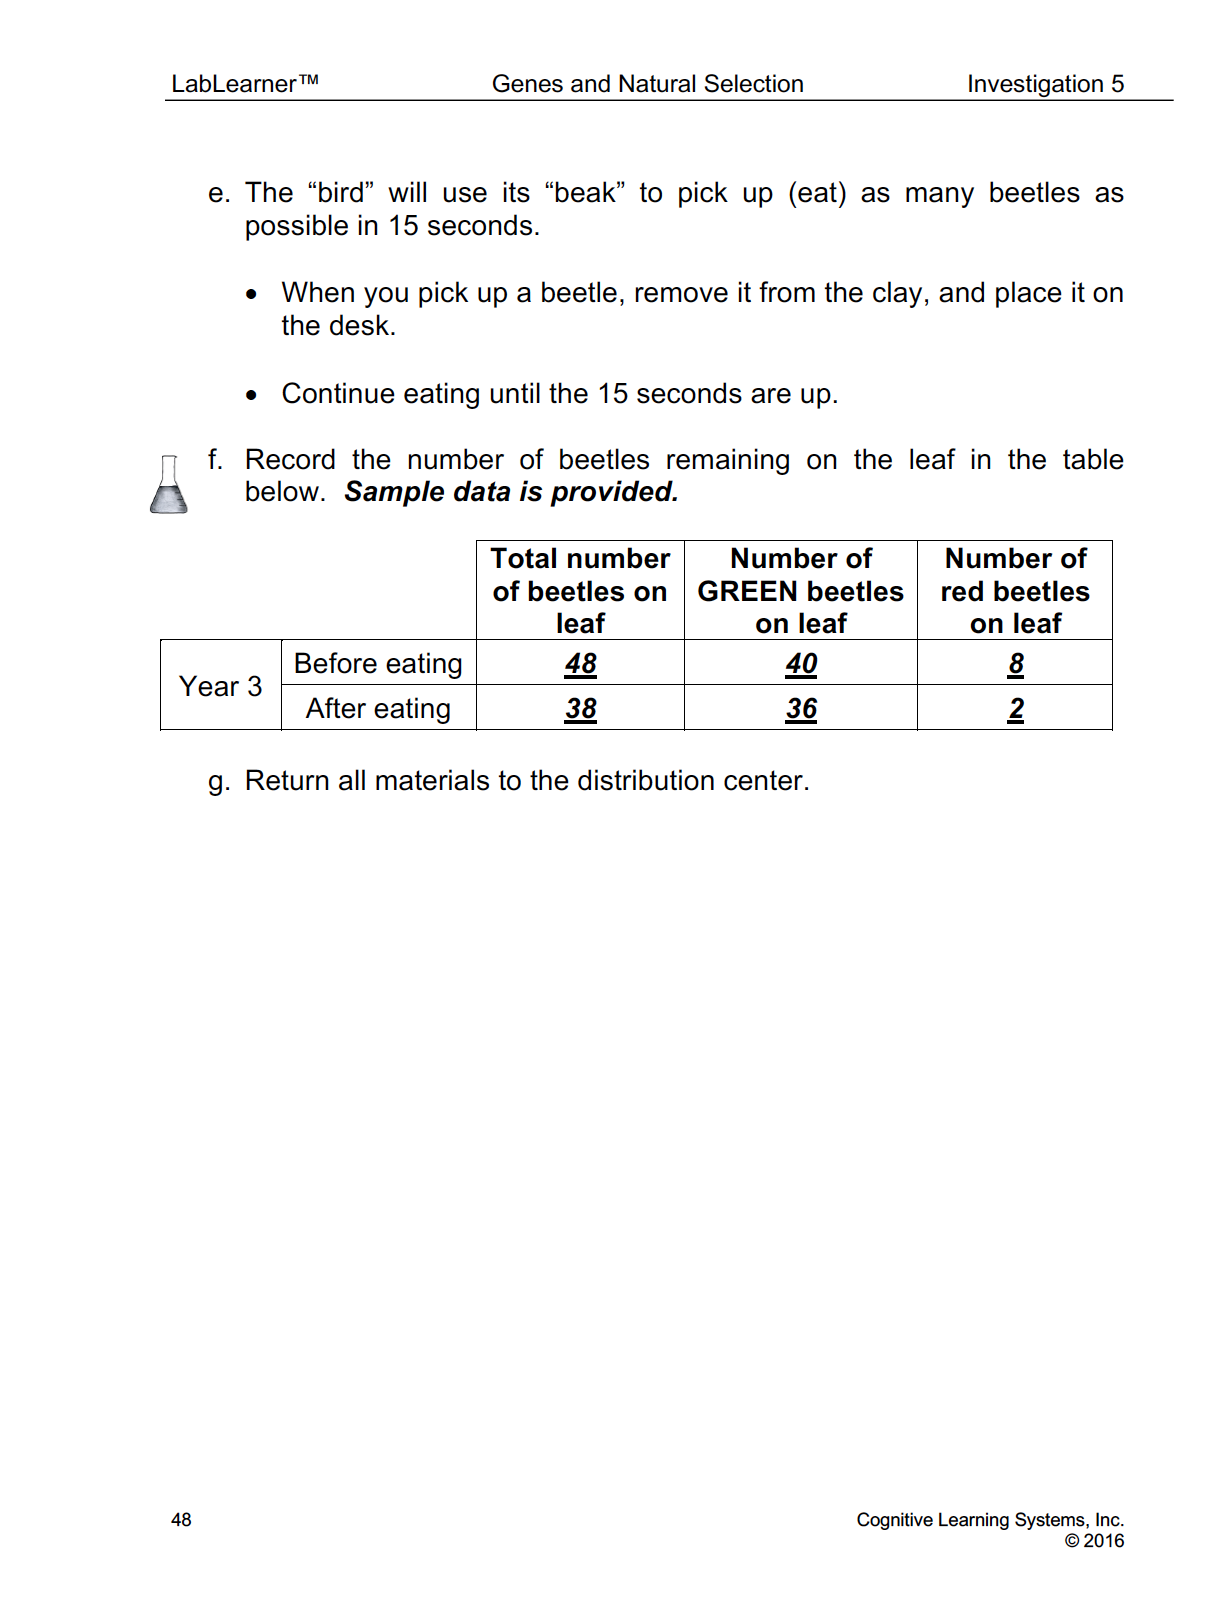
Divide students into their groups of three from the lab and direct students’ attention to the results of their experiment in Problems 2–4 of their Student Data Record.
Instruct students to compile their data by completing the Data Table in Problem 5a and answering Problem 5b of their Student Data Record. Provide sufficient time for students to organize their data.
Begin analysis of the data table by asking students the following questions:
- How were the two species of beetles different from one another? Students should indicate that the beetles were different from one another because of their color. Some beetles of the species were green and some were red.
b. How did the number of green beetles compare with the number of red beetles at the beginning of the experiment? At the end of the experiment? Students should indicate that at the beginning of the experiment, there was an equal number of red and green beetles. By the end of the experiment, there were more green beetles than red beetles.
c. How did habitat affect the survival rate of the green beetles? Red beetles? Students should indicate that the green habitat provided camouflage for the green beetles which enabled them to hide from the bird and survive. The red beetles were not camouflaged and were more quickly eaten by the birds. (Note: This is similar to the situation that resulted from the industrial revolution and pollution with the dark and light-colored moths in Manchester, England discussed in the PreLab presentation/discussion
d. Which species of beetle was able to produce the most offspring? Why? Students should indicate that the green beetle was able to produce the most offspring because it had the most survivors at the end of each year.
e. What was the advantageous trait in this experiment? How does a species with an advantageous trait change over time? Students should indicate that the green trait was the advantageous trait. Over time, the species expressing this advantageous trait will increase.
f. What was the disadvantageous trait in this experiment? How does a species with a disadvantageous trait change over time? Students should indicate that the red trait was the disadvantageous trait. Over time, the species expressing the disadvantageous trait will decrease.
______________________________________________
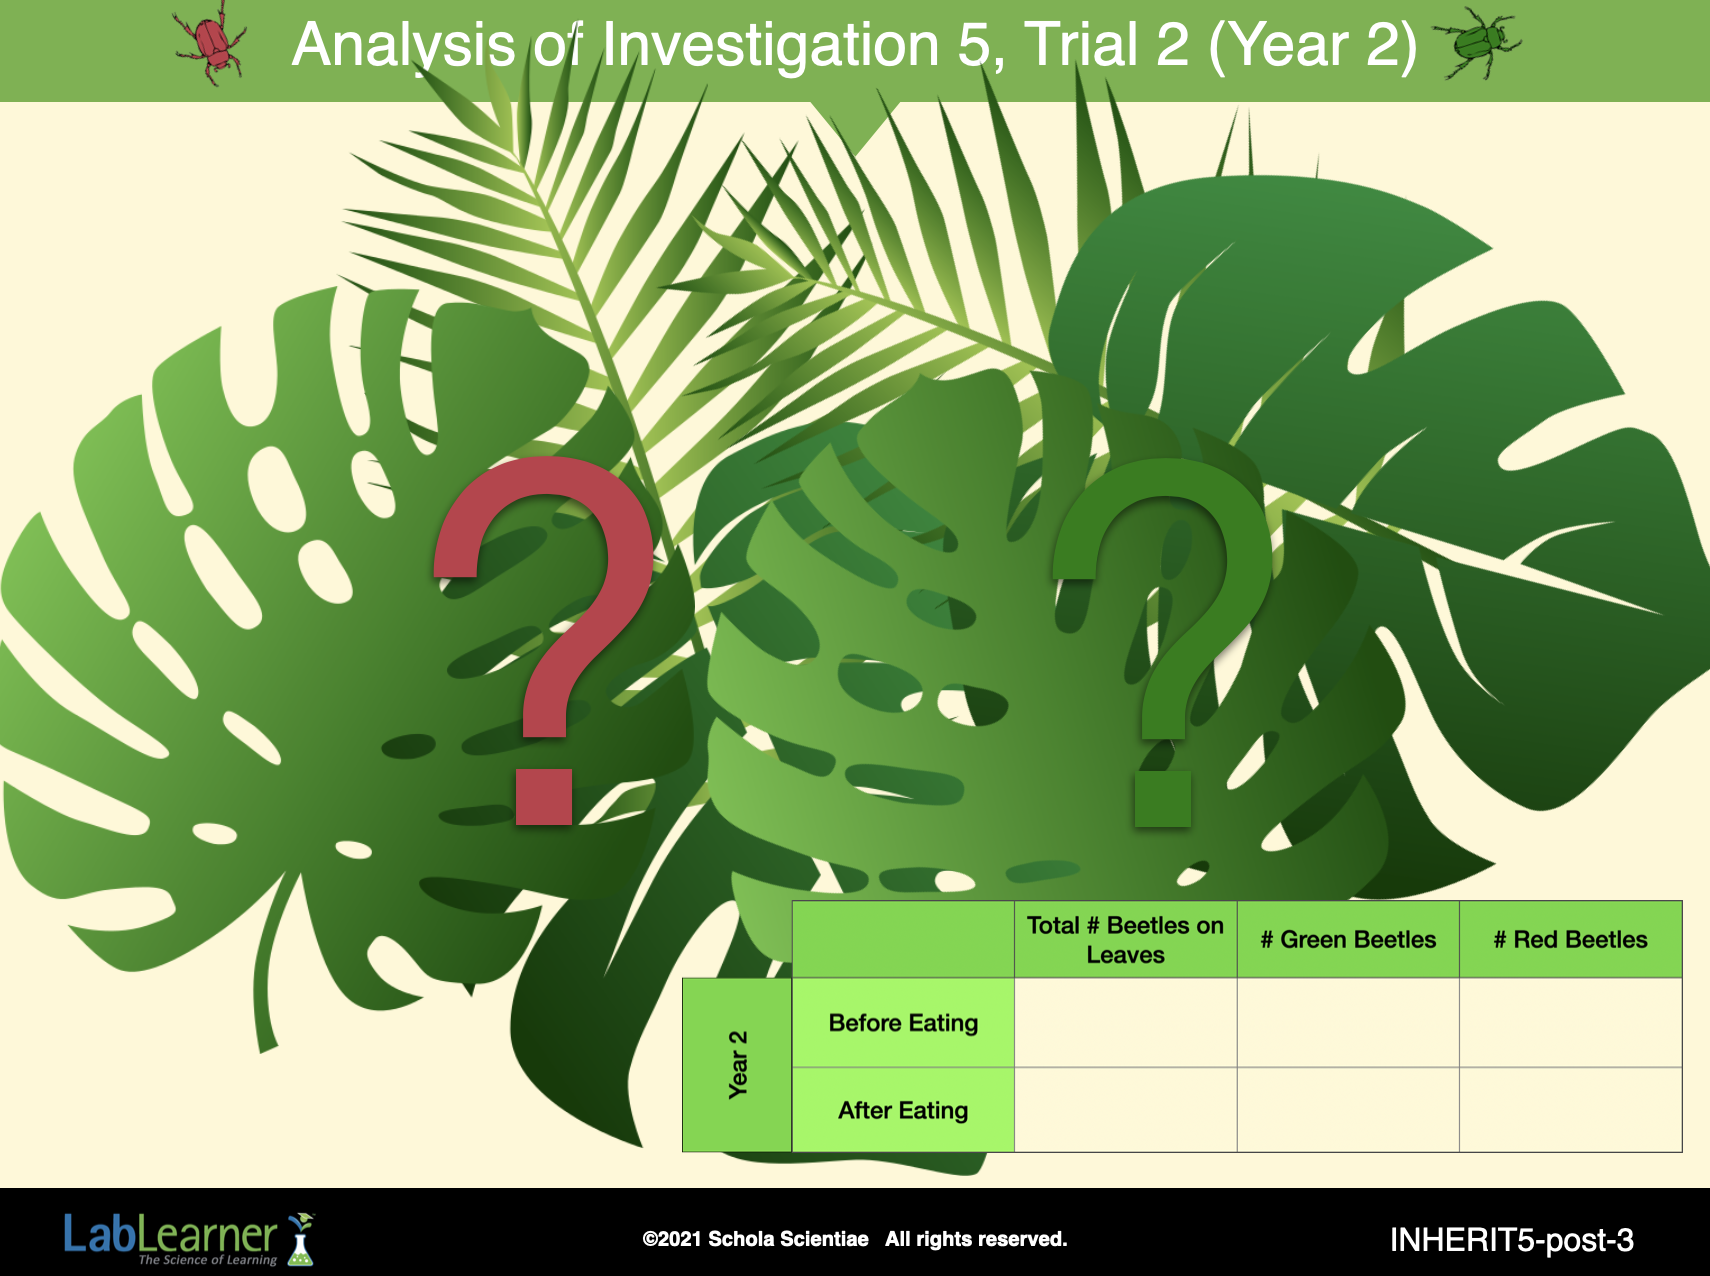
SLIDE INHERIT5-post-3
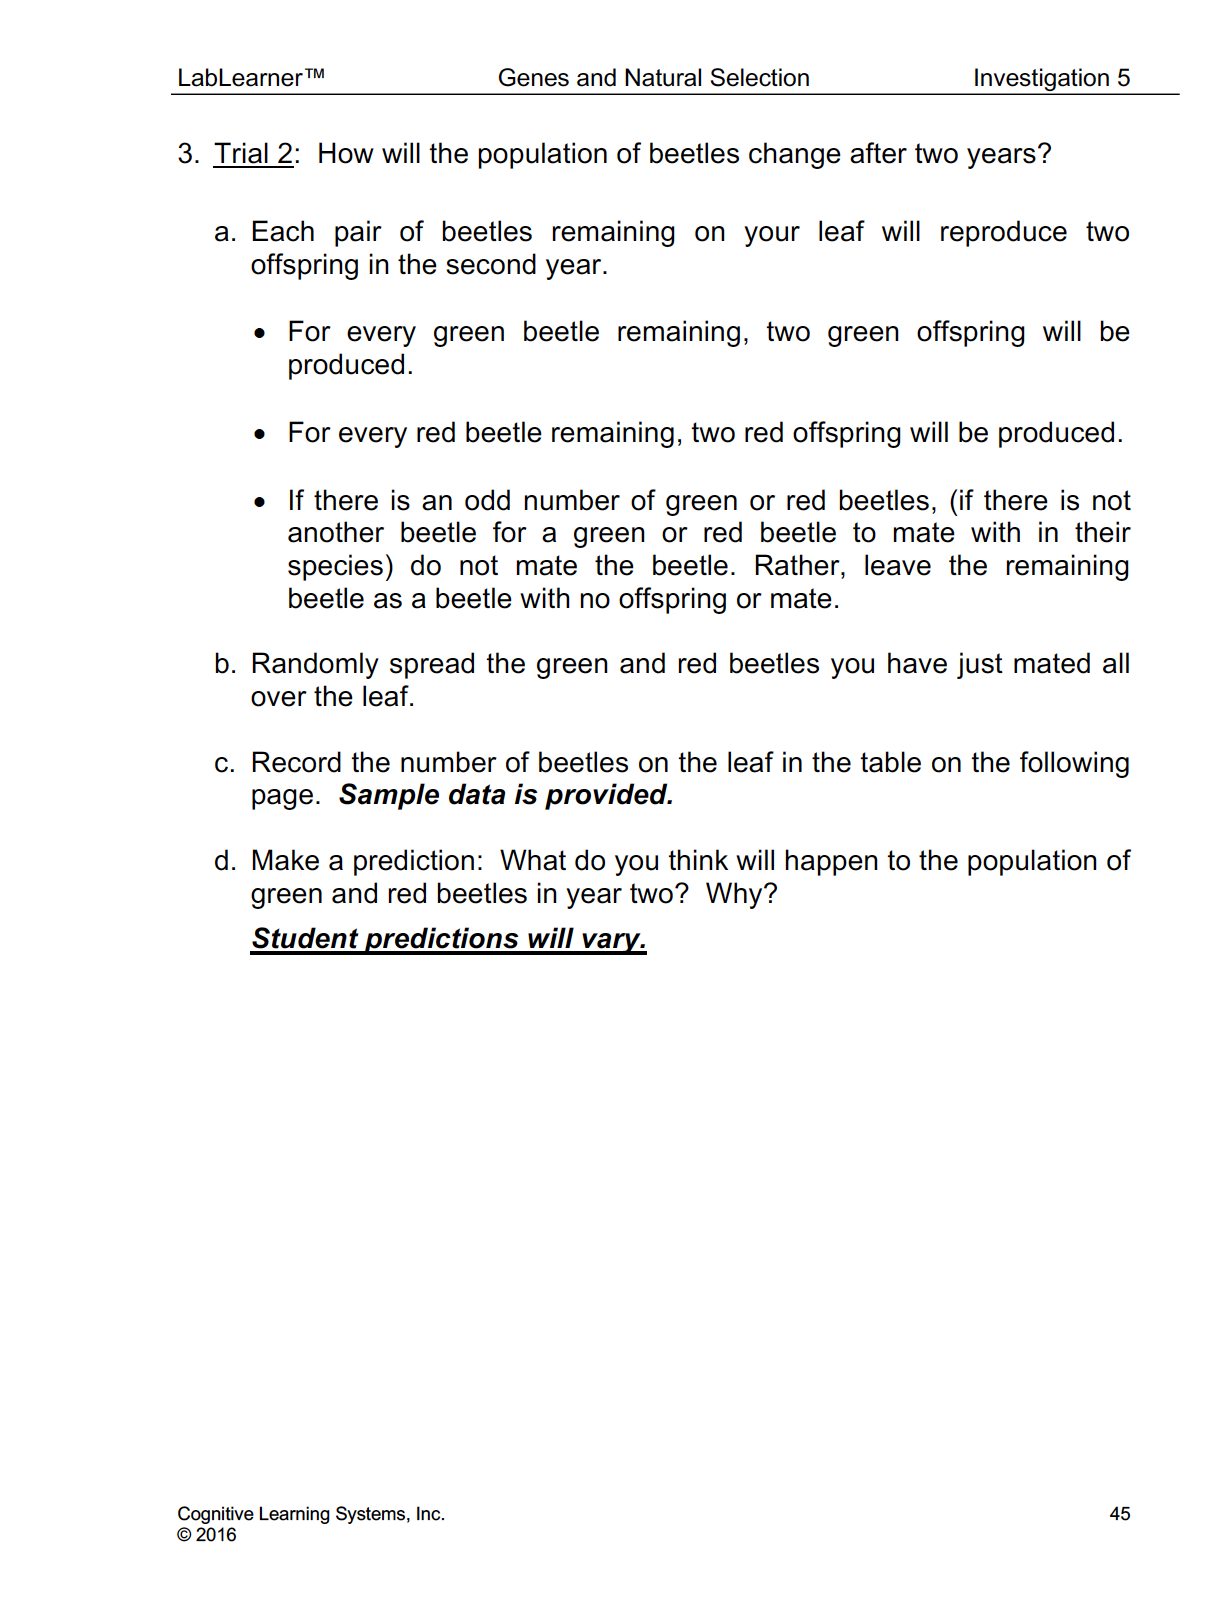
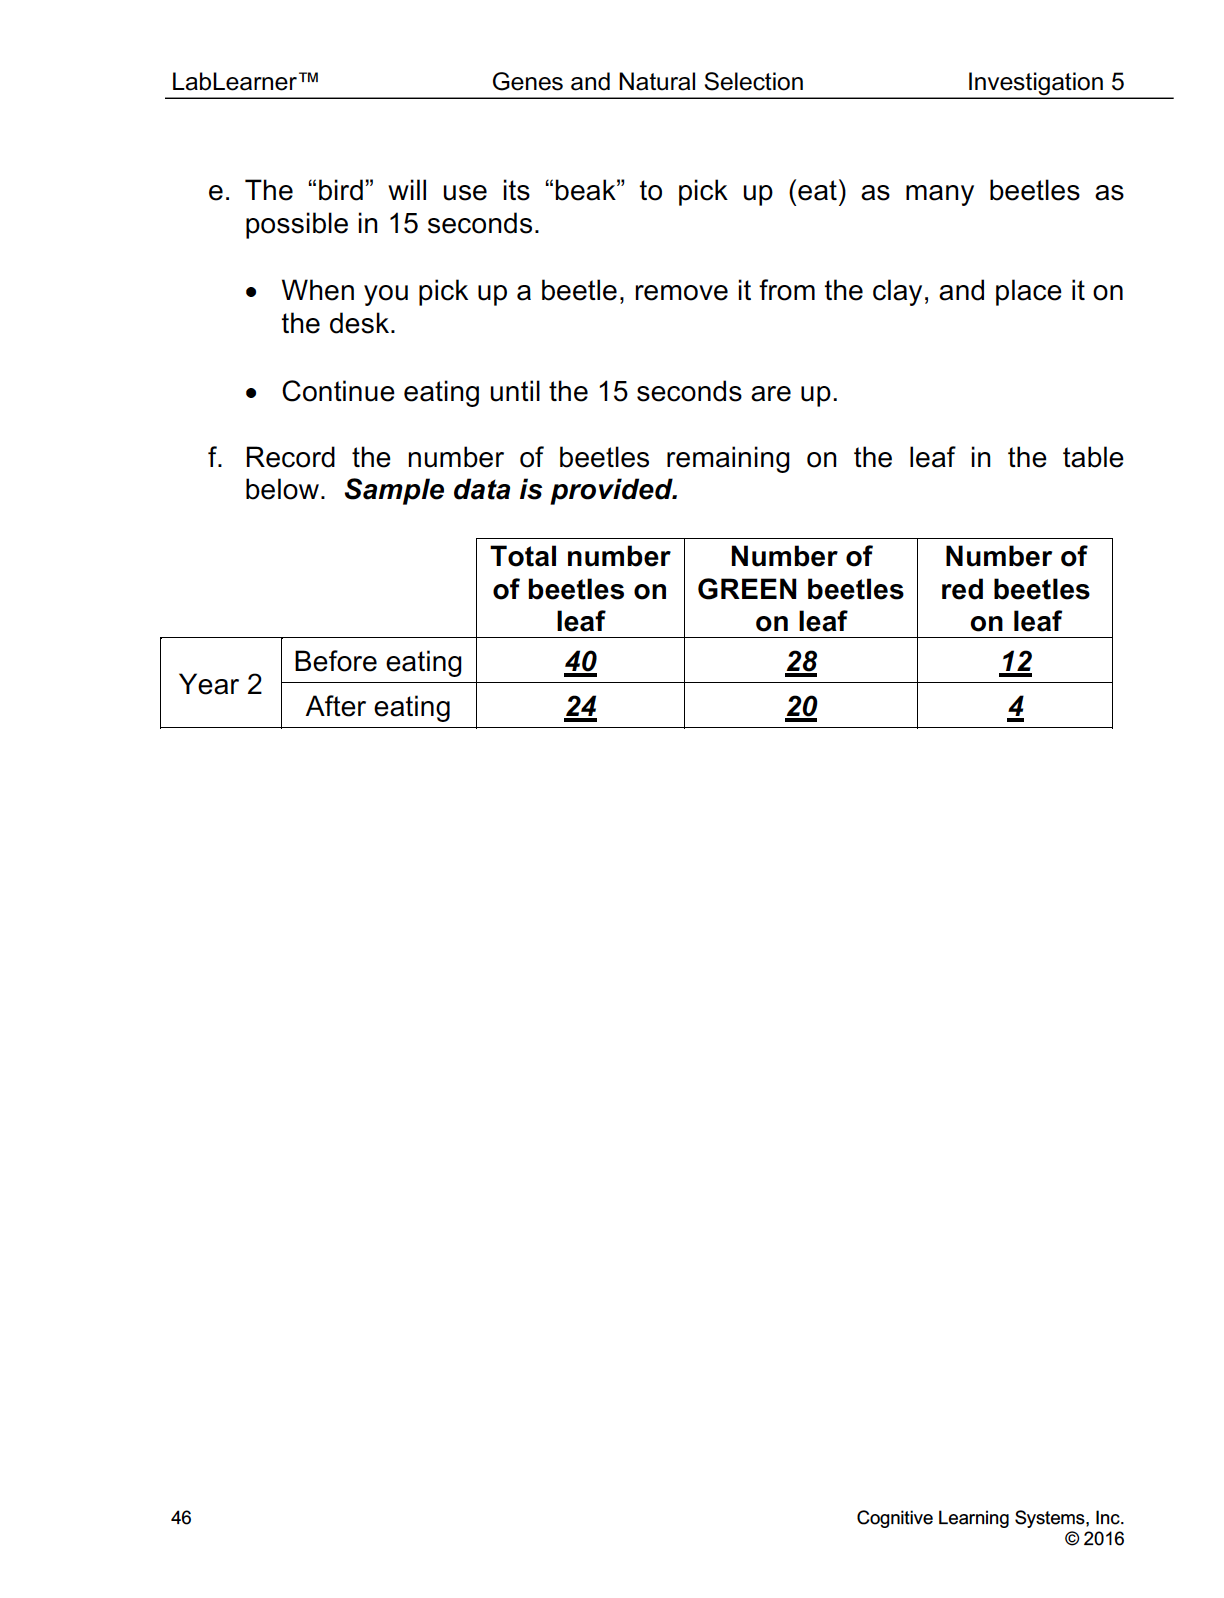
Trial 2: Analysis
Ask student groups to report their data from Trial 2 and discuss results as a class.
- Was there much variation between groups?
- What would the results of the class look like if the results reported by each group were averaged?
______________________________________________
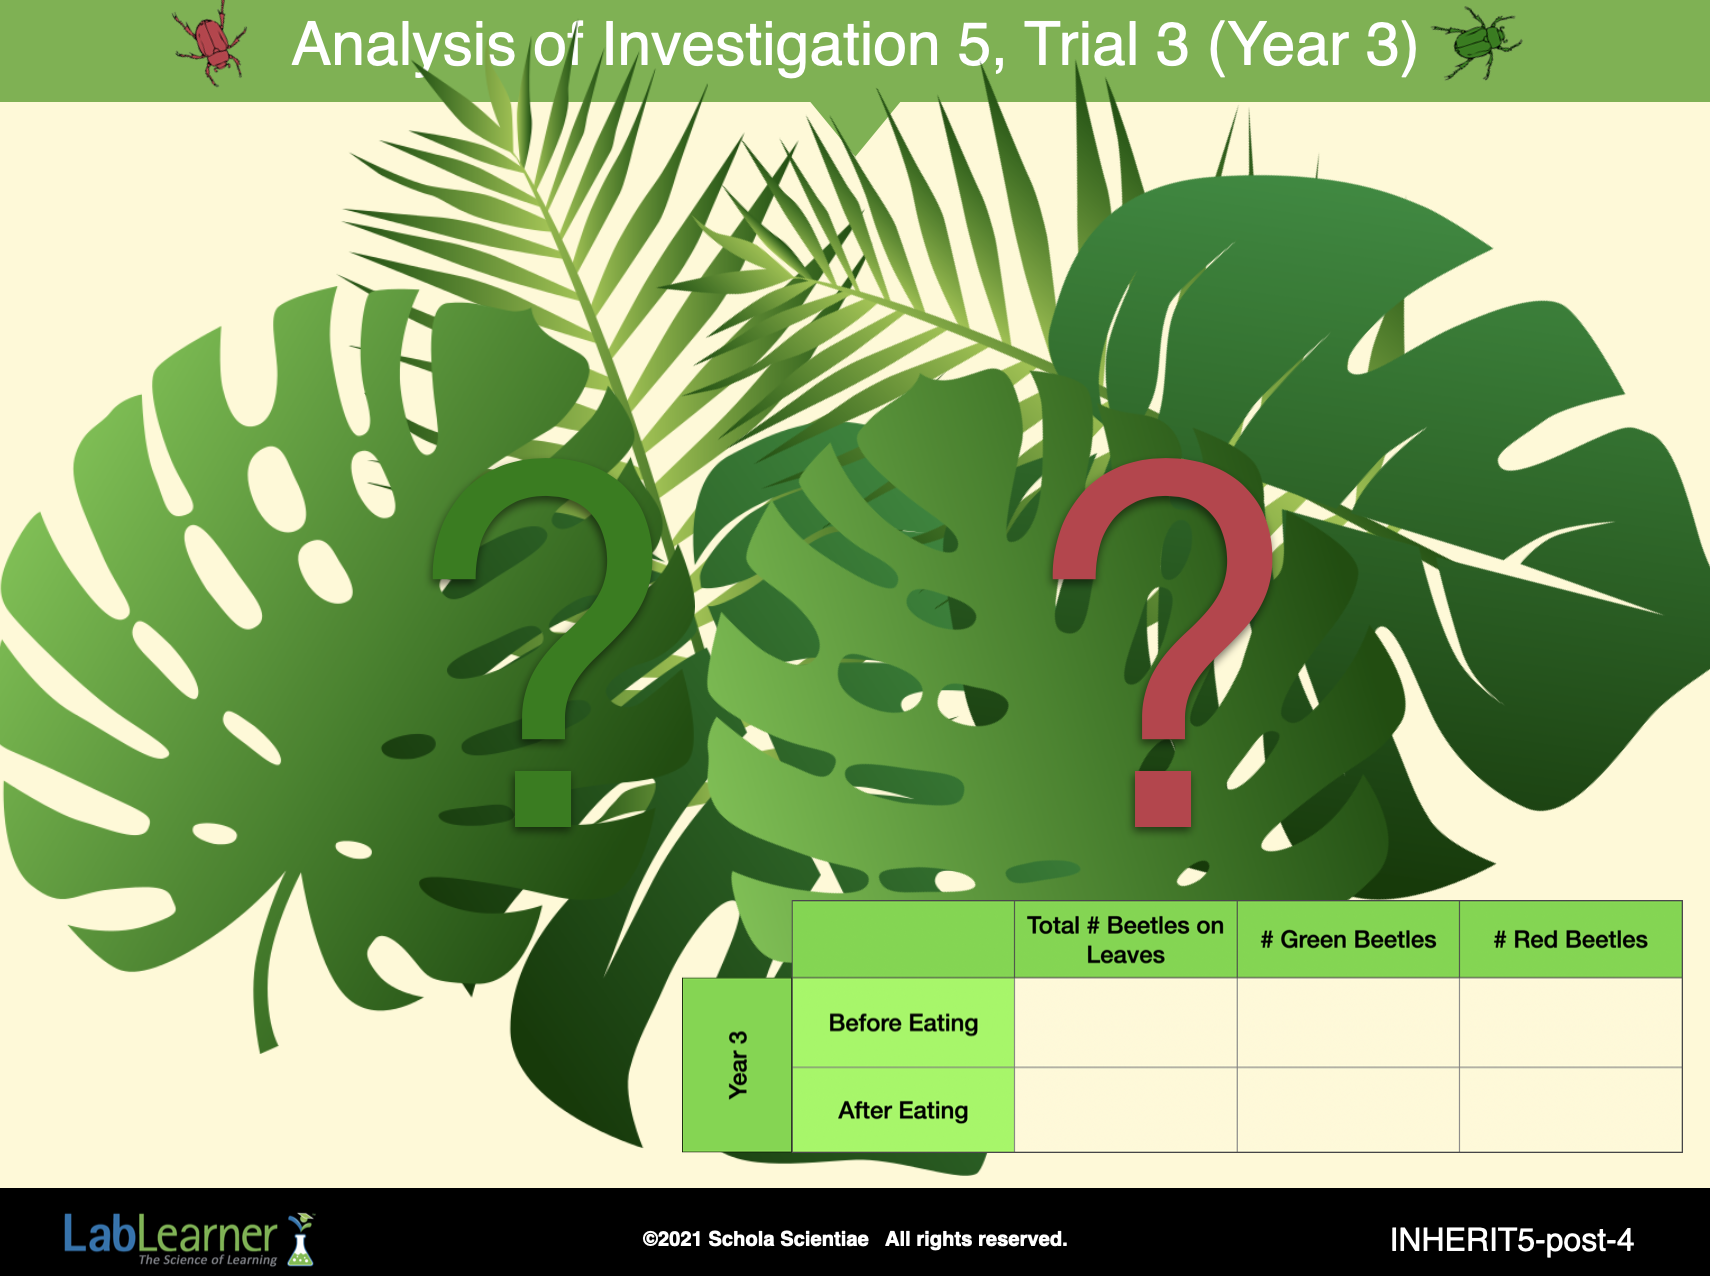
SLIDE INHERIT5-post-4
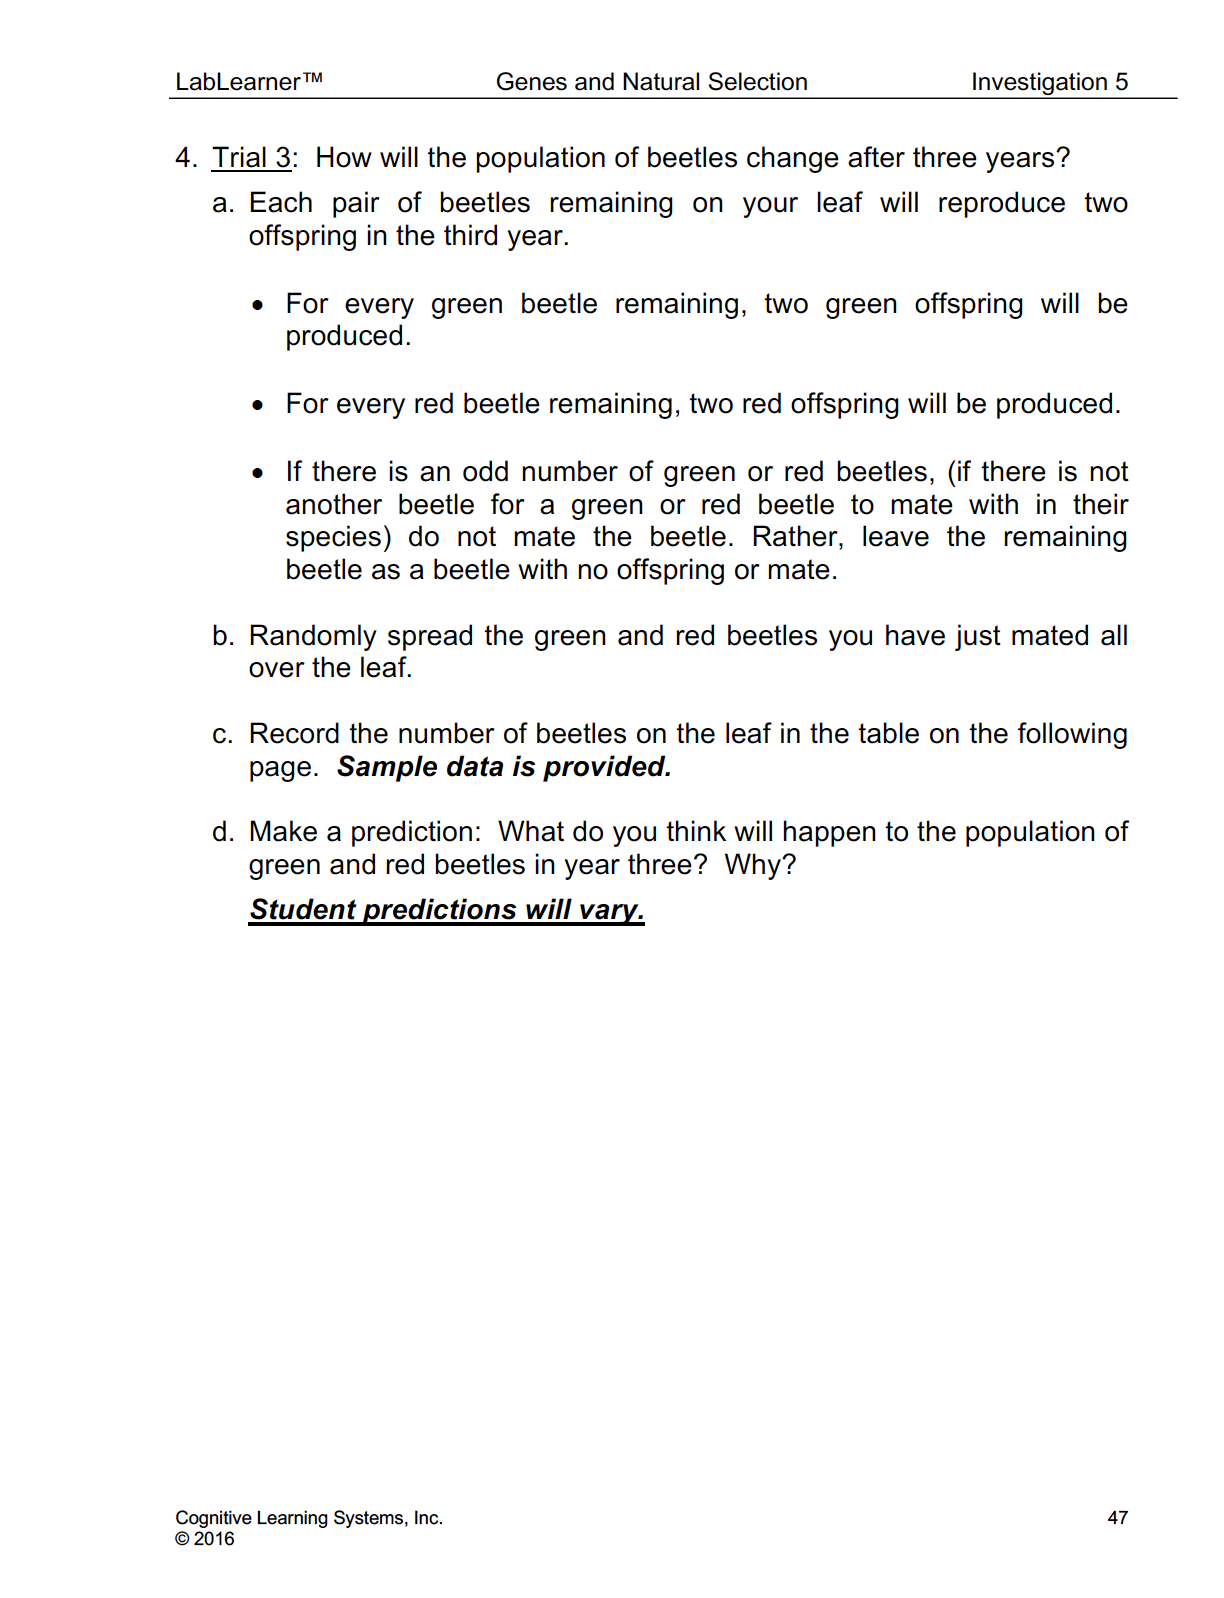
Trial 3: Analysis
Ask student groups to report their data from Trial 3 and discuss results as a class.
- Was there much variation between groups?
- What would the results of the class look like if the results reported by each group were averaged?
______________________________________________
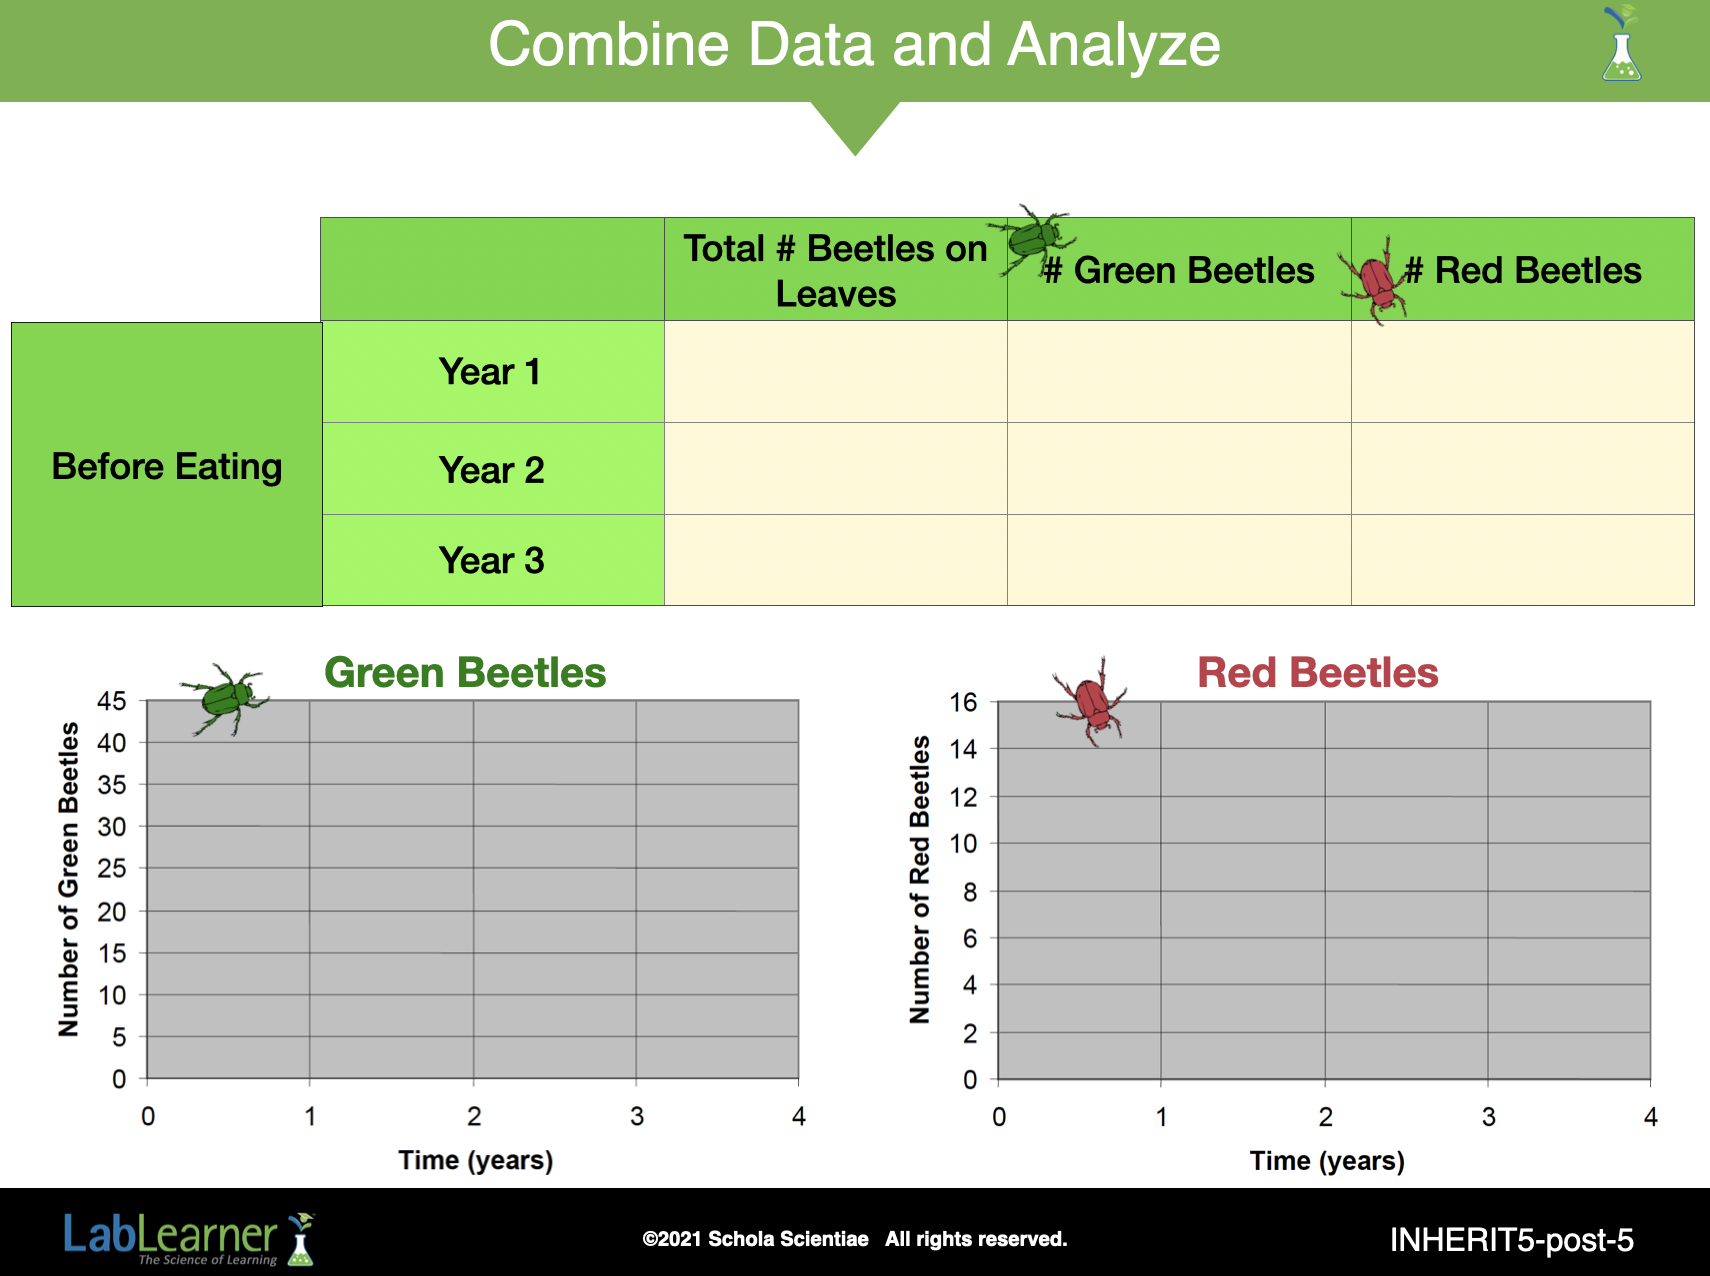
SLIDE INHERIT5-post-5
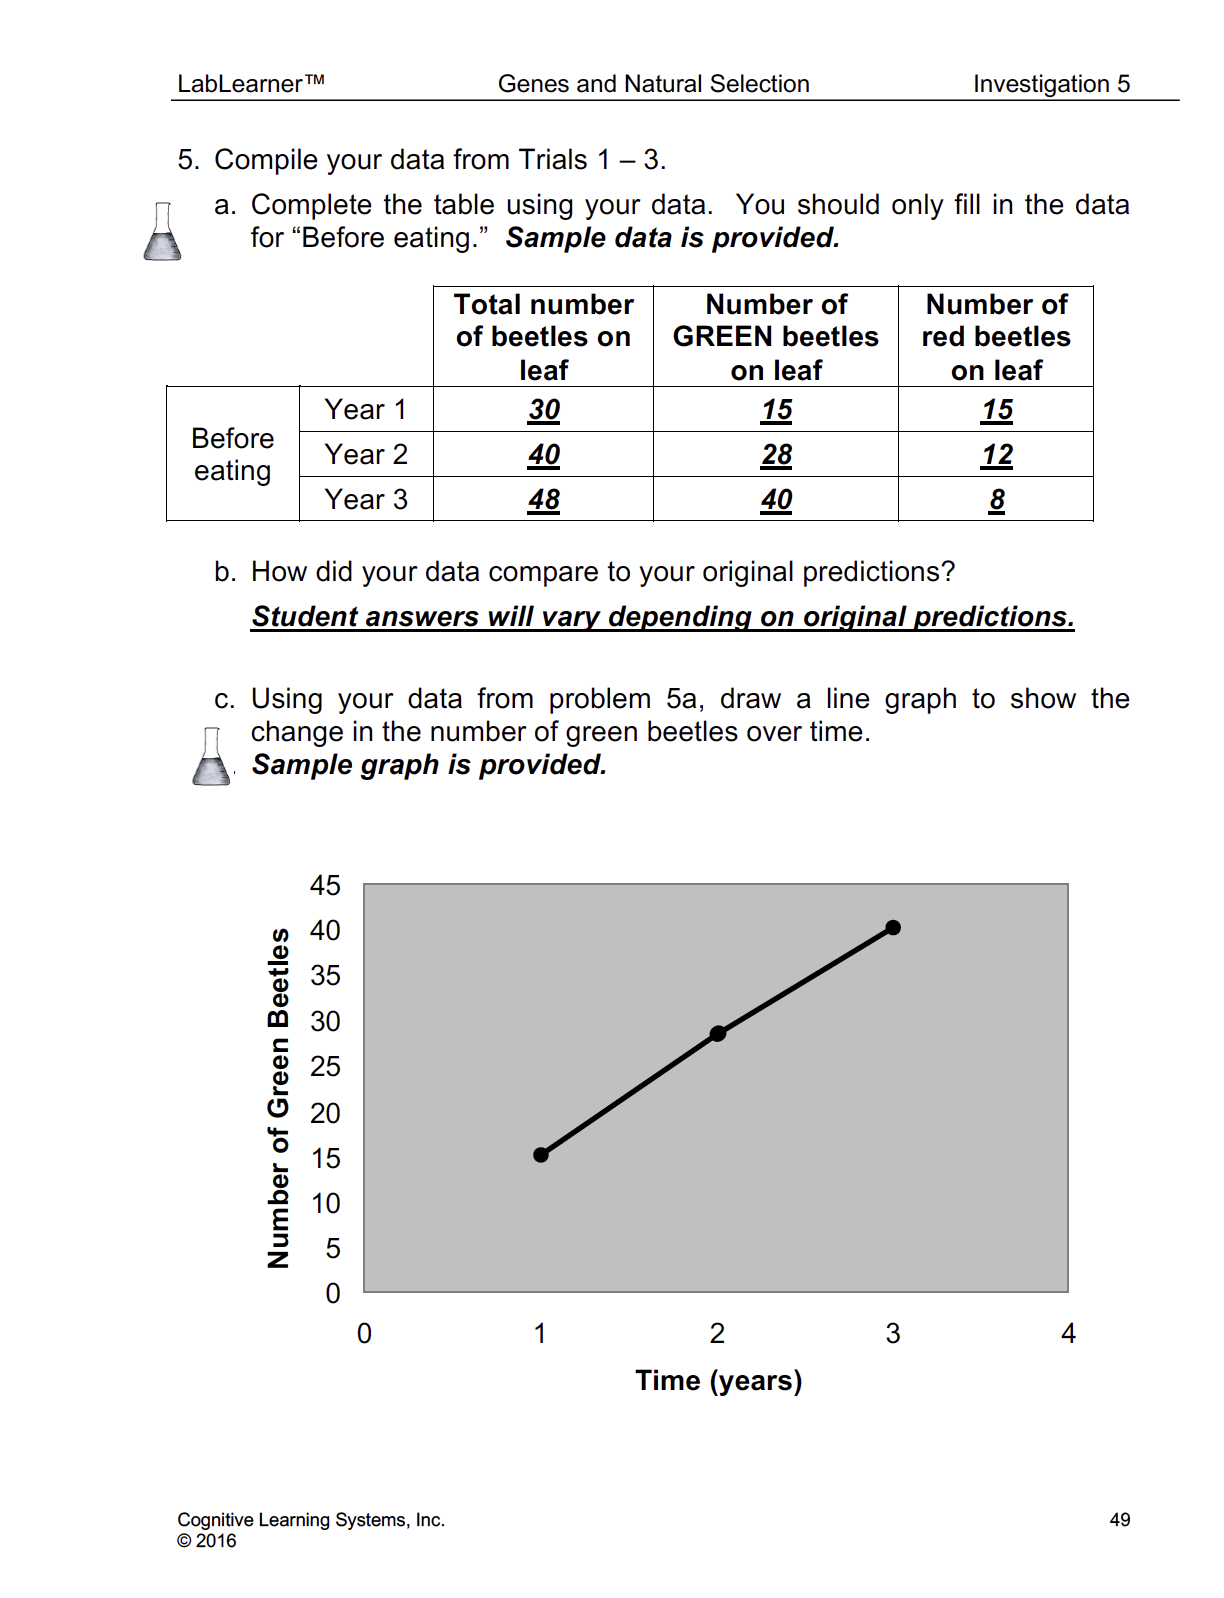
Ask students to compile their data from Trials 1 – 3.
Complete the Table in Problem 5a using your data. You should only fill in the data for “Before eating.”
b. How did your data compare to your original predictions?
c. Using your data from Problem 5a, draw a line graph to show the change in the number of green beetles over time.
Ask students: Can you describe your line graph? Students should indicate that this line graph slopes up to the right indicating an increasing number of green beetles over time.
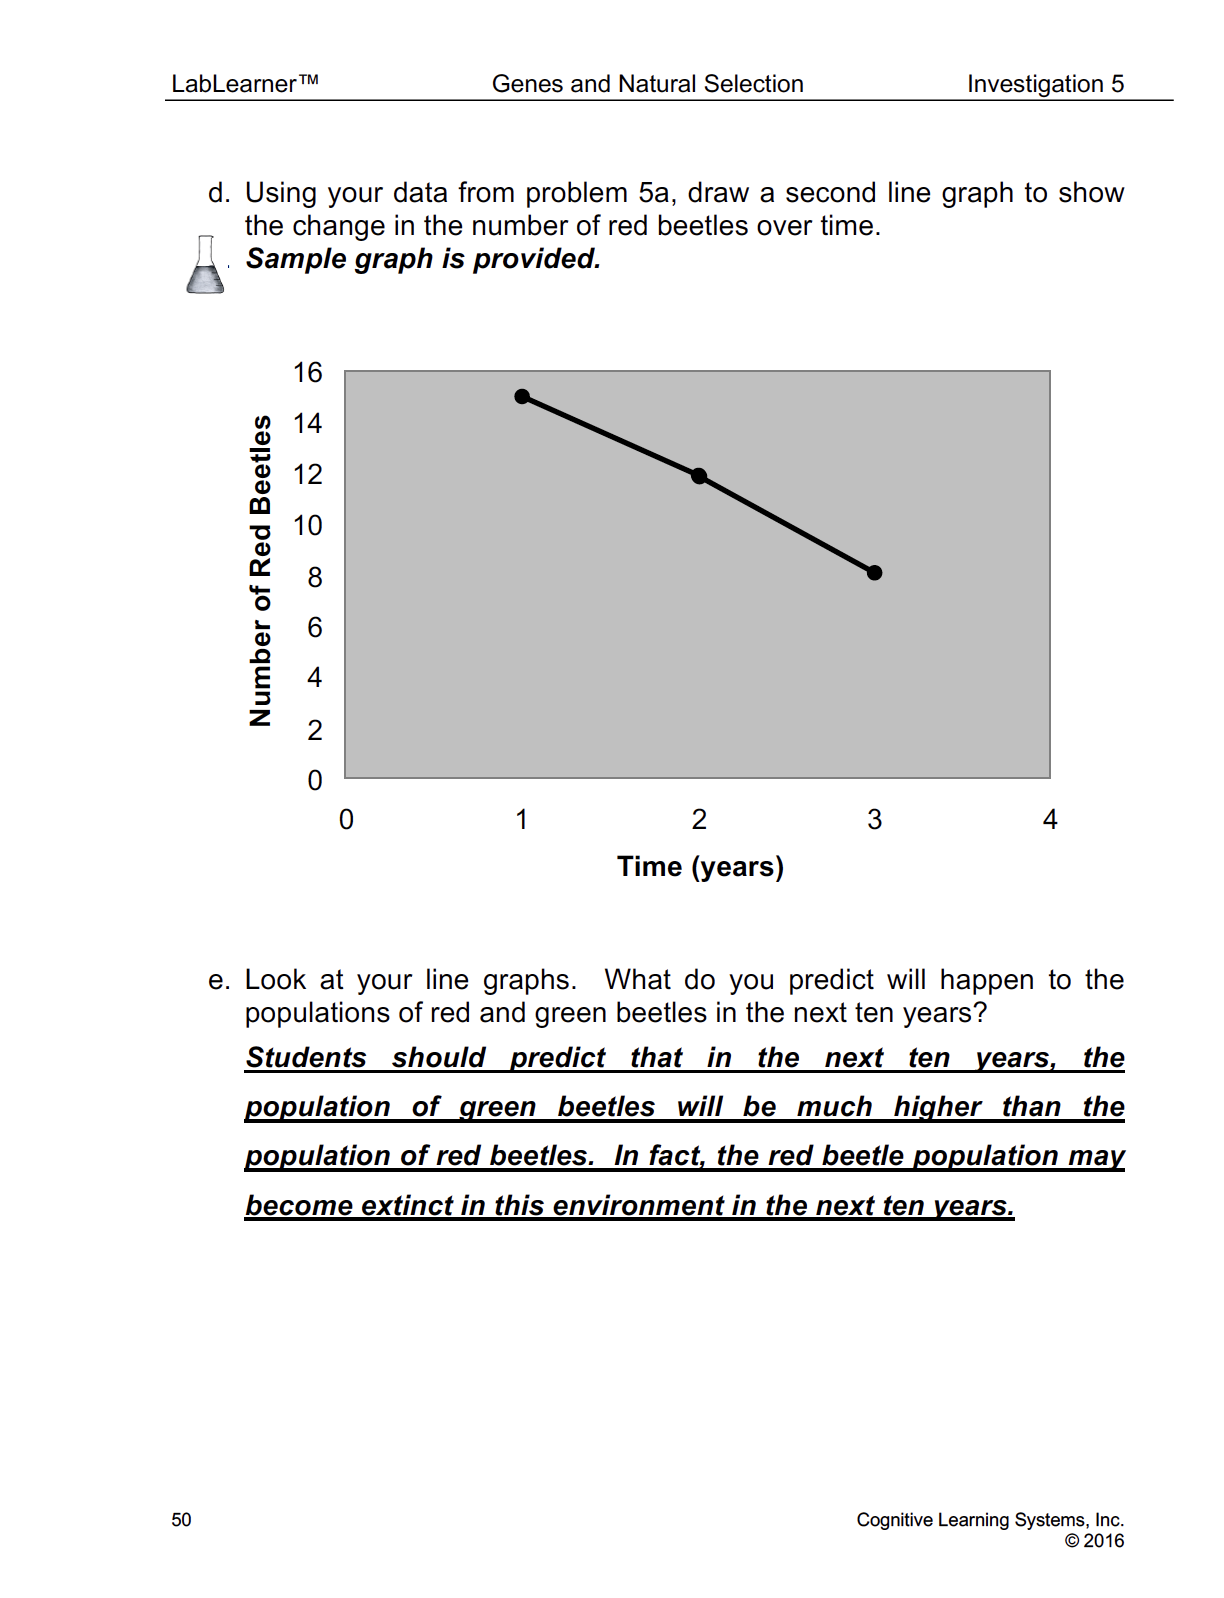
d. Using your data from Problem 5a, draw a second line graph to show the change in the number of red beetles over time.
Ask students: Can you describe your line graph? Students should indicate that this line graph slopes downward to the right indicating a decreasing number of red beetles over time.
e. Look at your line graphs. What do you predict will happen to the populations of red and green beetles in the next ten years? Students should predict that in the next ten years, the population of green beetles will be much higher than the population of red beetles. In fact, the red beetle population may become extinct in this environment in the next ten years.
______________________________________________
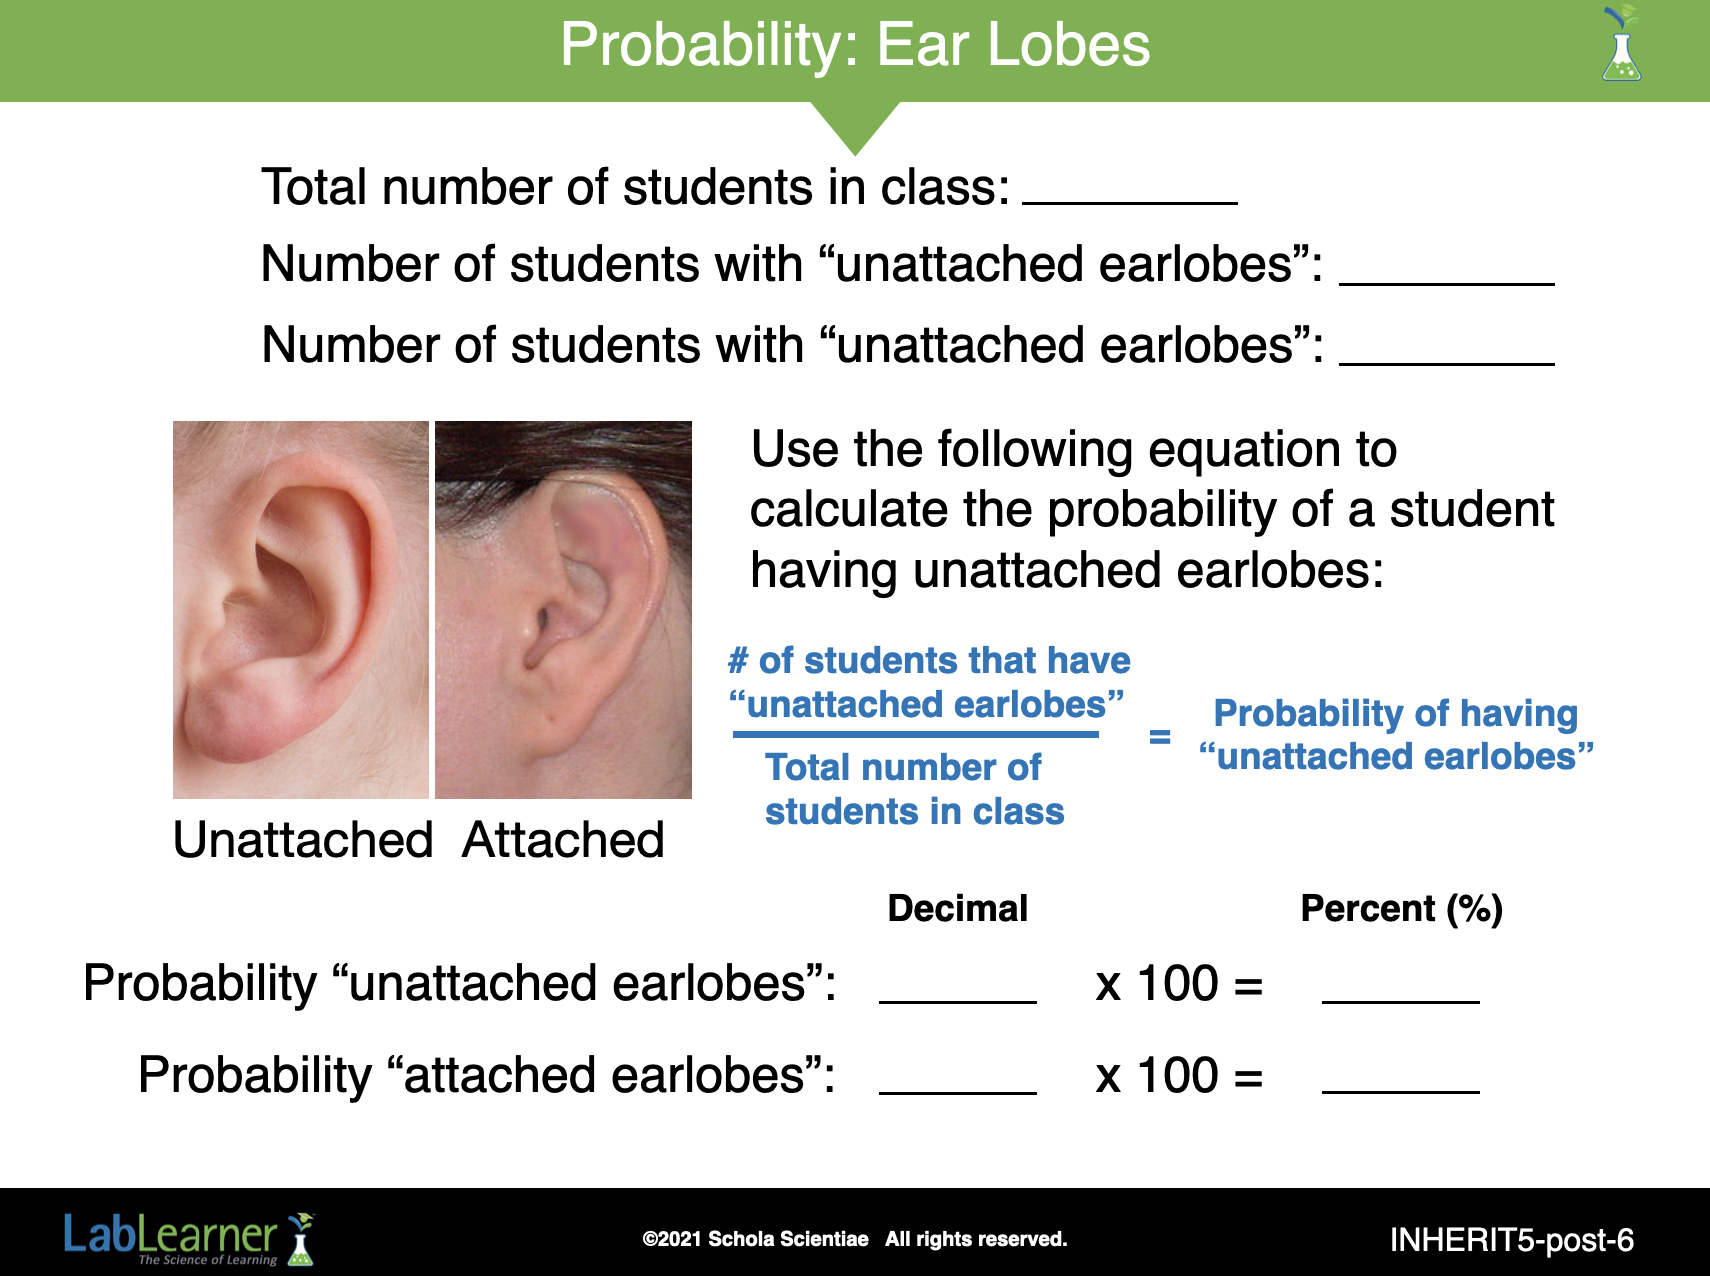
SLIDE INHERIT5-post-6
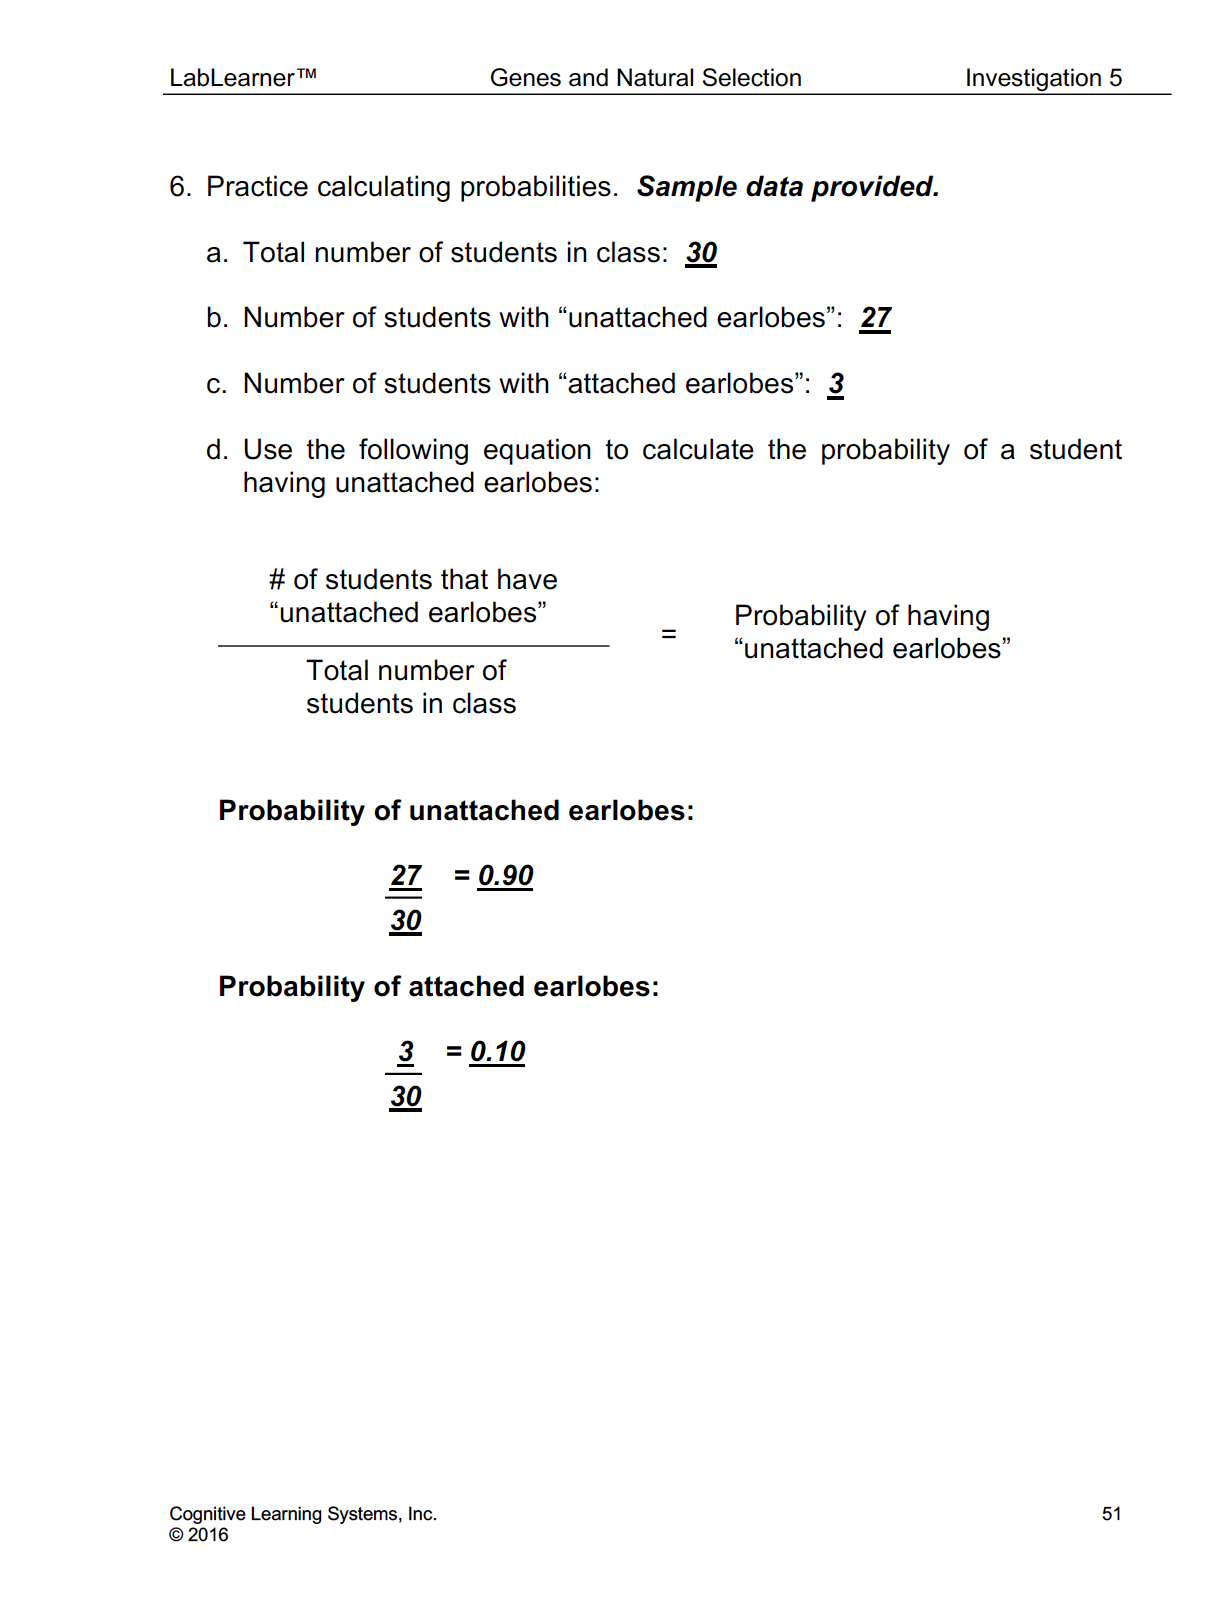
Introduce students to the concept of probability and provide them with an opportunity to practice calculating probabilities.
1. Ask a student volunteer to read the definition of probability from the Scientist’s Glossary. Help students to understand that probability involves a likelihood of something happening.
“Probability: The likelihood that a trait will be or will not be observed in a species.”
2. Explain to students that scientists calculate probabilities to determine how likely or how often a specific trait will be seen in a species of organisms. Traits that have a high probability will be seen very often in a species while a trait with a low probability is not seen very often in a species.
3. Ask students to think of their experiment. Ask: What types of traits do you think will be seen most often in a species? Students should indicate that adaptive or beneficial traits will be seen often.
4. Explain that you will show them how to calculate how likely a trait is to be seen as a proportion of the total number of organisms in the species. Write the following equation on the board:
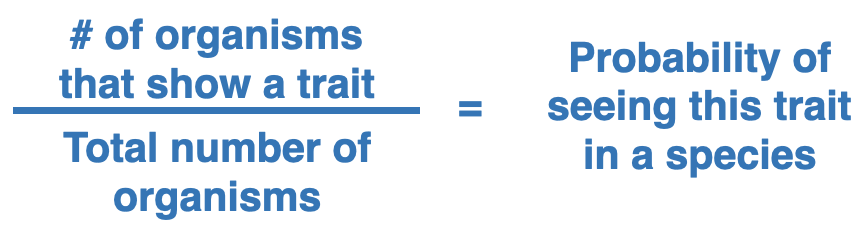
5. Tell students that probability can range between 0.0 and 1.0. A probability close to 0.0 reflects something that is very unlikely to be observed. A probability close to 1.0 reflects something that is very likely to be observed.
6. Tell students that the trait “unattached earlobes” is going to be used as an example. Ask students to raise their hands if they have unattached earlobes. Write the data on the board (as in the example below).
Total number of students in class: 30
Number of students with unattached earlobes: 27
Number of students with attached earlobes: 3
7. Encourage students to record this information in Problems 6a – 6c of their Student Data Record.
8. As a class, determine the probability that “unattached earlobes” will appear in a population of humans. Encourage students to record this calculation and answer in Problem 6d of their Student Data Record.
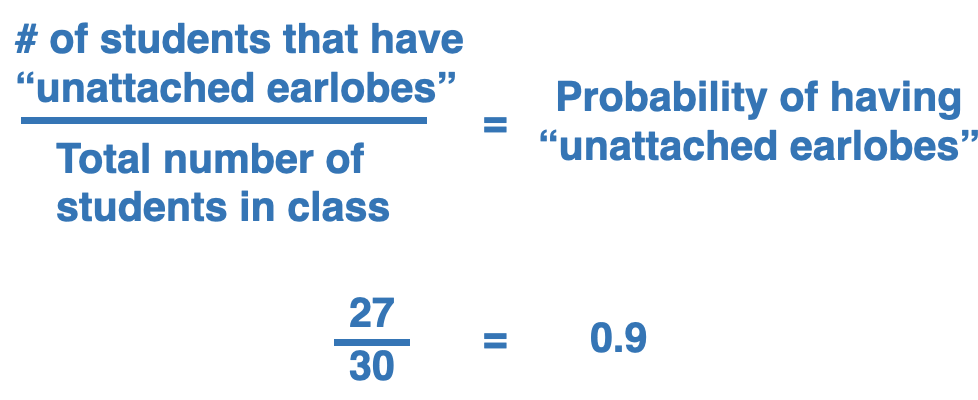
9. Ask: Is this probability close to 0.0 or close to 1.0? Students should indicate that this probability is close to 1.0, and hence reflects something that is very likely to happen.
10. Encourage students to calculate the probability that “attached earlobes” will appear in a population of humans. Encourage students to record the calculation and answer in Problem 6d of their Student Data Record.
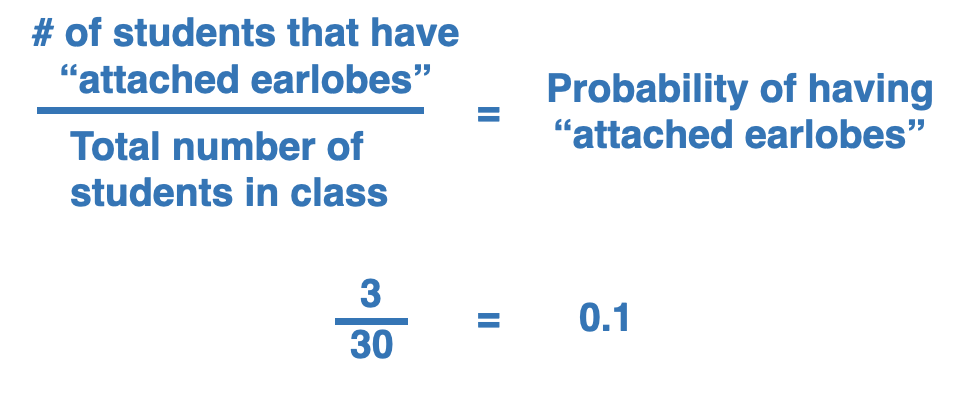
11. Ask students: Is this trait close to 0.0 or 1.0? Which trait had the higher probability? Lower probability? Students should indicate that “attached earlobes” have a low probability, and that “unattached earlobes” had a higher probability.
12. Ask students: Which trait do you think is the dominant trait? Recessive trait? Why?
Students should indicate that “unattached earlobes” is the dominant trait and “attached earlobes” is the recessive trait. This is because there is a higher frequency of unattached earlobes than attached earlobes.
______________________________________________
SLIDE INHERIT5-post-7
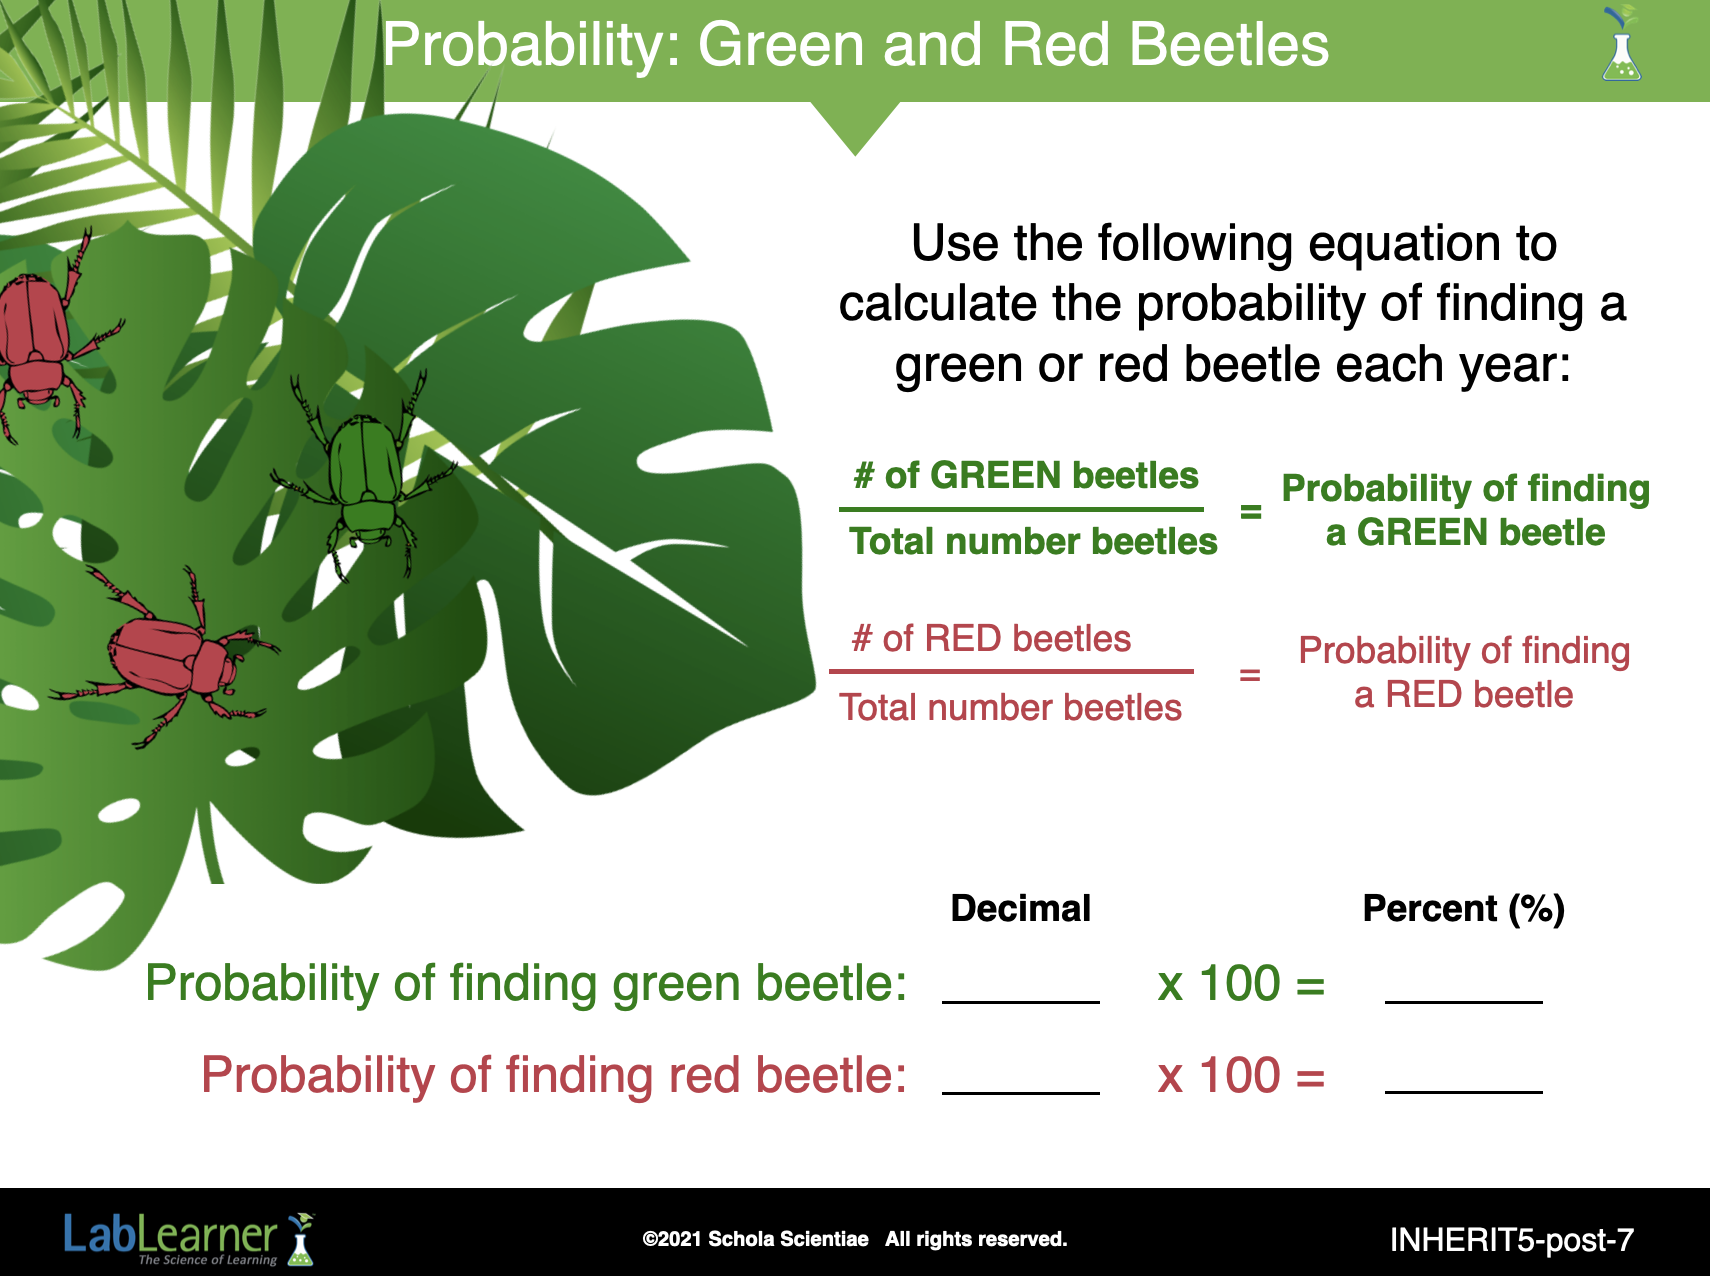
Inform students that they are going to calculate the probabilities of the two traits they tested in the lab: green-colored beetles and red-colored beetles.
a. Divide students into the same groups of three that worked together in the Lab.
b. Direct students to calculate the probabilities for each color of beetle for each year. Students may use calculators.
c. Encourage students to record their answers in the table in Problem 7a of their Student Data Record.
d. Once students have completed their table, ask them to complete Problems 7b and 7c of their Student Data Record.
e. Allow sufficient time for students to complete this activity. Once complete, encourage several student groups to share their answers with the class.
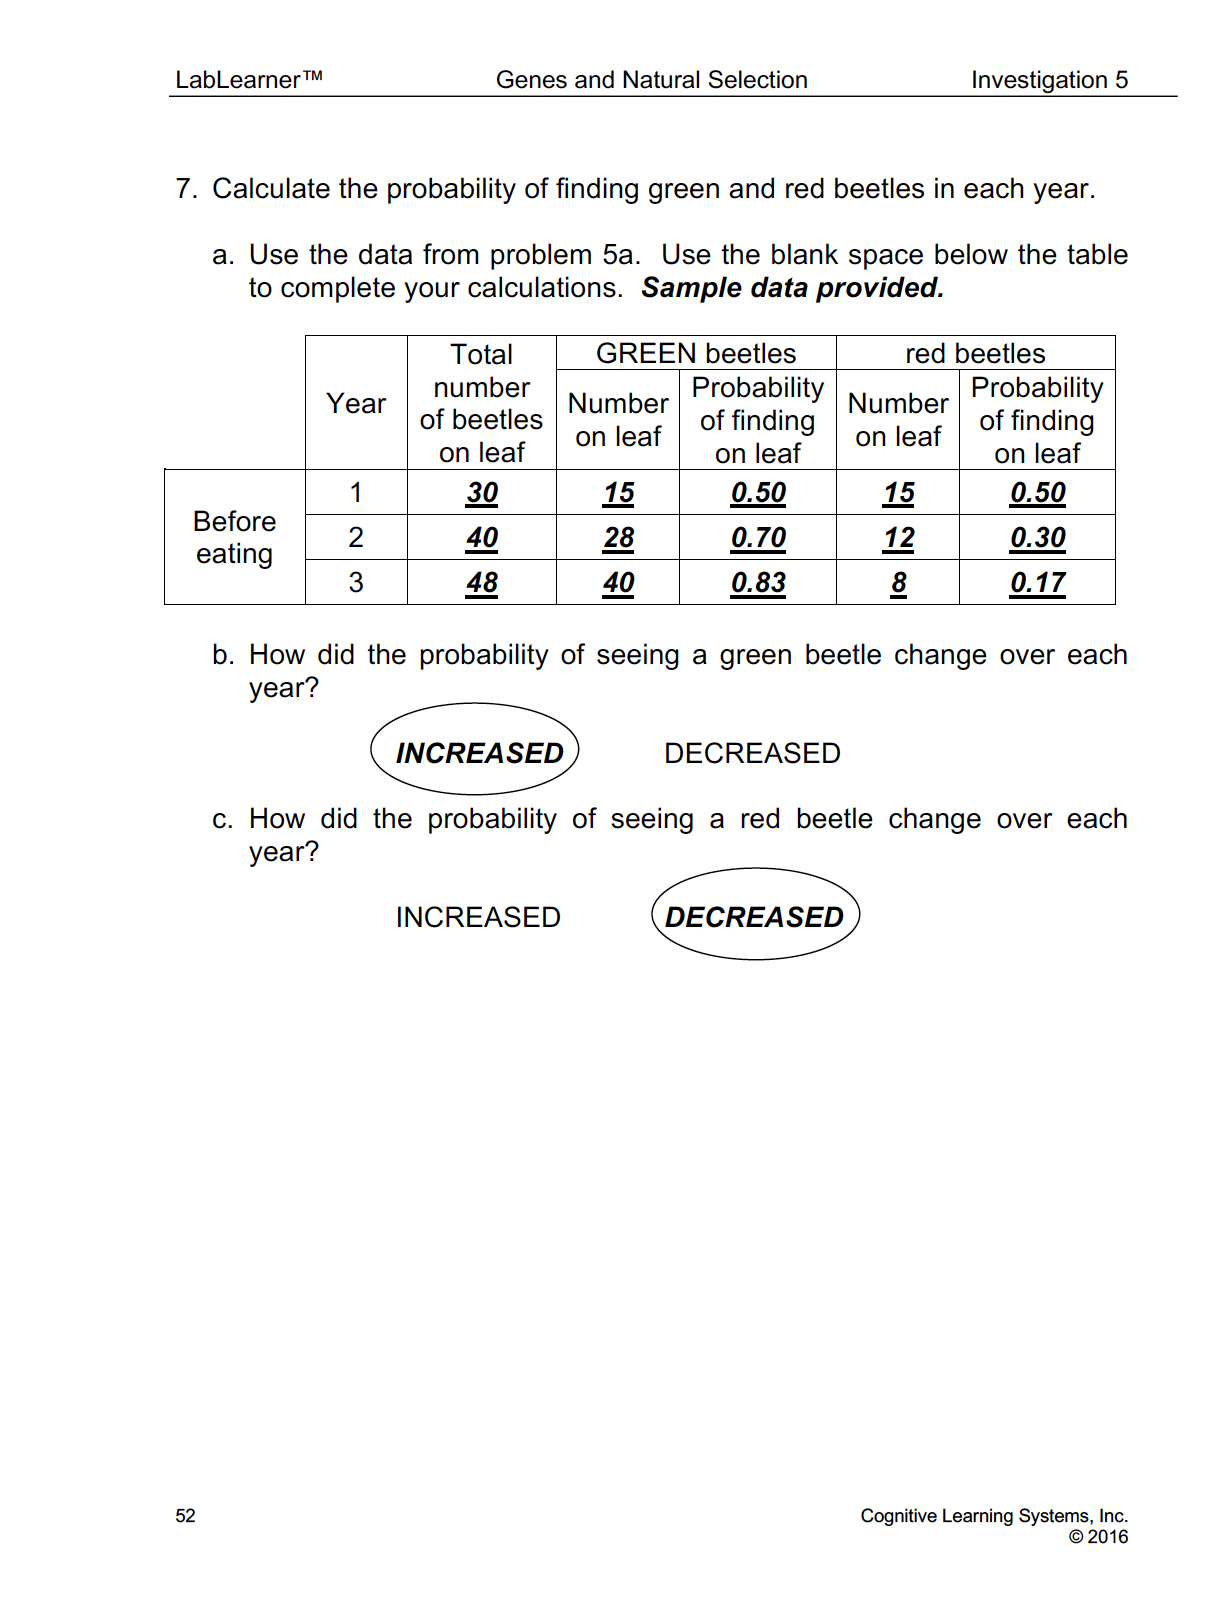
f. Ask students: How did the probability of seeing a green beetle change over each year? Why? Students should indicate that each year the probability of seeing a green beetle increased. This occurred because more green beetles survived and reproduced each year.
g. Ask students: How did the probability of seeing a red beetle change over each year? Why? Students should indicate that each year the probability of seeing a red beetle decreased. This occurred because fewer red beetles survived and reproduced each year.
______________________________________________
SLIDE INHERIT5-post-8
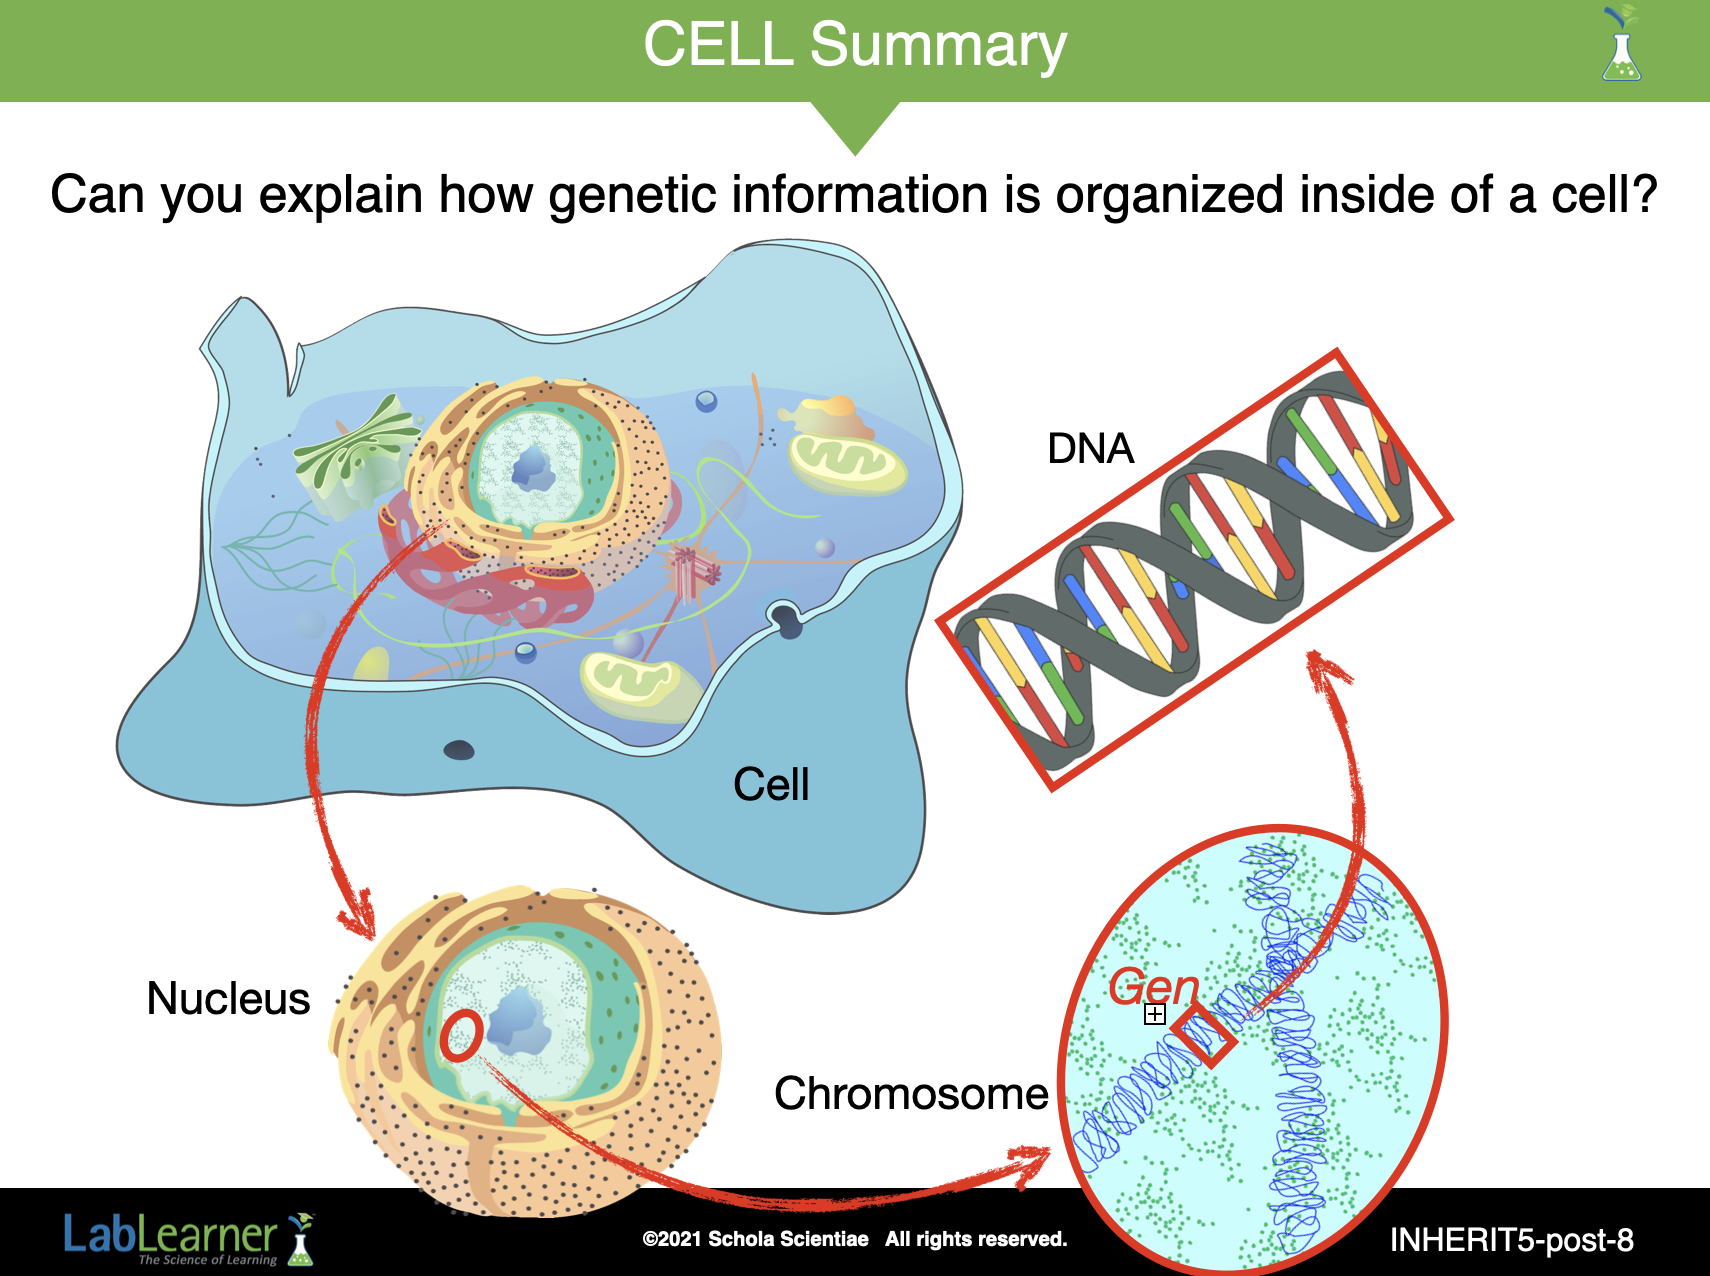
This is a review/summary slide for the CELL Inheritance and Adaptations. Use the following question to promote discussion and review:
Can you explain how genetic information is organized inside of a cell?
______________________________________________
SLIDE INHERIT5-post-9
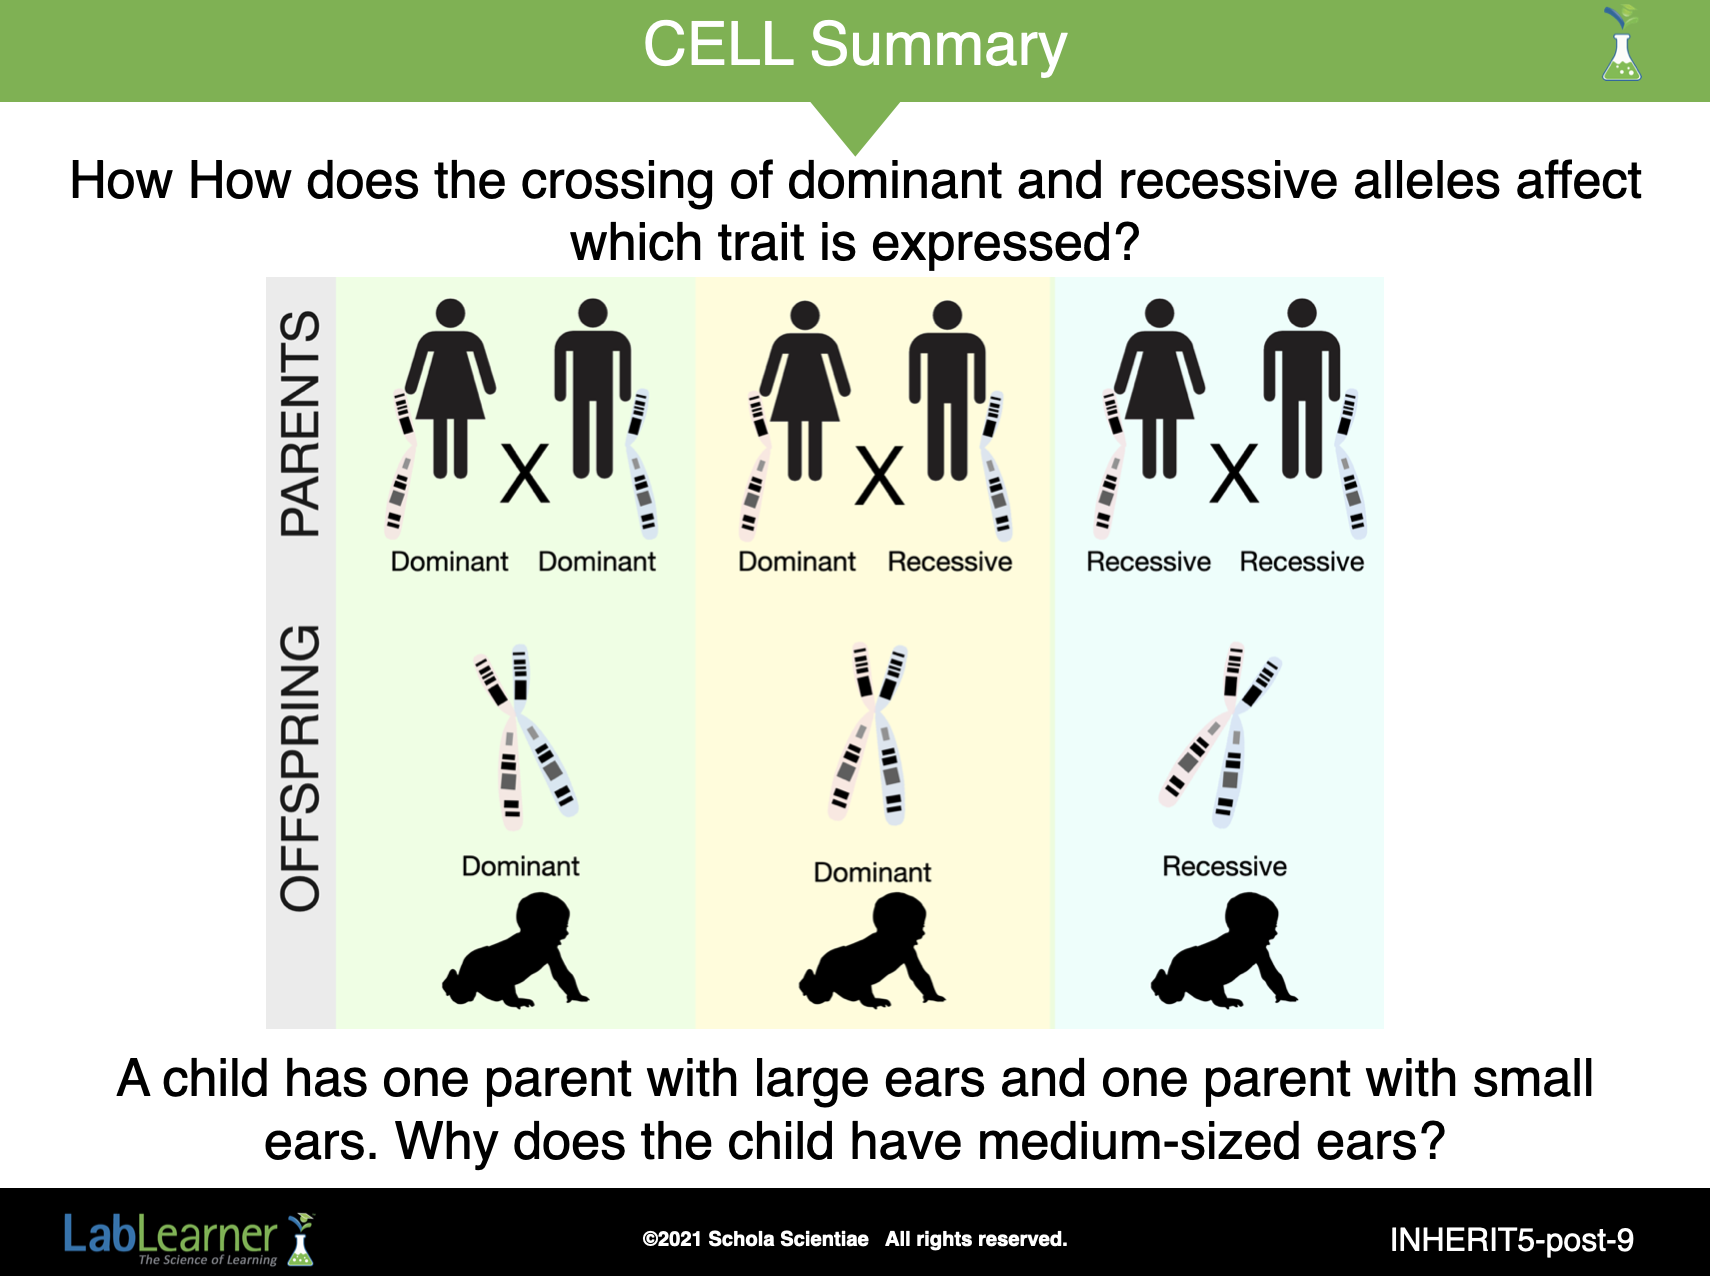
This is a review/summary slide for the CELL Inheritance and Adaptations. Use the following questions to promote discussion and review:
How How does the crossing of dominant and recessive alleles affect which trait is expressed?
A child has one parent with large ears and one parent with small ears. Why does the child have medium-sized ears?
______________________________________________
SLIDE INHERIT5-post-10
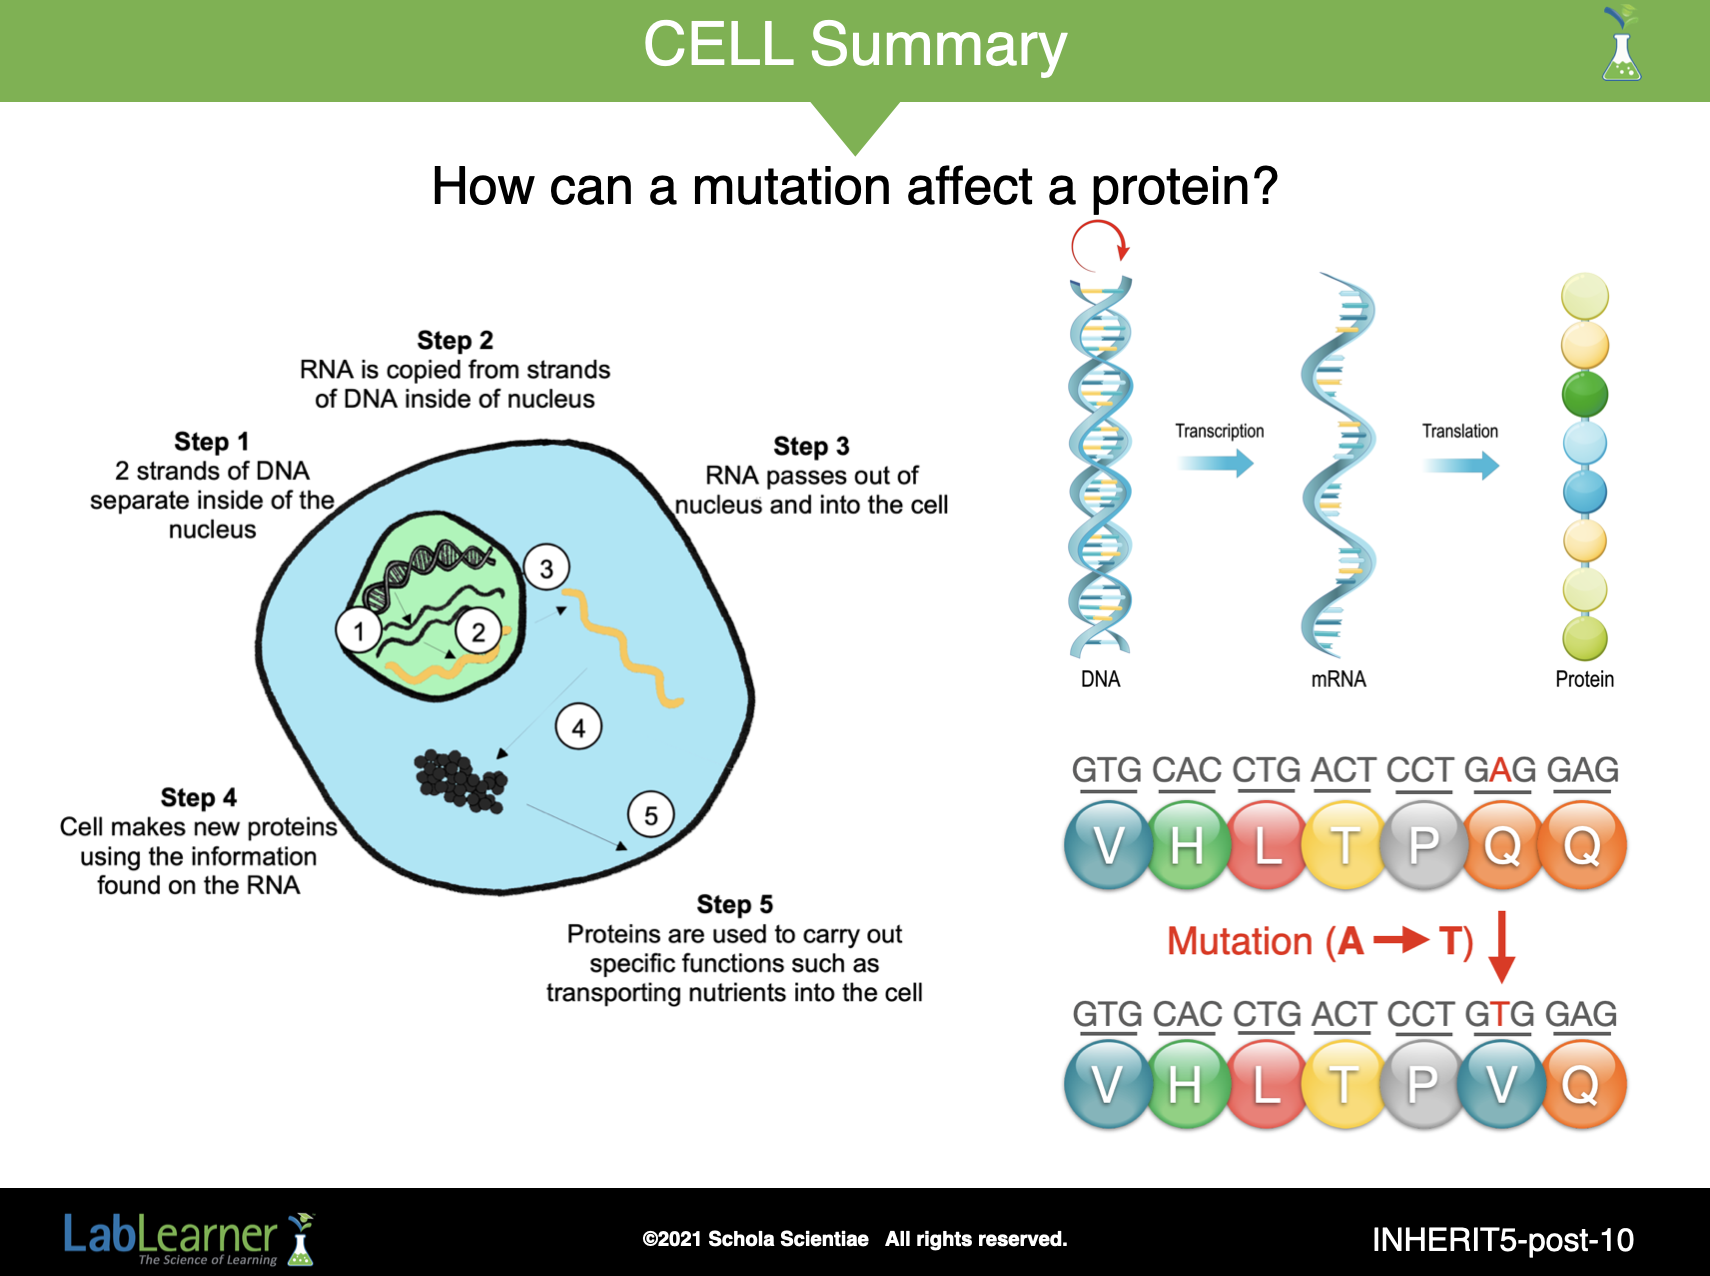
This is a review/summary slide for the CELL Inheritance and Adaptations. Use the following question to promote discussion and review:
How can a mutation affect a protein?
______________________________________________
SLIDE INHERIT5-post-11
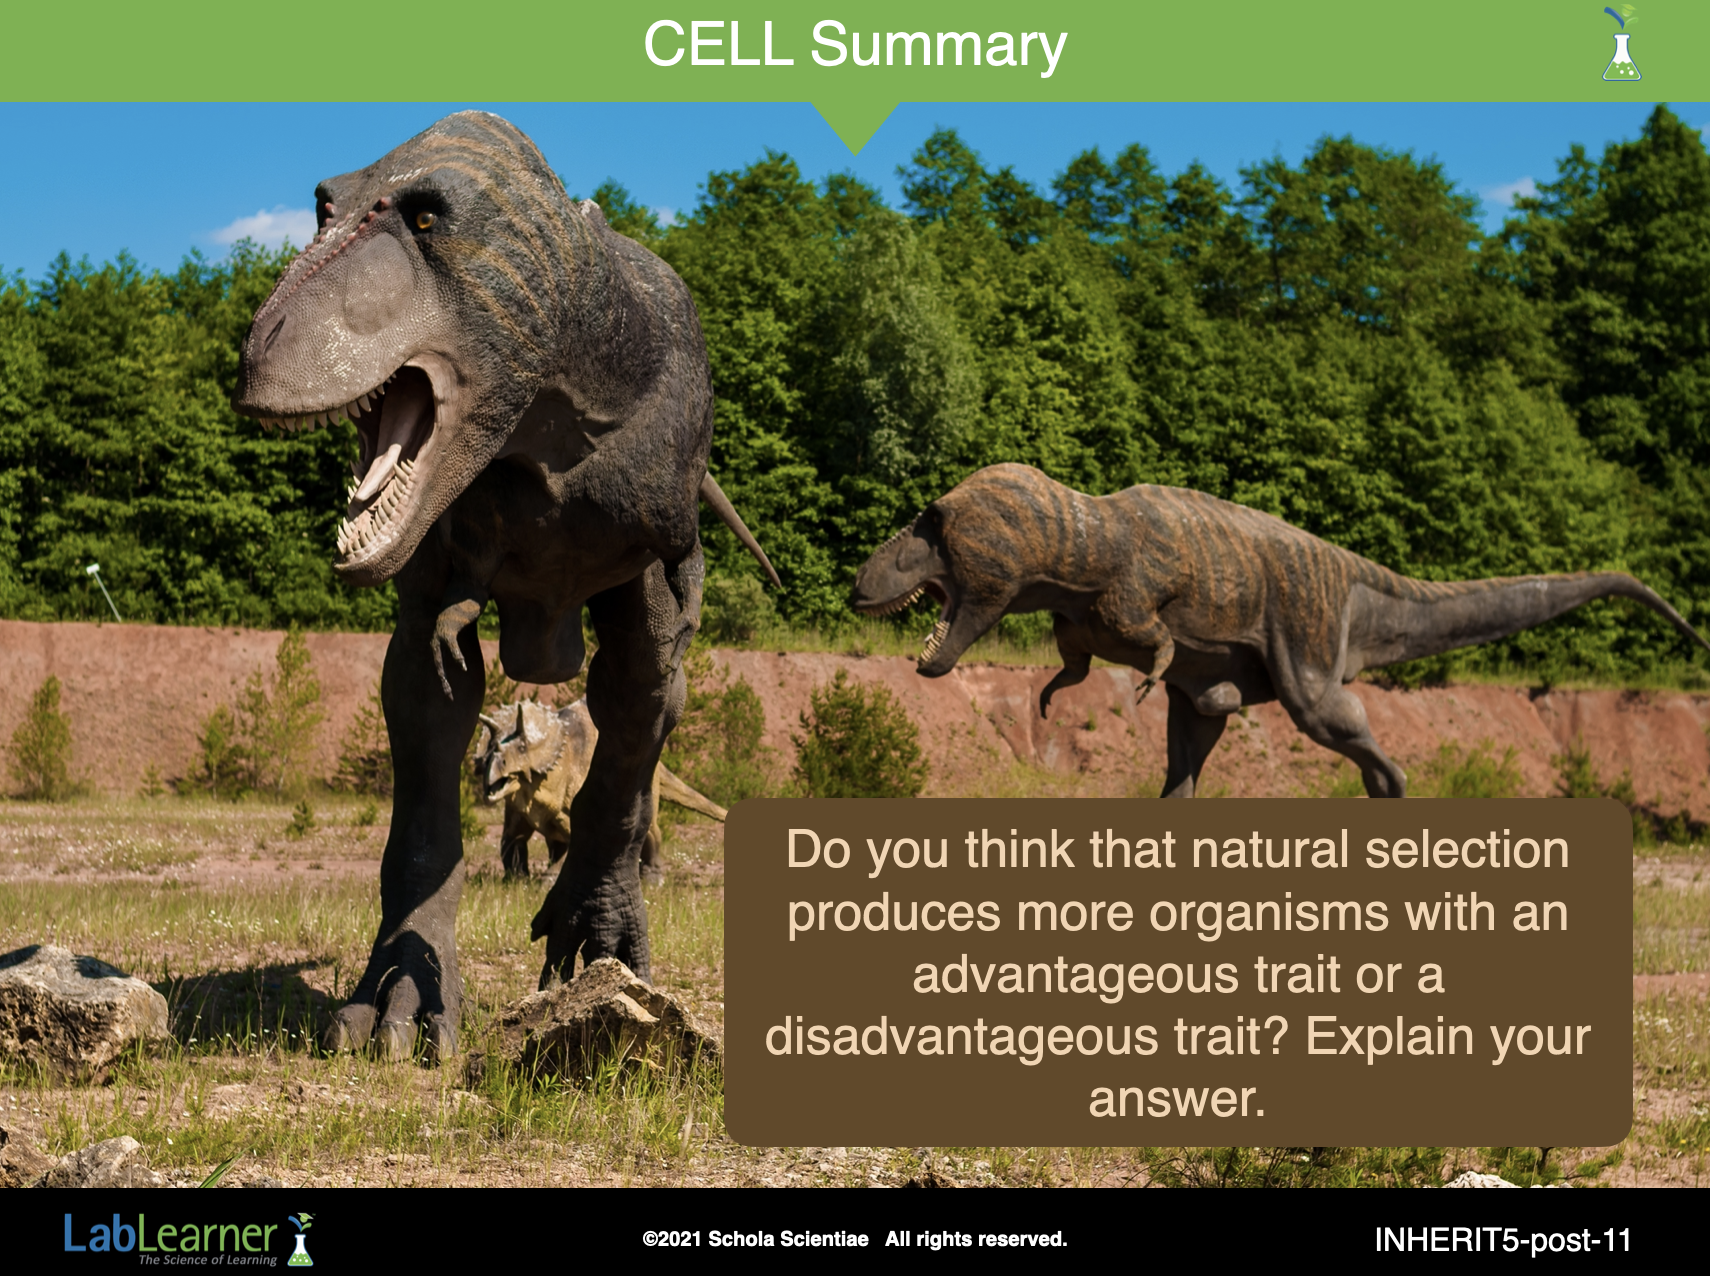
This is a review/summary slide for the CELL Inheritance and Adaptations. Use the following question to promote discussion and review:
Do you think that natural selection produces more organisms with an advantageous trait or a disadvantageous trait? Explain your answer.
______________________________________________
KEYS: POSTLAB