Teacher Portal:
Investigating Heat
Investigation 5 – PostLab
 PRINT IT
Use your browser to download a printable PDF as help during the slide presentation and to make additional notes. In your browser, go to File > Print and then choose to save as PDF.
NAVIGATE IT
Once the slide presentation is launched
- use your left and right arrows to advance or go back in the slide presentation, and
- hover your mouse over the left edge of the presentation to get a view of the thumbnails for all the slides so that you can quickly move anywhere in the presentation.
- Click HERE to launch the slide presentation for the CELL.
SHARE IT

SLIDE VHEAT5-post-1
This is the last regular Investigation of the Investigating Heat LabLearner CELL. In it, students explored the involvement of mass and surface area on heat transfer.
______________________________________________
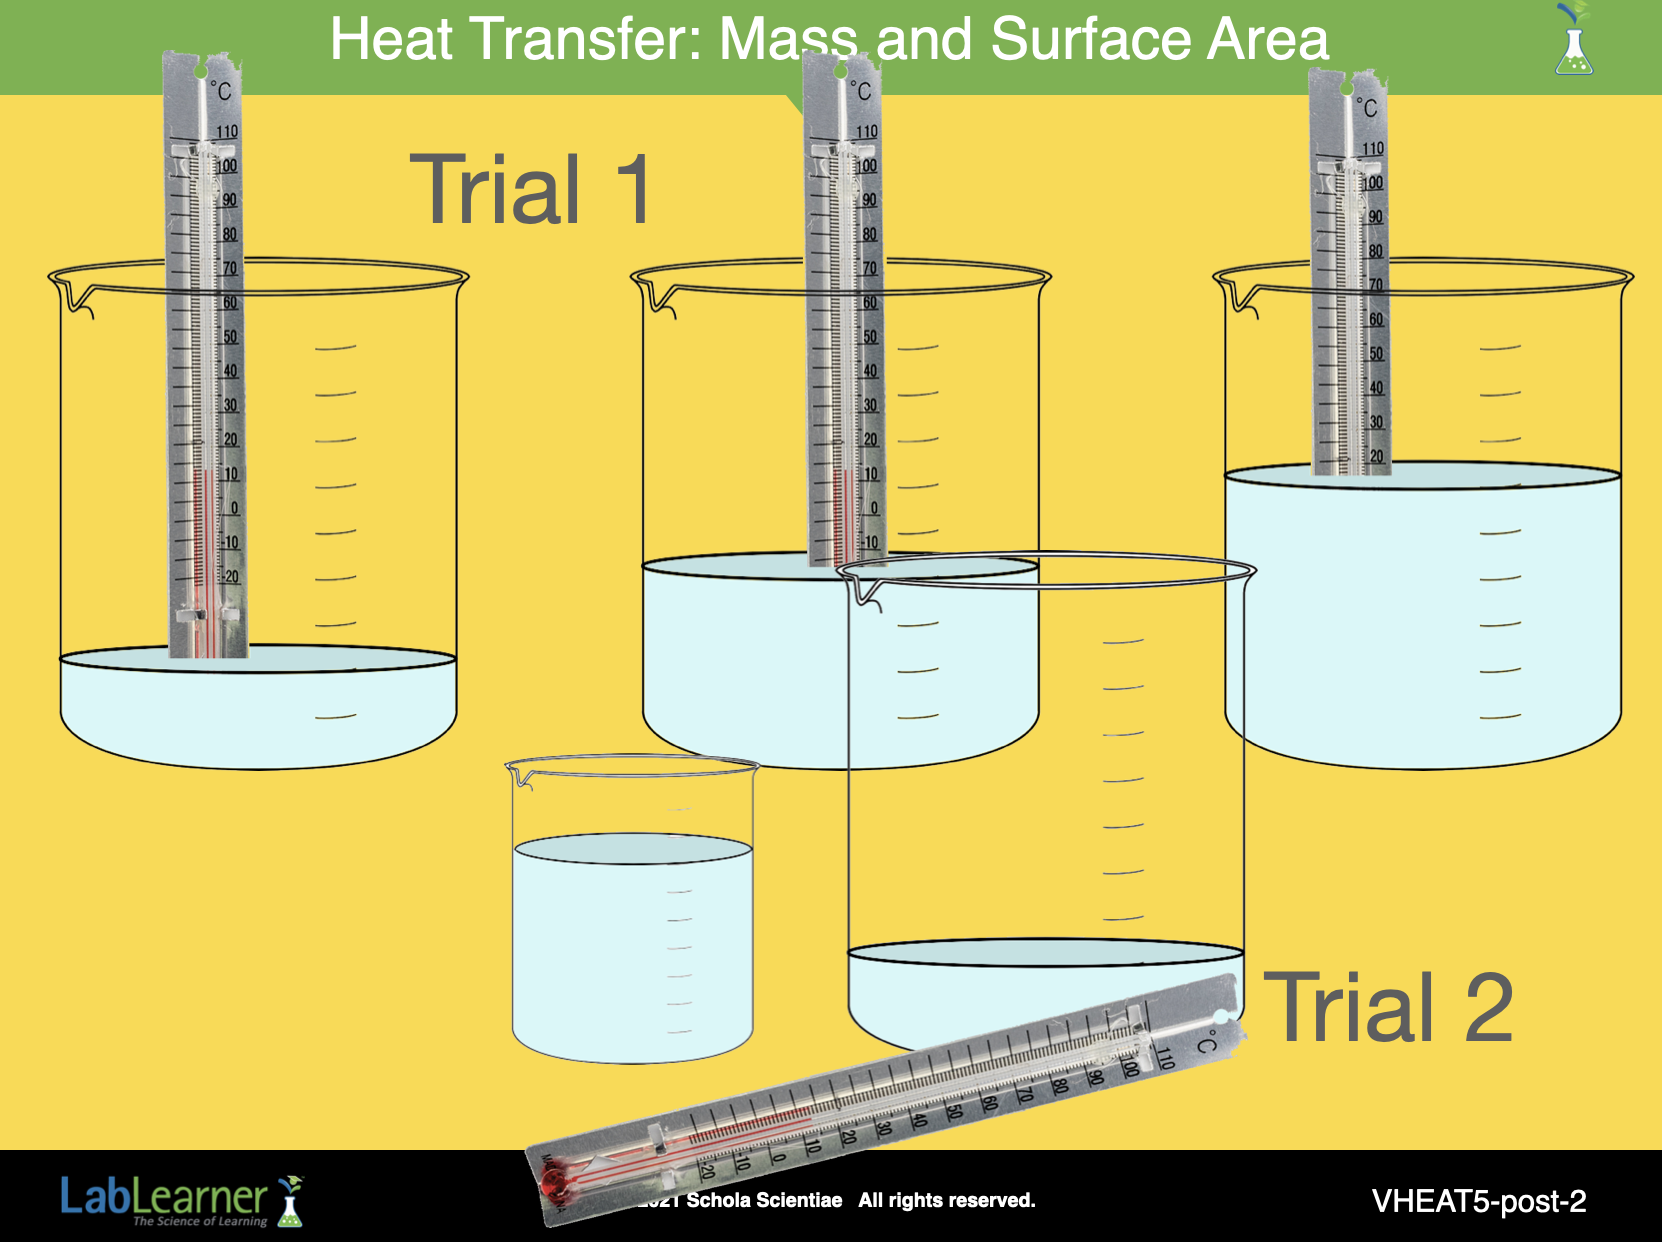
SLIDE VHEAT5-post-2
A. Begin this part of the Investigation by reviewing the experiments students performed in the lab. The following questions may be helpful in prompting student discussion:
1. Ask students: What were the main questions you investigated in this lab? The main questions students investigated were: How does the mass of liquids affect the rate of heat transfer? How does the surface area of the containers holding liquids affect the rate of heat transfer?
2. Ask students: What experiments did you perform in this lab? What was the purpose of the experiments? In Trial 1, students determined the rate of heat transfer for three different masses of water in order to investigate the effect of mass on the rate of heat transfer. In Trial 2, students put equal amounts of water in two different-sized containers to explore the effect of surface area on the rate of heat transfer.
______________________________________________
SLIDE VHEAT5-post-3
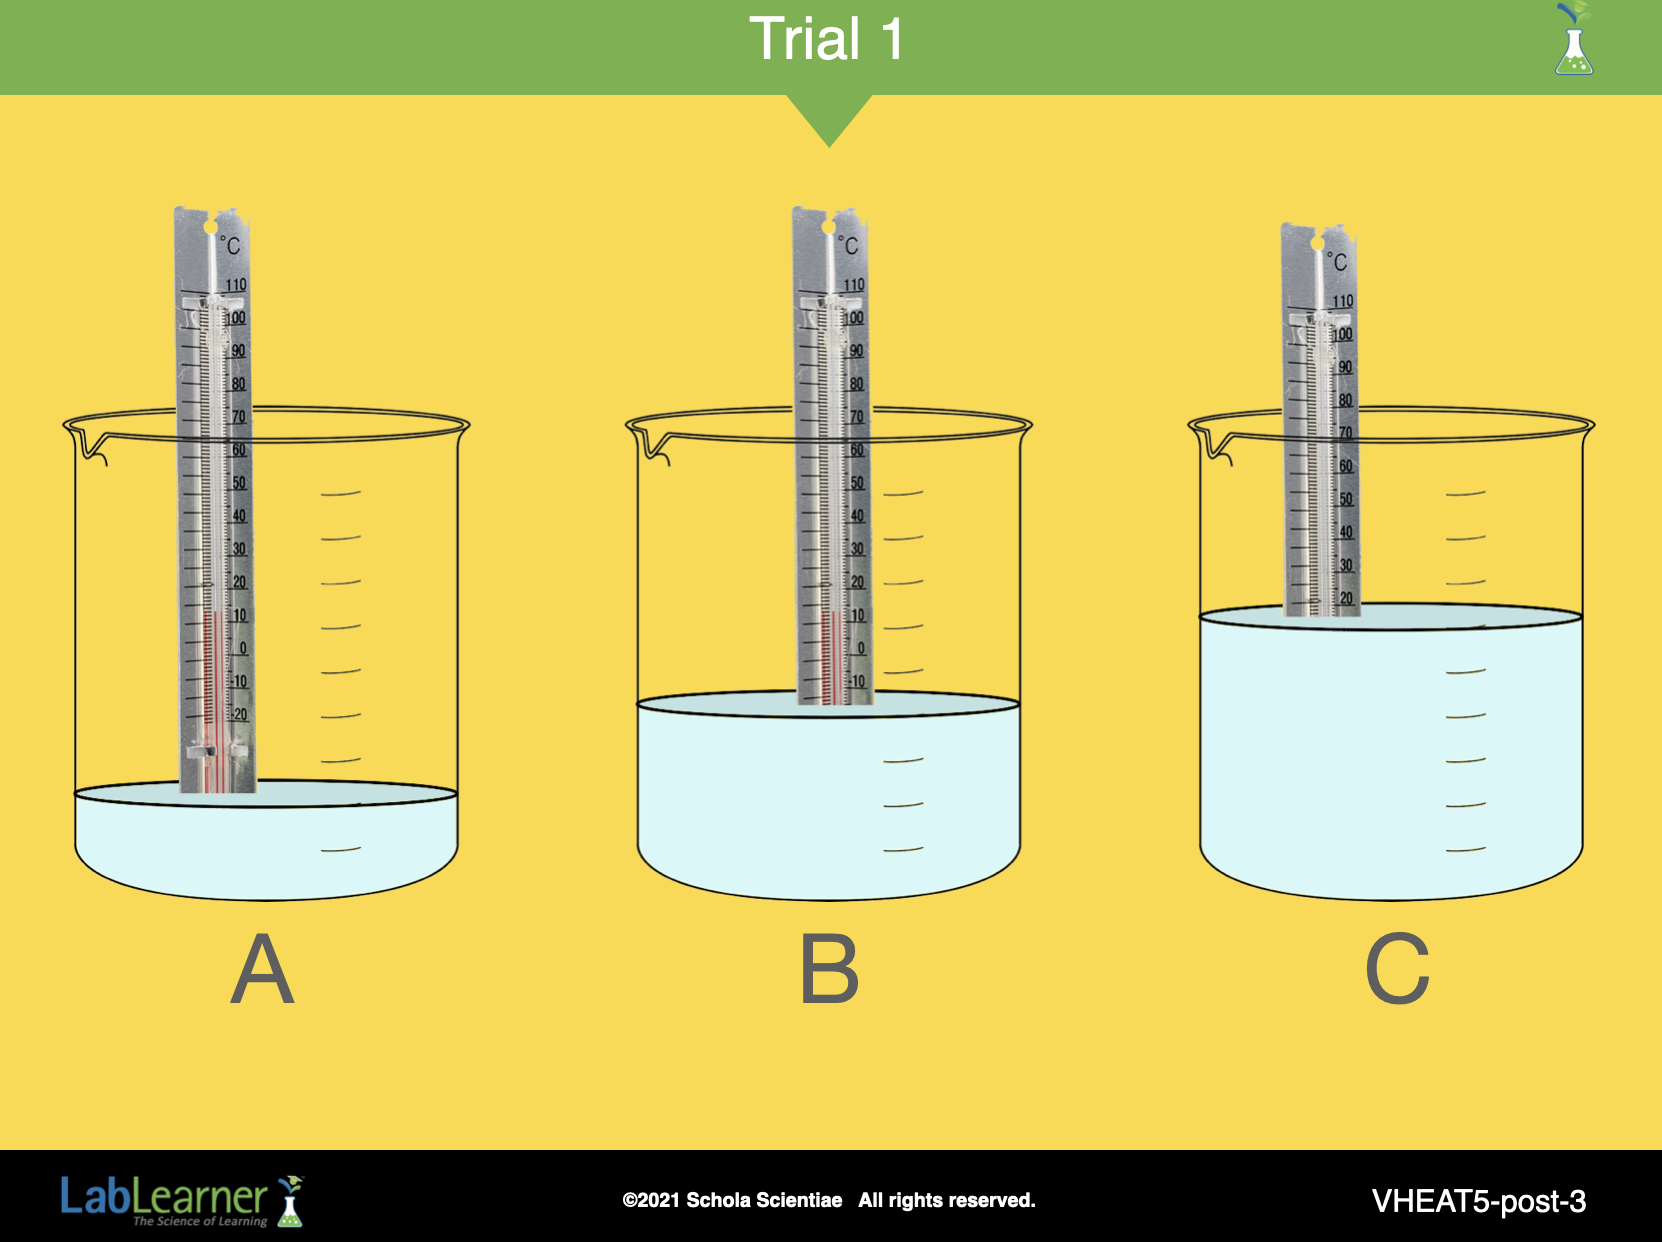
B. Begin the analysis by discussing Trial 1, the experiment in which students investigated the effect of differences in the mass of a liquid.
1. Ask students: What was different about the three samples of water in Trial 1? The three samples had different masses and volumes.
2. Ask students: Did you notice a relationship between the volumes of water and the masses? How would you describe the relationship? As the volume of water increased, the mass of the water increased. As the volume of water decreased, the mass of the water decreased.
3. Ask students: Did each sample begin at the same temperature? Each sample had the same beginning temperature as the other three samples in the Trial.
4. Ask students: Did each sample end at the same temperature? Samples did not end at the same temperature. Each sample had a different ending temperature from the other samples in the Trial.
5. Ask students: Why do you think the three samples did not end at the same temperature? Do you have any data from your experiments that could explain why? Student answers may vary. The three samples differed only in mass (volume) and ending temperature. As mass (volume) is the only other variable that changed, the difference in mass (volume) between the samples is a likely cause of the difference in ending temperature. Mass is emphasized instead of volume as the method for determining quantity because the volume of liquids is affected by pressure and temperature, while the mass remains constant.
Encourage students to recall their answer to Problem B1 if necessary to assist them in reaching this conclusion.
______________________________________________
SLIDE VHEAT5-post-4
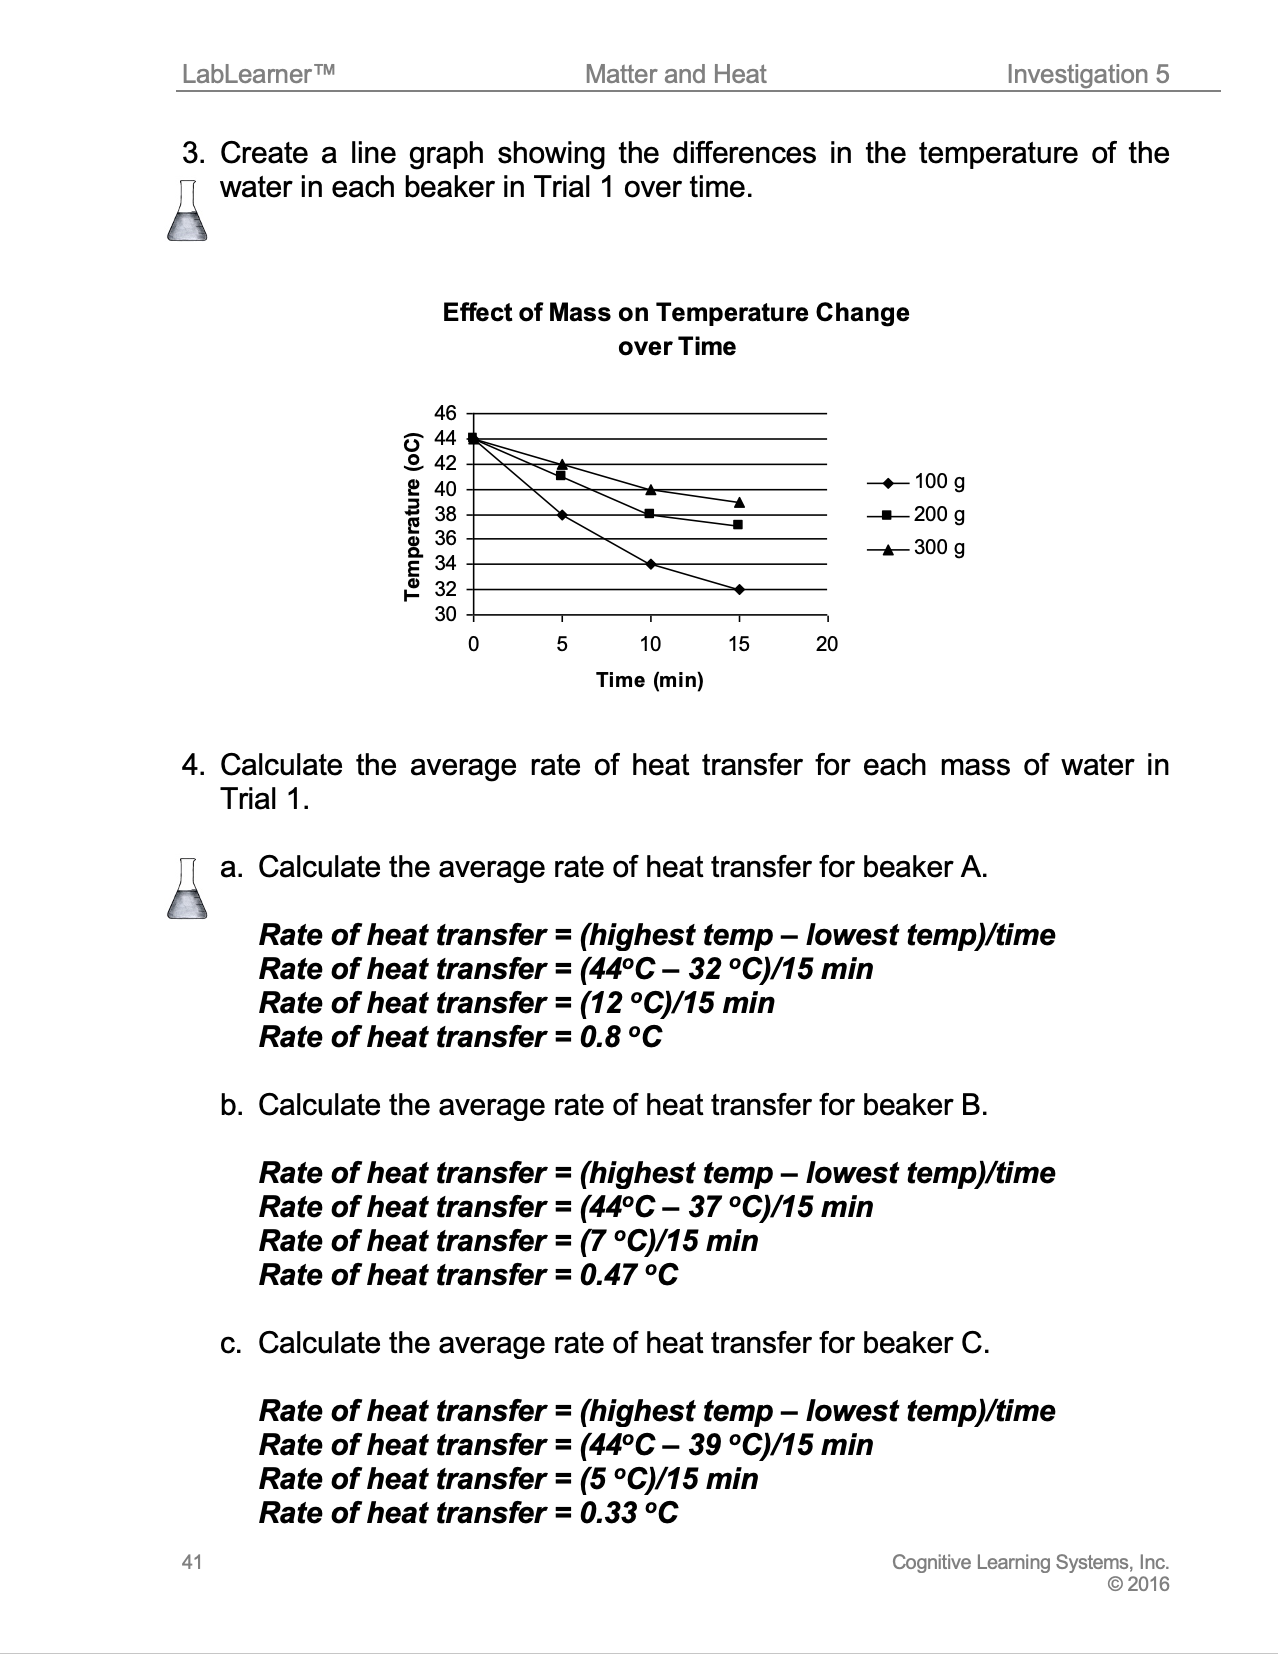
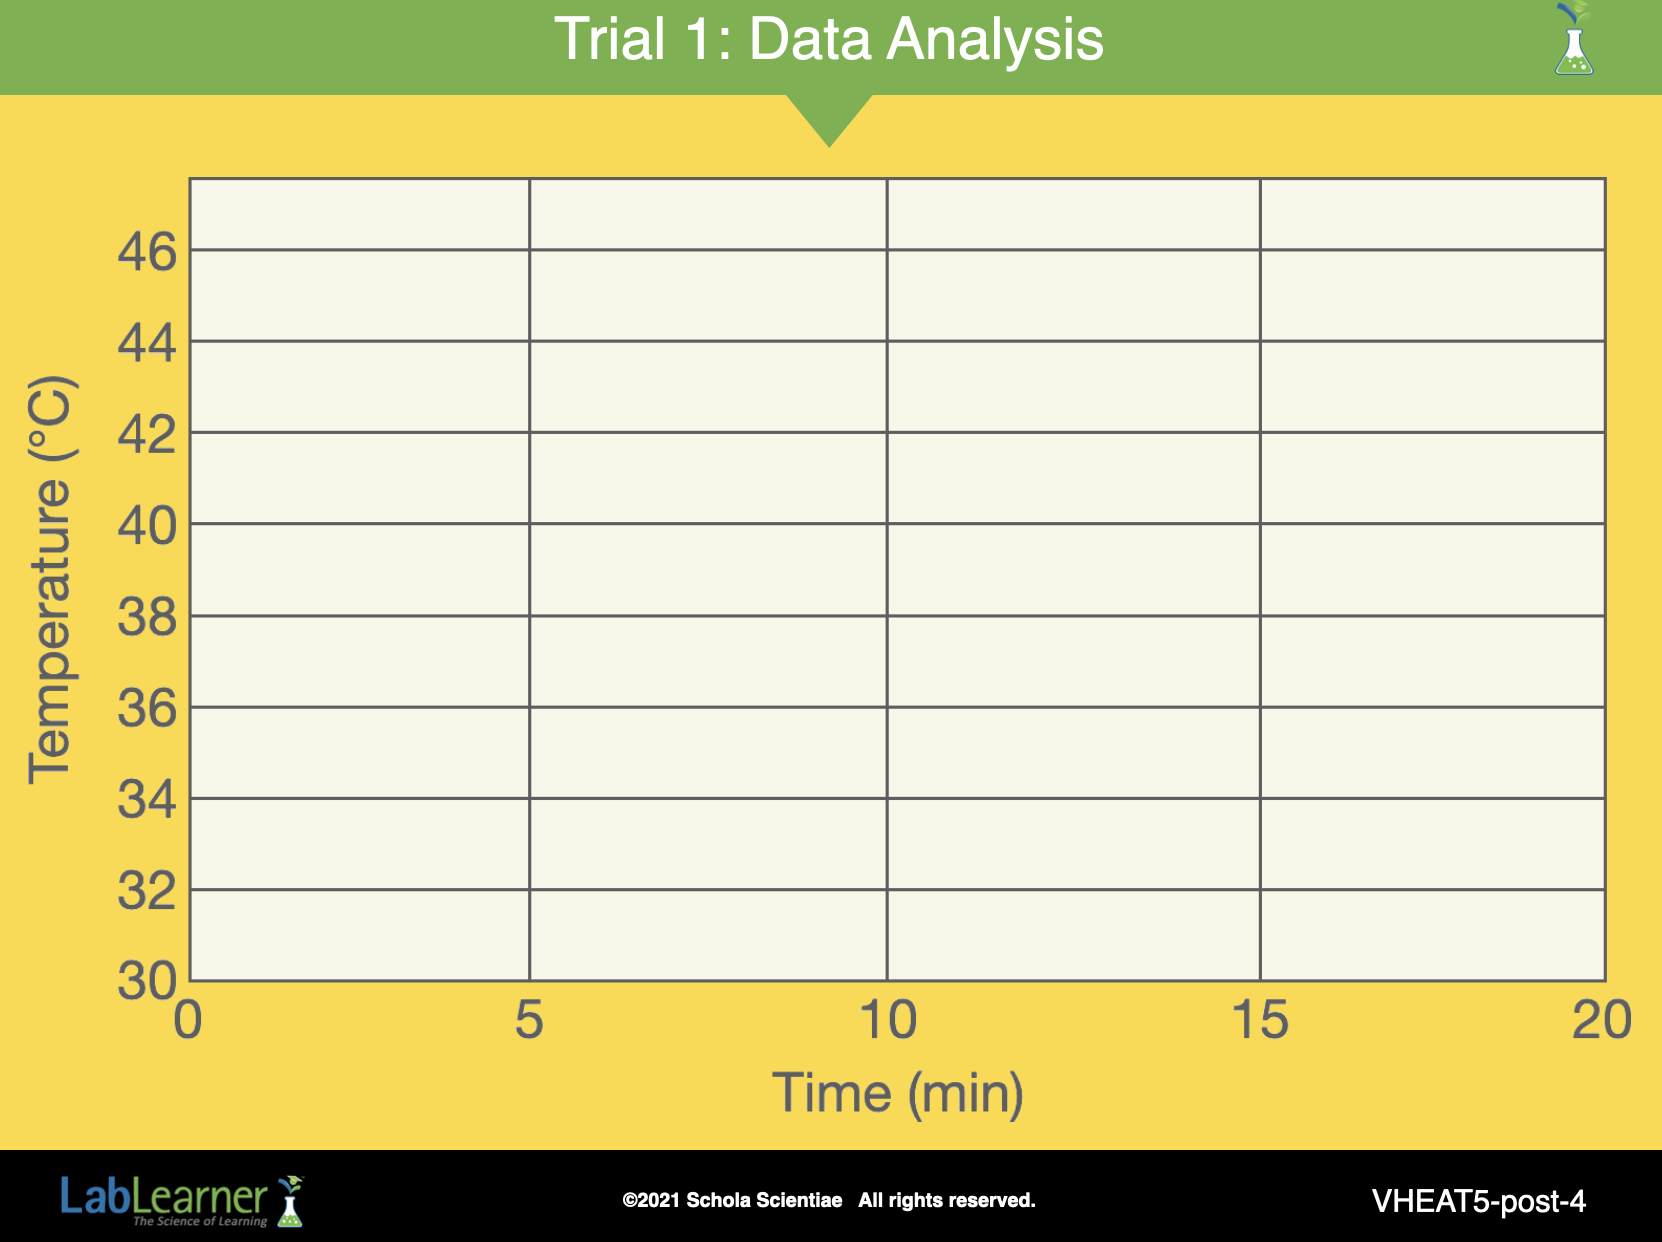
6. Ask students: How could you organize your data to easily see the changes heat transfer during each part of the experiment? Student answers may vary. Students may suggest using a bar graph. However, a bar graph would not illustrate the change in temperature for each sample in a continuous fashion as a line graph would. In addition, a line graph would allow students to more easily see the effect of changing mass on the rate at which the temperature changed.
a. Encourage students to create a line graph for Trial 1 that shows the change in temperature during each time point of the three beakers in Trial 1.
b. Remind students that creating and constructing a line graph is a tool from their Procedural Toolbox that they have used before: if they need help, they should refer to their Procedural Toolbox.
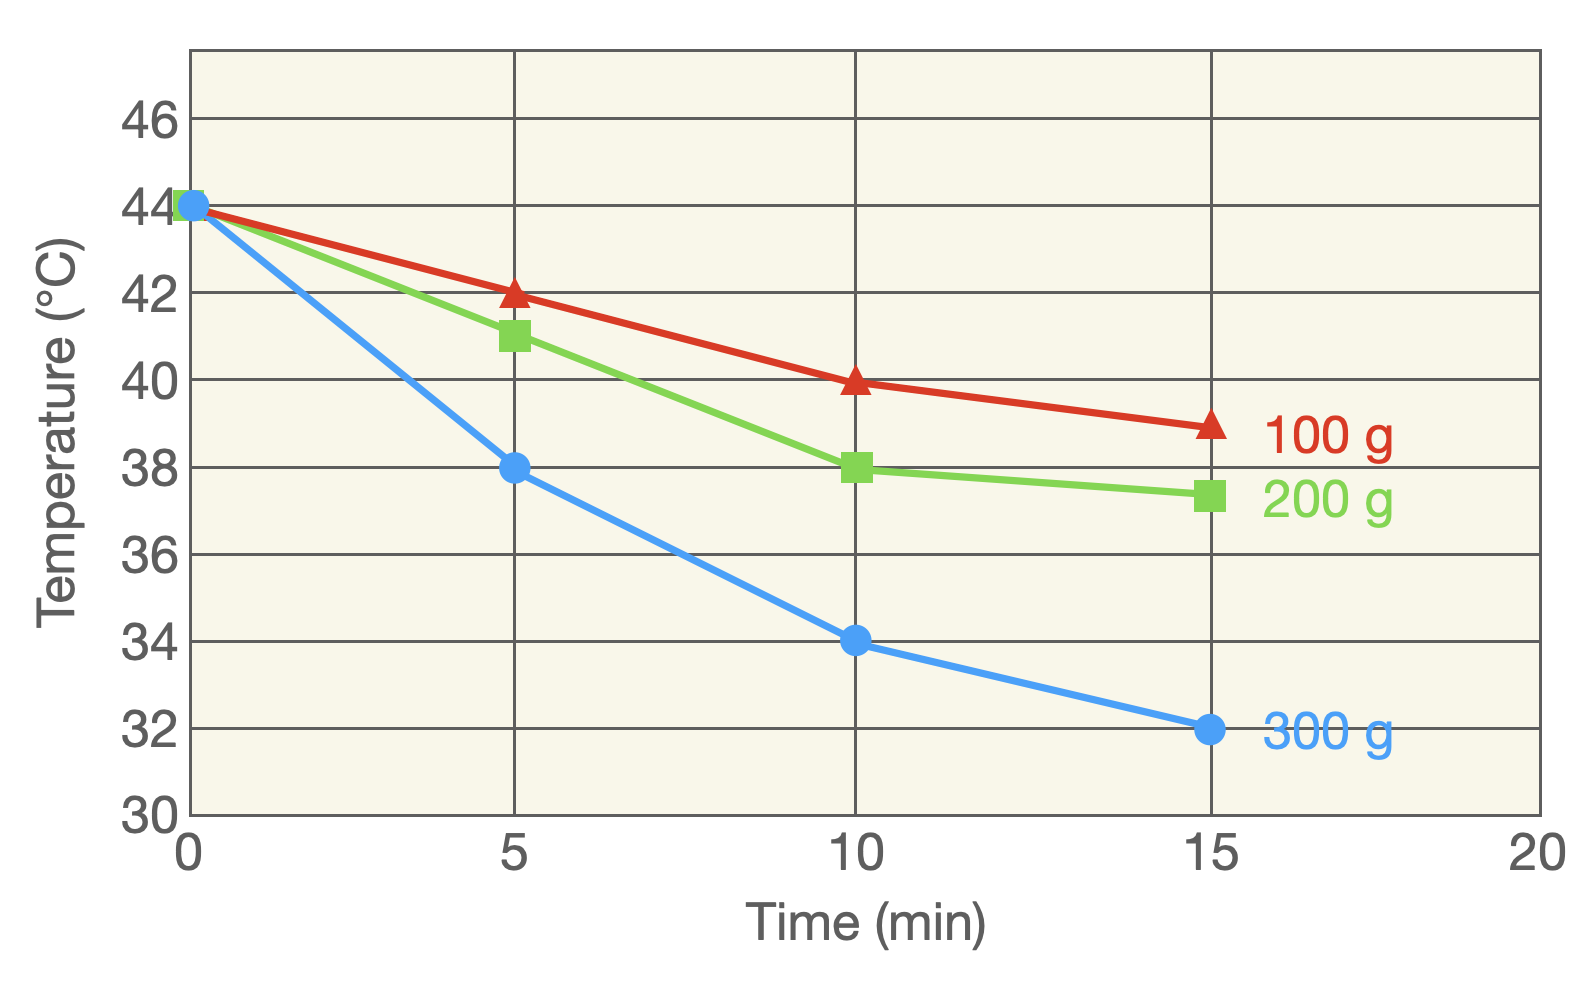
Below is a sample line graph. Students do not have this graph.
c. Provide 10 to 15 minutes for students to complete their graphs. Students should record their graph in Problem 3 of their Student Data Records.
______________________________________________
SLIDE VHEAT5-post-5
d. Direct students to study their graphs.
Ask students: Let’s look at the information your graphs provide. What conclusions can you draw about the effect of mass on the rate of heat transfer? As mass decreases, the temperature decreased more rapidly. The line for the 100 g sample of water drops lower than the lines for the 200 g and 300 g samples.
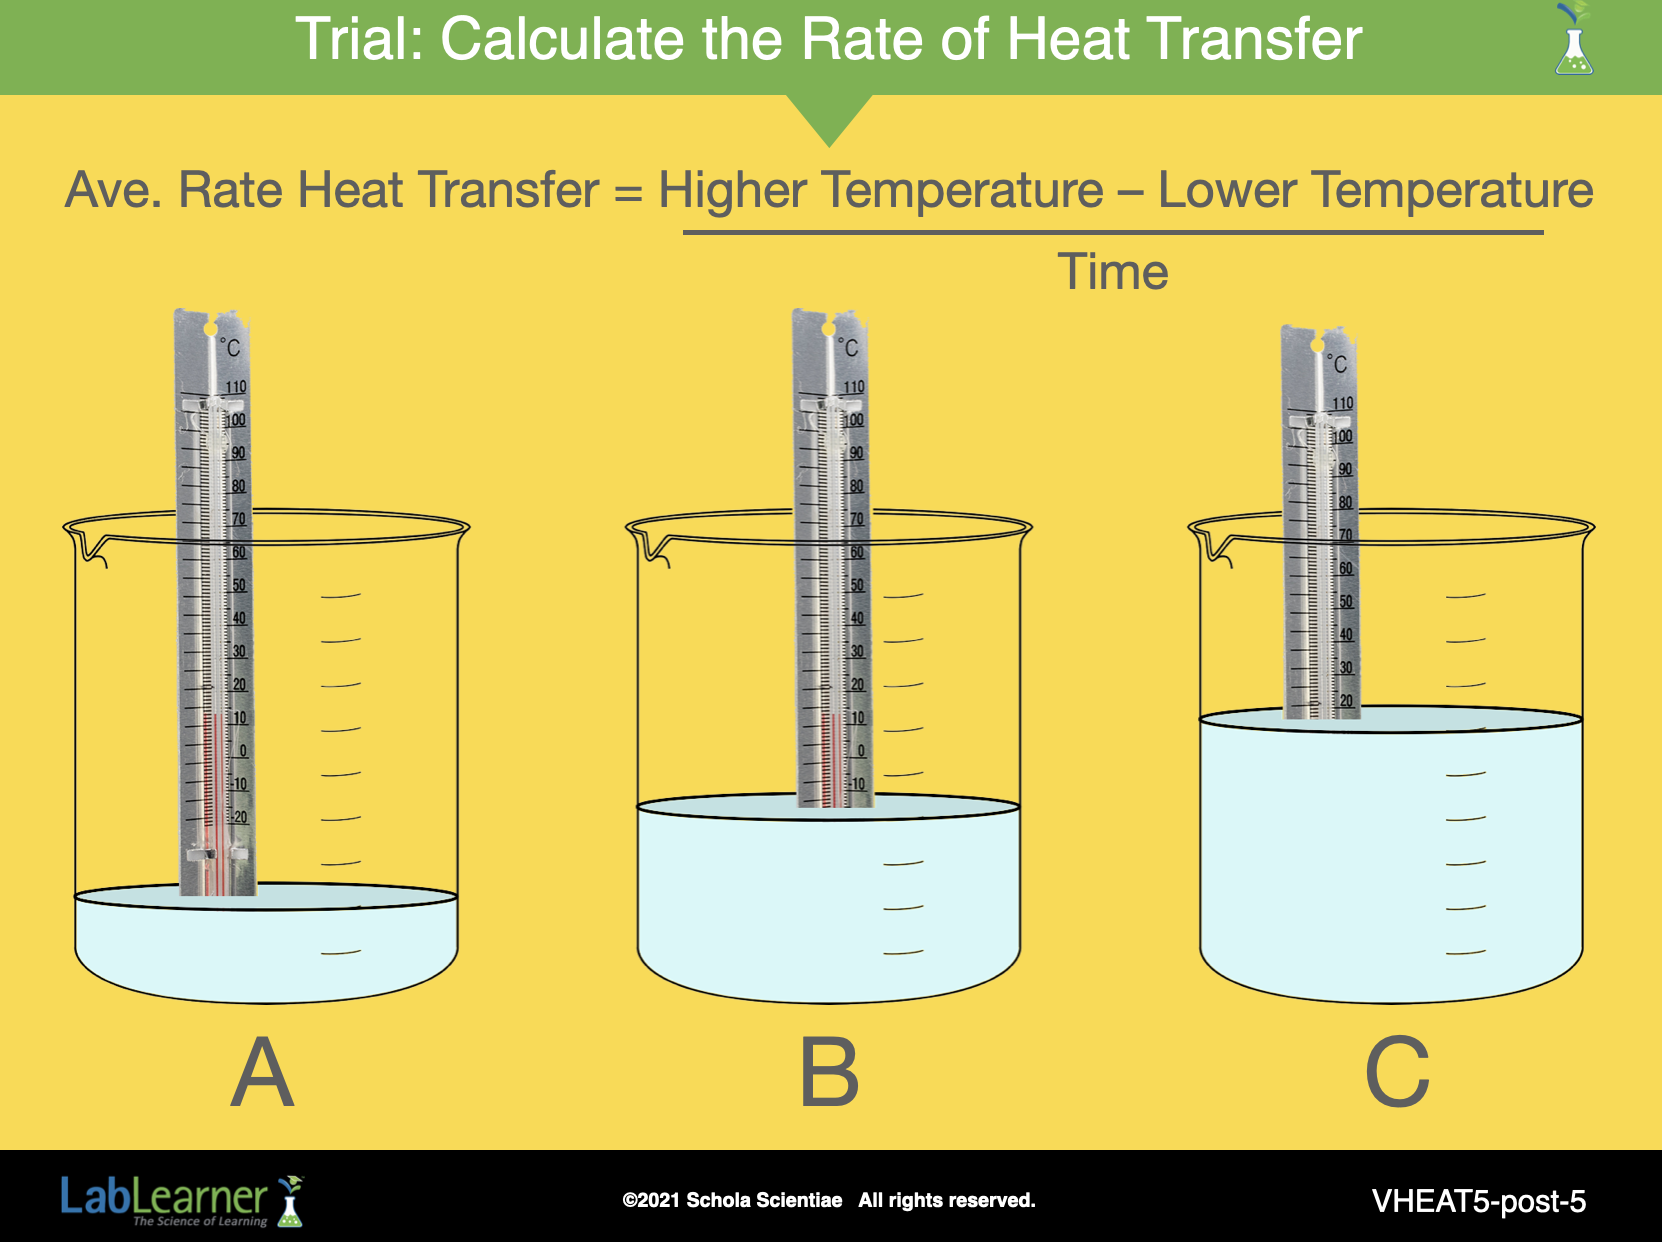
e. Ask students: What else could you do to confirm your answer? Students should indicate that they could calculate the rate of heat transfer.
Direct students to calculate the rates of heat transfer for the three samples and record them in Problem 4 of their Student Data Record.
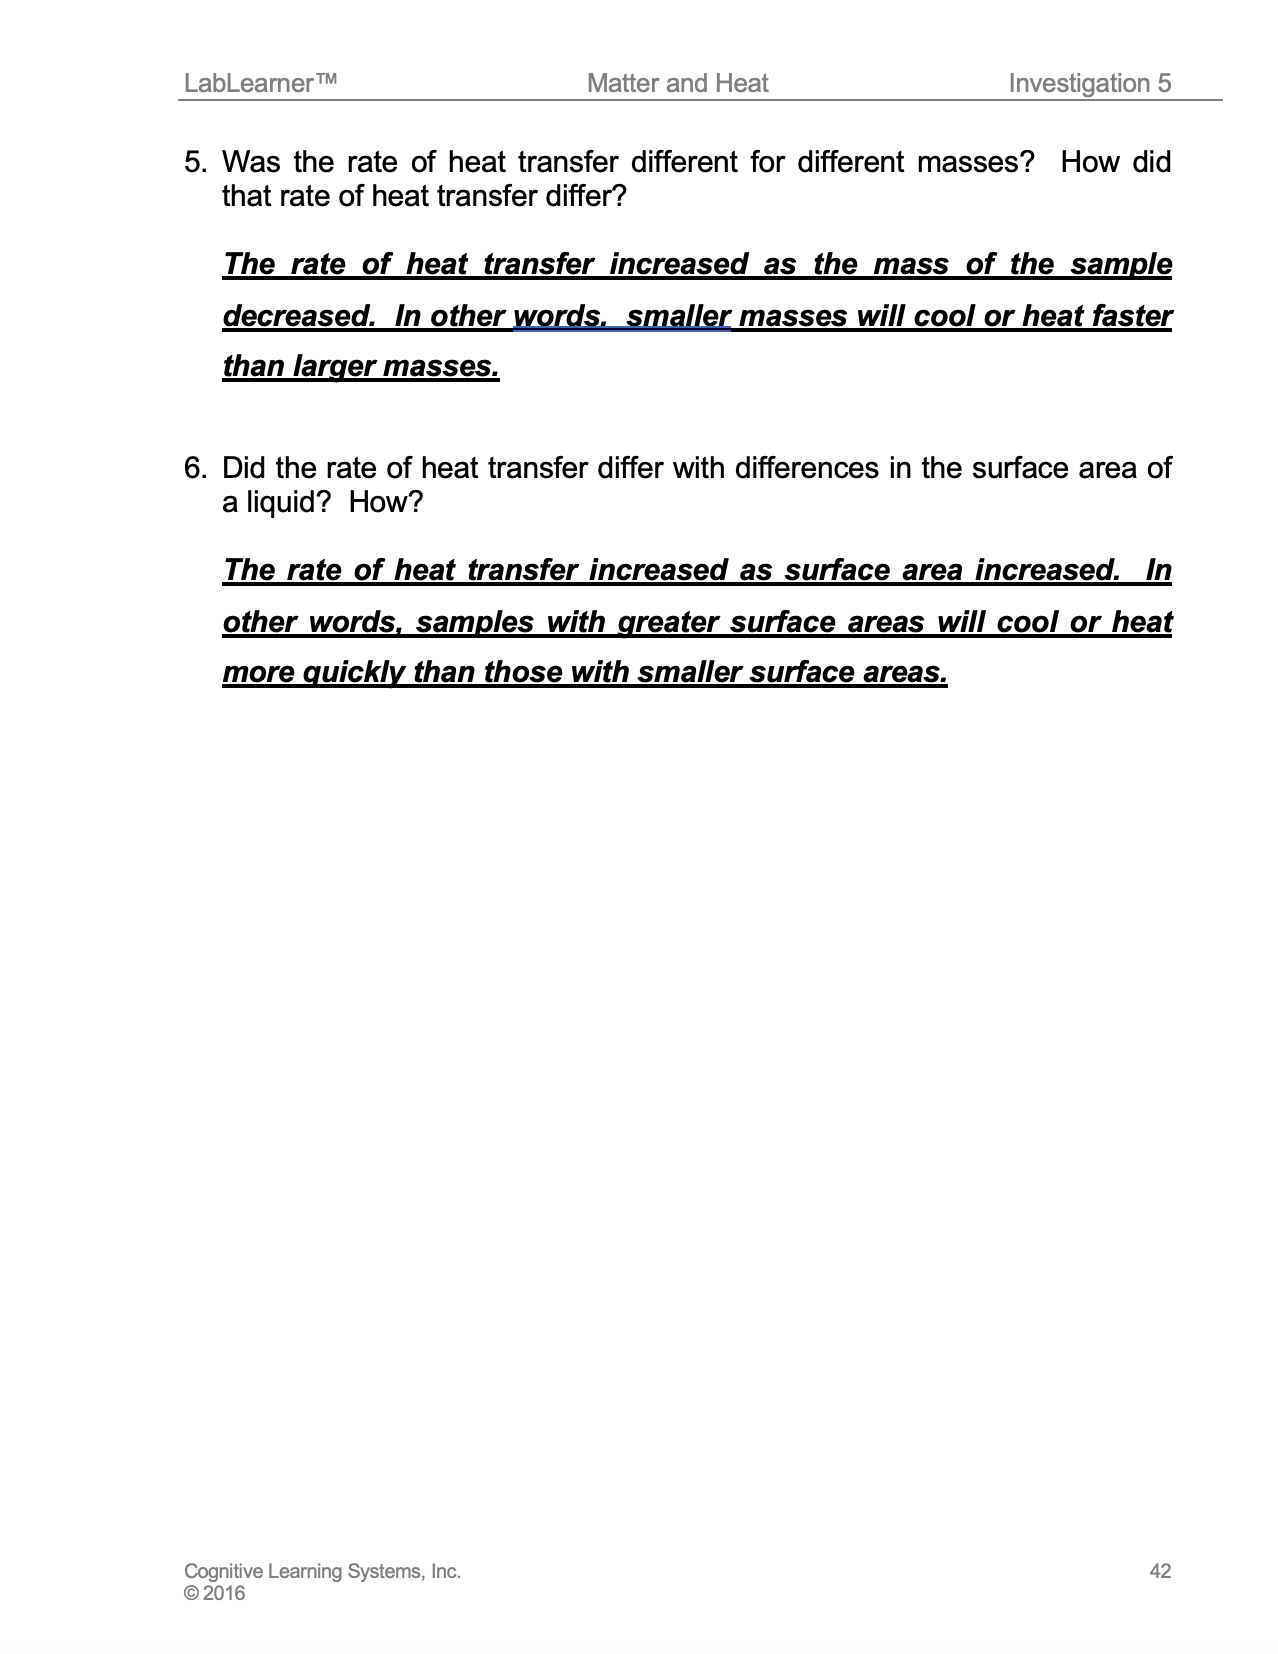
f. Ask students: How did the rates of heat transfer differ between the three samples? Why do you think there was a difference in heat transfer for different masses of water? Student answers may vary. The rate of heat transfer decreased as mass increased. This is demonstrated by comparing the three rates of heat transfer. The rate of heat transfer was lowest for the 300 g sample and highest for the 100 g sample. Mass is a factor in heat transfer because the size of a sample determines how rapidly heat moves from the center of the sample to an area where heat transfer can occur. As the mass of the water increased, the rate of heat transfer for the samples decreased.
7. Ask students: Based on your results, which do you think would stay warmer longer, a full cup of hot chocolate, or the same size cup with half as much hot chocolate? Why? Student answers may vary. The full cup of hot chocolate will stay warmer longer because the mass of hot chocolate is greater than the mass of the hot chocolate in the cup that is half-full.
8. Ask students: If you had one cup of cold soda on a hot summer day with half as much soda as a second cup, would one stay colder longer than the other? Why? The larger mass of soda would stay colder longer than the smaller mass because as mass increases, the rate of heat transfer decreases. Thus, the larger mass of soda would absorb heat at a slower rate than the smaller mass of soda.
______________________________________________
SLIDE VHEAT5-post-6
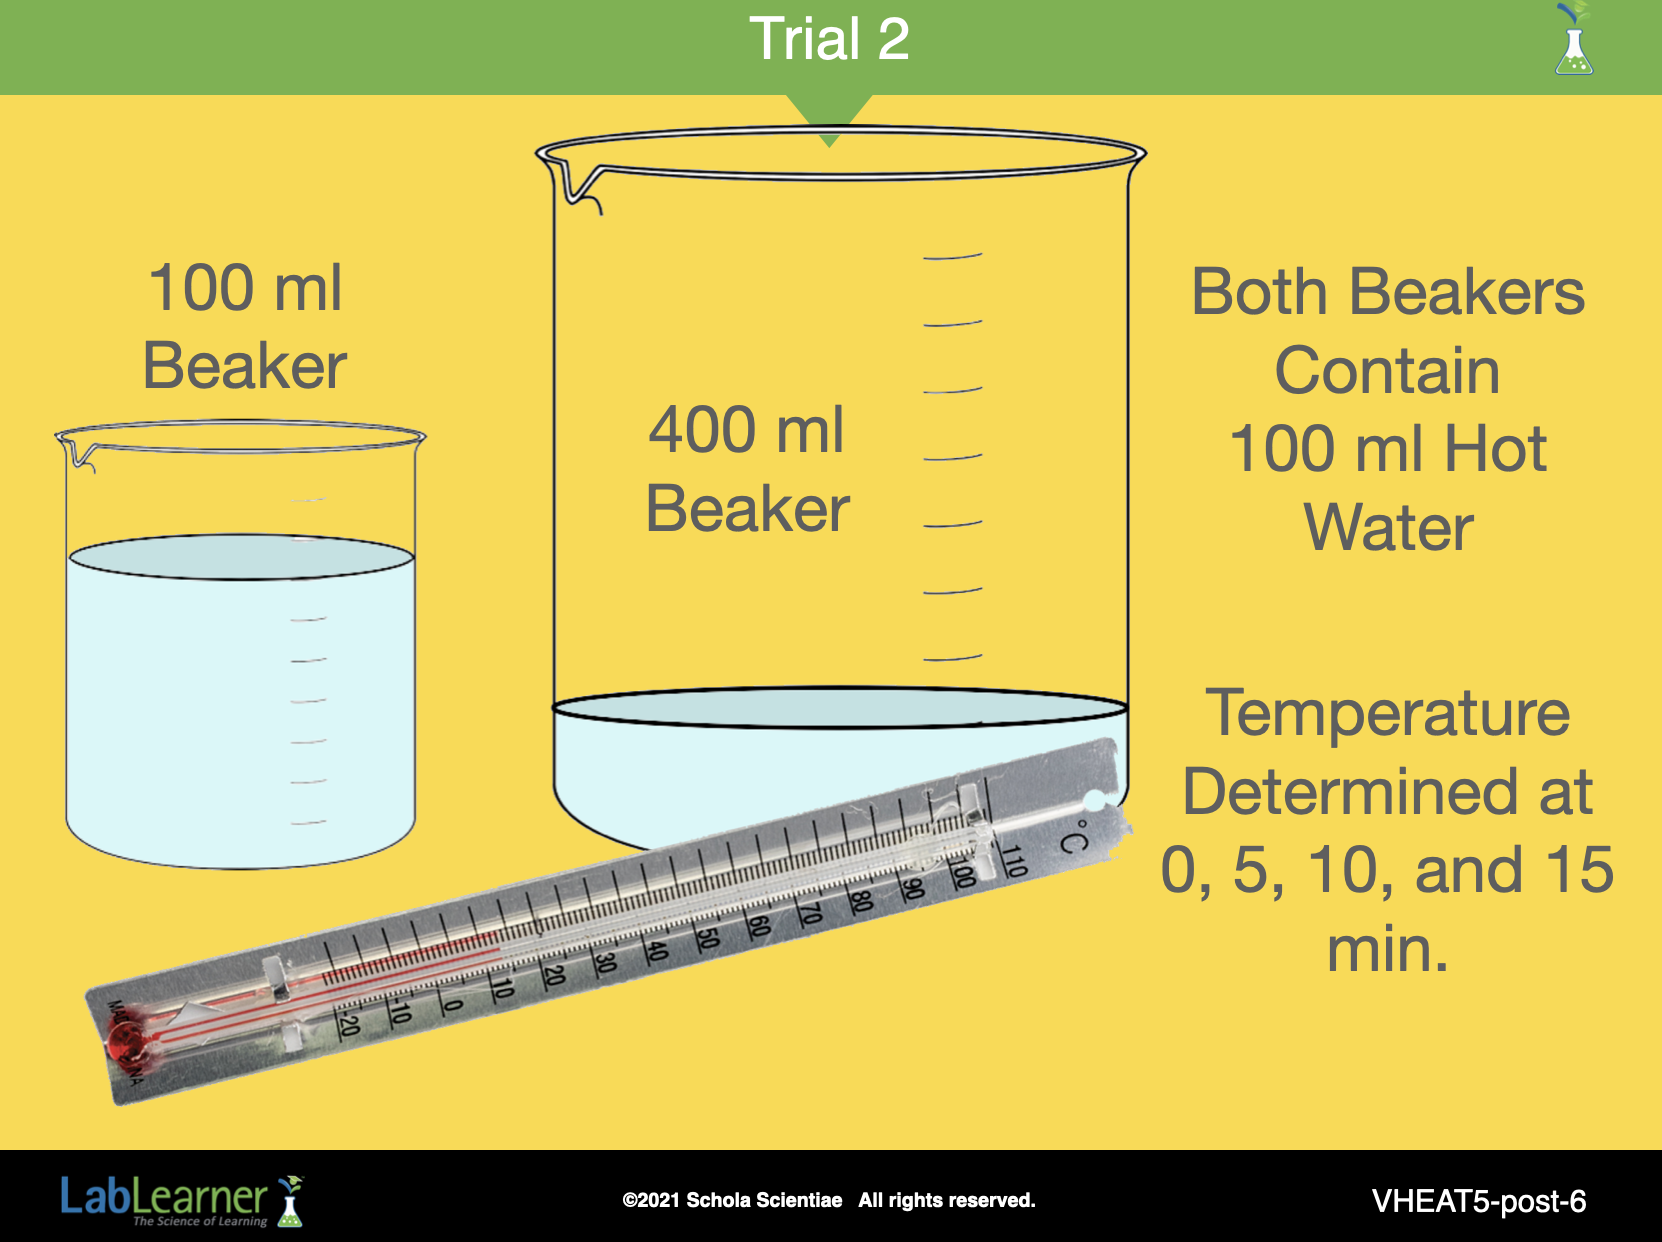
C. Continue the analysis by asking the following questions about the results of Trial 2.
1. In Trial 2, the two beakers had different surface areas.
Ask students: Which one had the greater surface area? Why? The 400 ml beaker had a greater surface area because it had a larger diameter and was taller than the 100 ml beaker.
2. Ask students: What was the rate of heat transfer for each beaker? Student answers will vary based on their results. However, regardless of the individual group values students should indicate that the rate of heat transfer for the 400 ml beaker was greater than the rate of heat transfer for the 100 ml beaker.
3. Ask students: What conclusion can you draw about the surface area of liquid in contact with air and the rate of heat transfer? The rate of heat transfer increased as surface area increased. The water in the 400 ml beaker transferred heat to its surroundings more quickly than the water in the 100 ml beaker.
a. Ask students: Why do you think this happened? Student answers may vary. The rate of heat transfer increased when the size of the container increased because a greater amount of water was in contact with the air.
b. Ask students: If the surface area had not already been provided for you in your Scientist Data Record, how could you determine if the surface area of the water in contact with air in the 400 ml beaker is greater than the surface area in the 100 ml beaker? Student answers may vary. Some students may suggest that they can tell by the difference in beaker capacity or the volume of water each beaker can hold. This is not necessarily true. For example, a 100 ml beaker and a 100 ml graduated cylinder both have the same capacity but the 100 ml graduated cylinder will have a total surface area of 160 cm2, compared to a surface area of 121 cm2 for the 100 ml beaker. The water in the beaker forms a cylinder. Students should recall from the PreLab discussion that surface area of a cylinder is determined by its radius (which equals one-half the diameter) and its height. Students should indicate that the diameter of the water surface and the height of the water would need to be measured for surface area to be determined. Students should note that in their experiment, the surface area was greater for the water in the 400 ml beaker than for the water in the 100 ml beaker because both the radius and the height of the 400 ml beaker was greater than the radius and height of the 100 ml beaker.
4. Direct students to answer Problems 5 and 6 in their Student Data Record.
______________________________________________
SLIDE VHEAT5-post-7
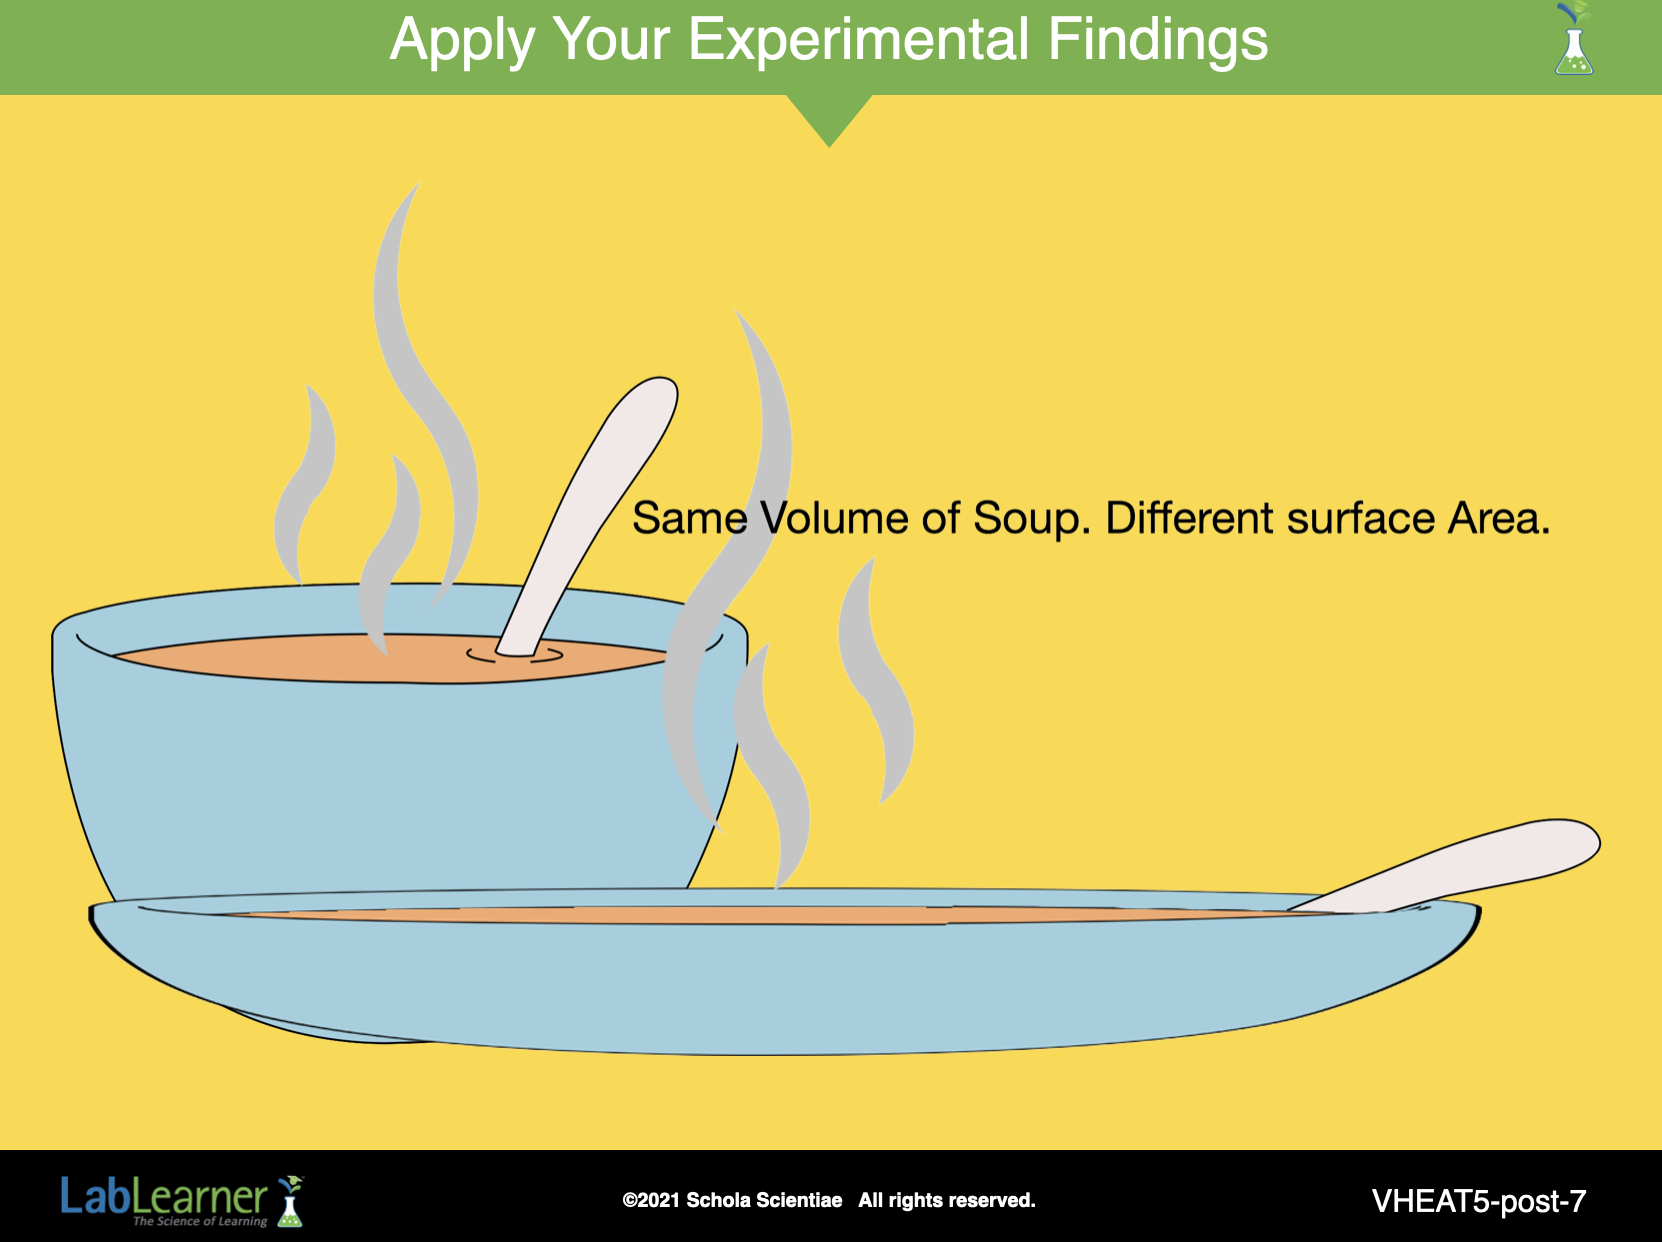
D. Remind students of the soup example from Pre-Lab. Pose the following questions to connect the soup example to the students’ Lab results.
1. Remind students that the first method that could be used to cool the soup was to change the serving size by filling the bowl halfway, and then having a second serving.
Ask students: What effect would decreasing the serving size have on the rate of heat transfer? Why? Would that make the soup cool more quickly than if the bowl were full? Students should indicate that decreasing the serving size is similar to a decrease in the volume of water in the three beakers of Trial 1. Students found that as the volume decreased, the mass decreased, and as the volume increased the mass increased. Students should also indicate that as the mass of the water in Trial 1 increased, the average rate of heat transfer decreased. Therefore, they should suggest that decreasing the serving size would increase the rate of heat transfer because it would decrease the mass of the serving, causing the soup to cool more quickly.
2. Remind students that the second method that could be used to cool the soup was to keep the original serving size, but increase the size of the bowl.
Ask students: What effect would putting the soup in a larger bowl have on the rate of heat transfer? Why? Would that make the soup cool more quickly than in the original bowl? Students should indicate that placing the soup in a larger bowl is similar to their experiments in Trial 2 in which water was the same volume in both the large and small beaker. Students found that the larger beaker had a larger surface area and a greater average rate of heat transfer. Therefore, they should suggest that putting the soup in a bigger bowl would increase the rate of heat transfer by increasing the surface area of the soup, causing the soup to cool more quickly.
KEYS: LAB/POSTLAB