Teacher Portal:
Earth and Space Journey
Four: Earth and Human Activity
 PRINT IT
Use your browser to download a printable PDF as help during the slide presentation and to make additional notes. In your browser, go to File > Print and then choose to save as PDF.
NAVIGATE IT
Once the slide presentation is launched
- use your left and right arrows to advance or go back in the slide presentation, and
- hover your mouse over the left edge of the presentation to get a view of the thumbnails for all the slides so that you can quickly move anywhere in the presentation.
- Click HERE to launch the slide presentation for the CELL.
SHARE IT
SLIDE 4VES-1
______________________________________________
SLIDE 4VES-2
Teacher’s Notes
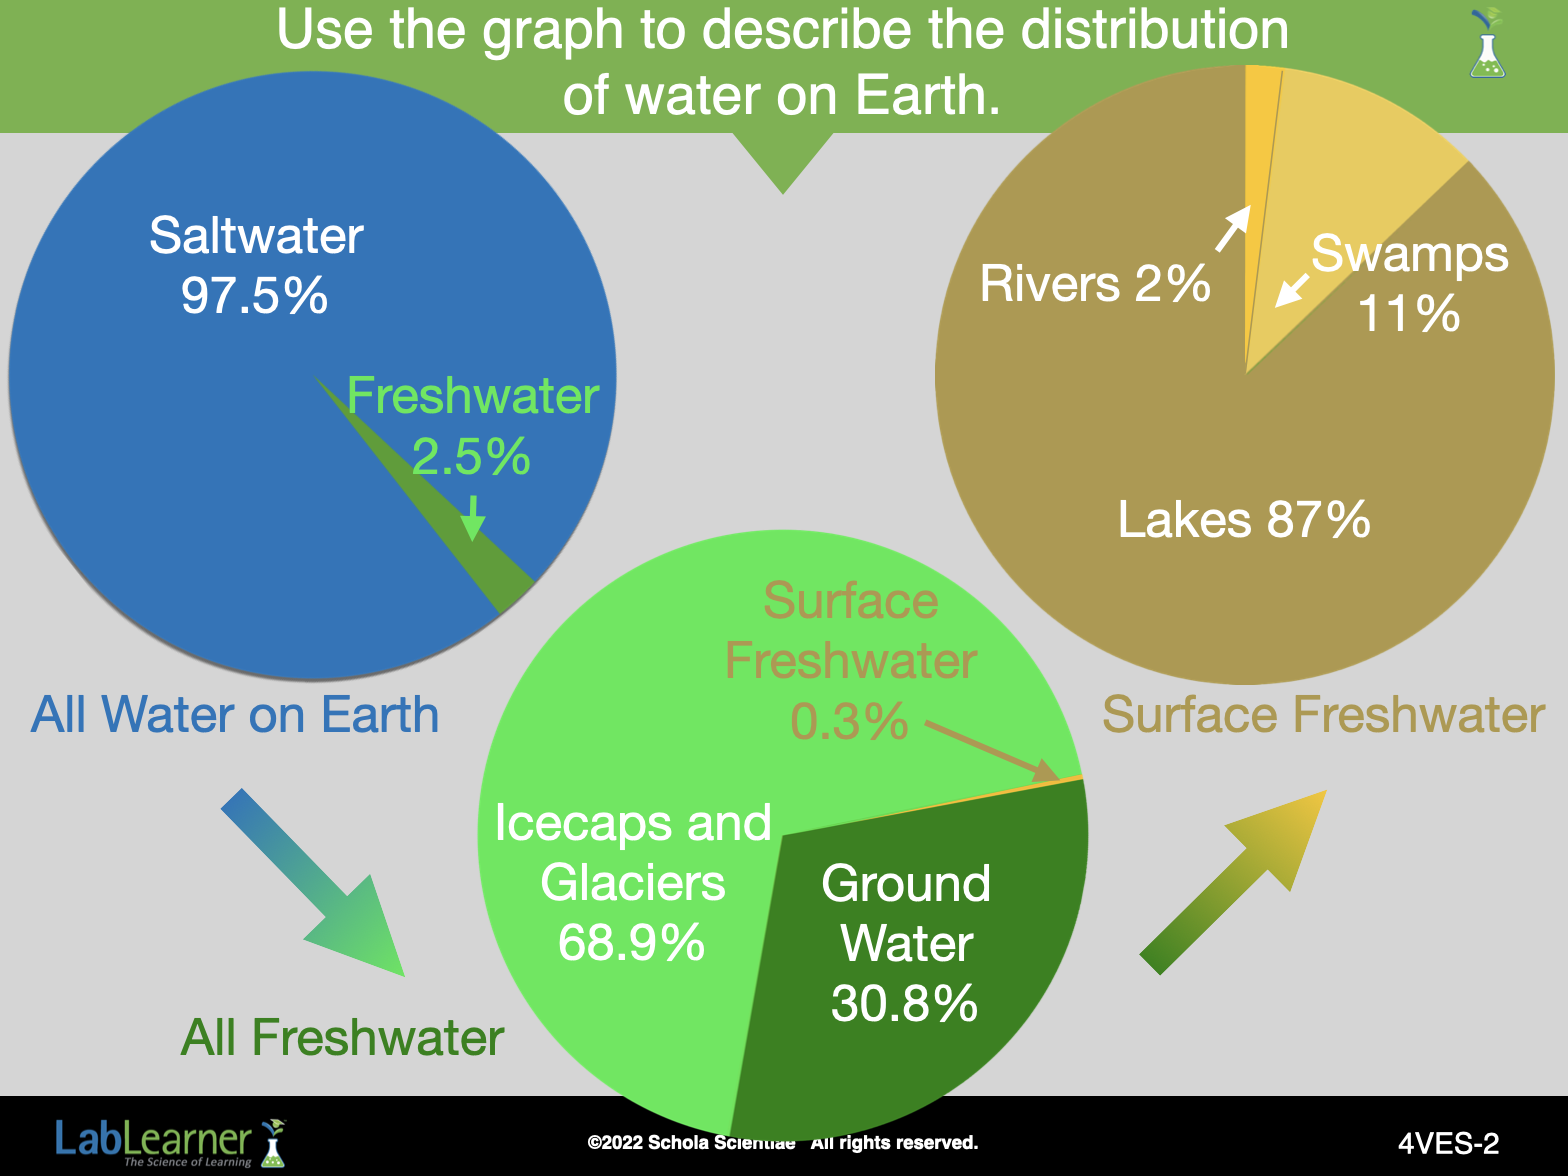
All Water on Earth: The first pie chart (upper left) shows that 97.5% of Earth’s water is found in oceans. Only 2.5% of Earth’s water is freshwater – the amount needed for life to survive.
All Freshwater on Earth: The middle pie chart shows the breakdown of the freshwater on Earth. Almost all of it is locked up in ice and in the ground (68.1% and 30.1% respectively). Only a tiny fraction of all freshwater is surface water (0.3%), which serves most of life’s needs.
The surface water breakdown is shown in the right-hand pie chart. About 87% of surface freshwater is found in lakes, 11% in swamps, and 2% in rivers.
______________________________________________
SLIDE 4VES-3
Teacher’s Notes
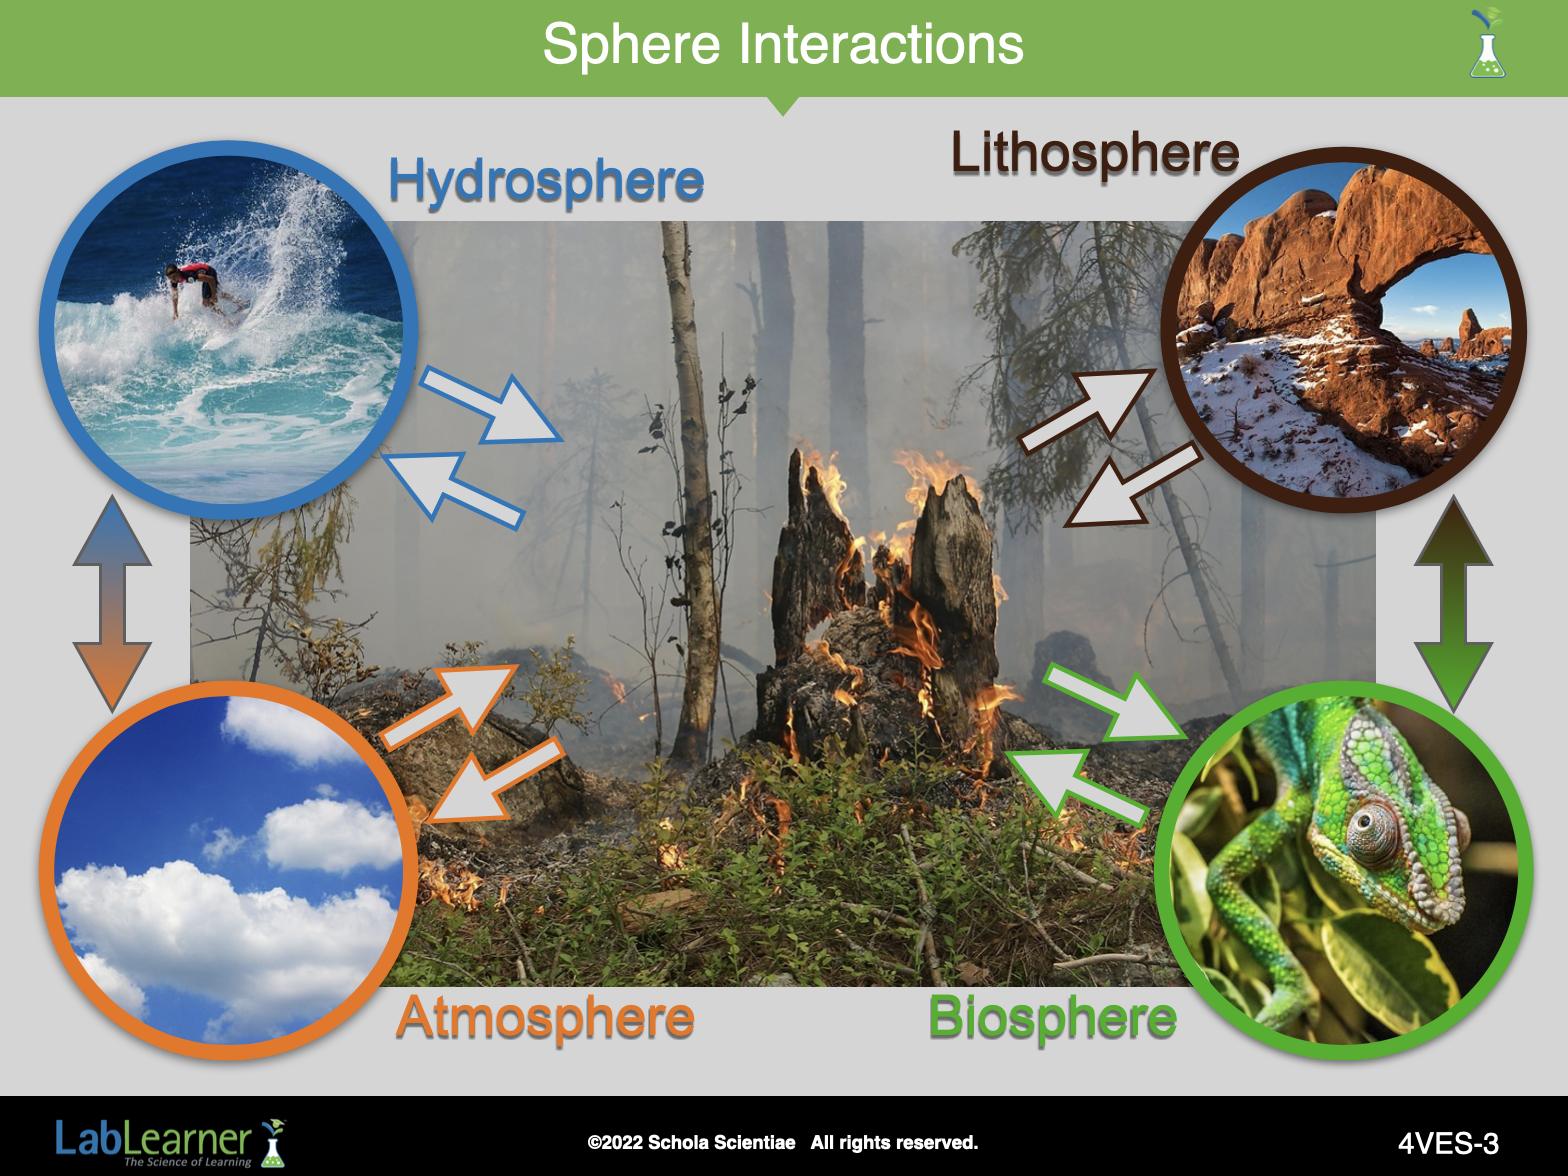
Explain to students that scientists sometimes refer to changes as events.
Events can occur naturally, such as an earthquake or a hurricane, or they can be caused by humans, such as air pollution or forest fire.
Note: Forest Fires are also caused naturally – by lightning and spontaneous combustion of dry fuel.
- An event can cause changes to occur in one or more of Earth’s spheres, and/or an event can be the effect of changes in one or more of Earth’s spheres. This two-way cause and effect relationship between an event and a sphere is called an interaction.
Note: The cryosphere is a subcomponent of the hydrosphere, thus Earth has four main spheres, as shown in the image.
Challenge students, “What caused the event in this image?”
Note: Accept all scientifically valid responses. Suggested responses are below.
- Humans’ carelessness may have started the forest fire.
- Lightning (or spontaneous combustion of dry fuel) may have started the forest fire.
Challenge students again, “What effect will this event have on Earth’s spheres?”
Note: Accept all scientifically valid responses. Suggested responses for event-sphere interactions are below.
- Plants and animals within the biosphere may be displaced or killed.
- Smoke and other gaseous pollutants may be carried into the atmosphere by the wind.
- The heat from the fire may remove moisture from the hydrosphere (air, soil, and plants) through the process of evaporation.
- Intense heat from the fires may cause some rocks in the lithosphere to break apart.
- A decrease in plants within the biosphere may result in increased soil erosion within the lithosphere because there were fewer roots to hold the soil in place.
- There may be more precipitation in neighboring areas because ash particles in the atmosphere may become platforms for condensation to form around.
Note: These are just a few examples of cause-effect sphere interactions that may occur. There are many other possibilities.
- Remind students that forest fires are just one type of event. There are an endless number of naturally occurring and human-driven events occurring at any given time within the Earth System.
Note: A shortlist of events that influence multiple spheres includes: acid rain, deforestation, droughts, flooding, tornados, ozone depletion, oil spills, tsunamis, gas fracking, and strip mining.
- Most often, when Earth is knocked off balance by an event, such as a forest fire, it begins to renew itself. The process of adapting to the impact of the event may take hundreds or even thousands of years, but for a 4.75 billion-year-old planet, that is just a snapshot in time. Throughout Earth’s history, the event-renewal process has taken place countless times and will continue to unfold as long as Earth’s spheres can stay in sync.
______________________________________________

SLIDE 4VES-4
Teacher’s Notes
Students likely understand that each year is characterized by seasons, each with its own particular properties, holidays, and vacations. However, they may not have considered how the Earth’s systems are affected by seasonal climate change.
The animation below provides a vivid picture of the response of vegetation and ice and snow cover that occurs in an unending annual cycle.
Interesting points to highlight about this graphic include:
- notice the annual expansion and shrinking of ice and snow cover.
- notices that while ice/snow cover increases at the northern pole, it shrinks at the southern pole.
- Focusing on the continents, notice the annual increase in vegetation (dark green versus pale green or tan).
- notice how this burst of green vegetation is exactly the opposite in the northern versus the southern hemisphere.
- Notice that the ocean plants also exhibit annual cycles of increases and decreases in photosynthesis and growth.
When analyzed in time-lapse as shown in this graphic, one can almost detect the entire Earth “breathing” in rhythm with the cyclic heating and cooling of our planet.
When considering all of the related environmental factors involved in plant growth (hours of sunlight per day, nutrient availability, rainfall and water supply, insect pollination, daily temperature fluctuations, etc.) this graphic nicely illustrates the beautiful balance in the natural world.
This balance is the result of hundreds of millions of years of repeated cycles of the Earth’s systems, with the entire planet responding almost as if it is a single giant organism.
______________________________________________
SLIDE 4VES-5
Teacher’s Notes
Ask students to recall the following concepts introduced early in this Journey:
- Big Bang Theory: All matter in the universe was created in the Big Bang and has simply been recycled for 15 billion years.
- Law of Conservation of Matter: Matter can neither be created nor destroyed, simply transformed.
- Law of Conservation of Energy (if introduced): Energy can neither be created nor destroyed, simply transformed.
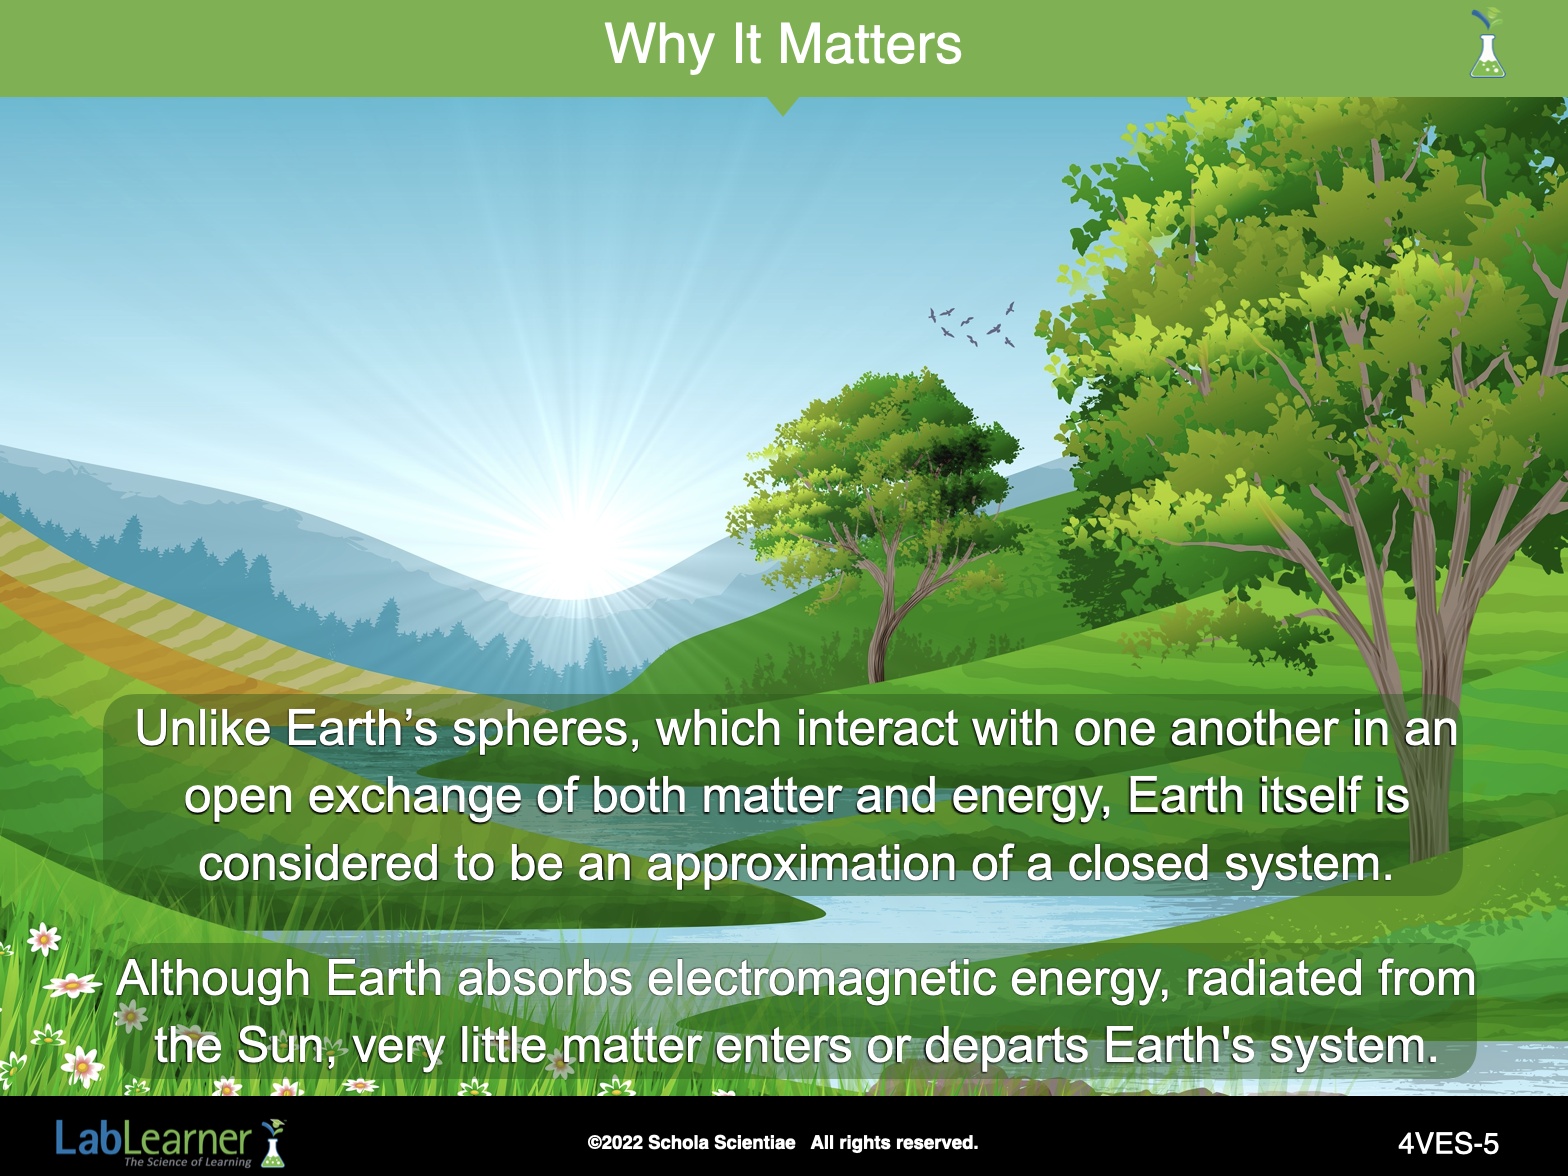
Explain to students that matter created in the Big Bang was used to create matter on Earth. Because Earth is considered to be an approximation of a closed system, matter on Earth has simply been recycled throughout Earth’s existence in ways governed by the laws of conservation (matter cannot be created or destroyed, but can change forms).
Note: Some matter does pass from space into the atmosphere and vice versa. The planet loses traces of hydrogen in the extremities of its upper atmosphere, while meteorites and other forms of matter from space may reach Earth’s surface.
The matter (and energy) being recycled on Earth falls into two categories – renewable and nonrenewable.
A renewable resource is naturally replenished by Earth at a rate roughly equal to the rate at which humans consume it. Living things (fish and trees, for example) are considered renewable because they can reproduce to replace individuals lost to human consumption. With careful management and responsible usage, water is also a renewable resource.
A nonrenewable resource is not regenerated or restored on a time scale comparative to its consumption. Non-renewable resources exist in fixed amounts (at least relative to our time frame), and can be used up. Fossil fuels such as oil, coal, and natural gas, take millions of years to form and are classic examples of non-renewable resources.
Remind students that all the things we need to survive, such as food, water, air, and shelter, come from natural resources that are recycled within the Earth System. If used wisely and efficiently, resources will last for generations to come. If resources are carelessly managed, however, many will be used up, and the effects will be felt throughout the Earth System.
______________________________________________
SLIDE 4VES-6
Teacher’s Notes
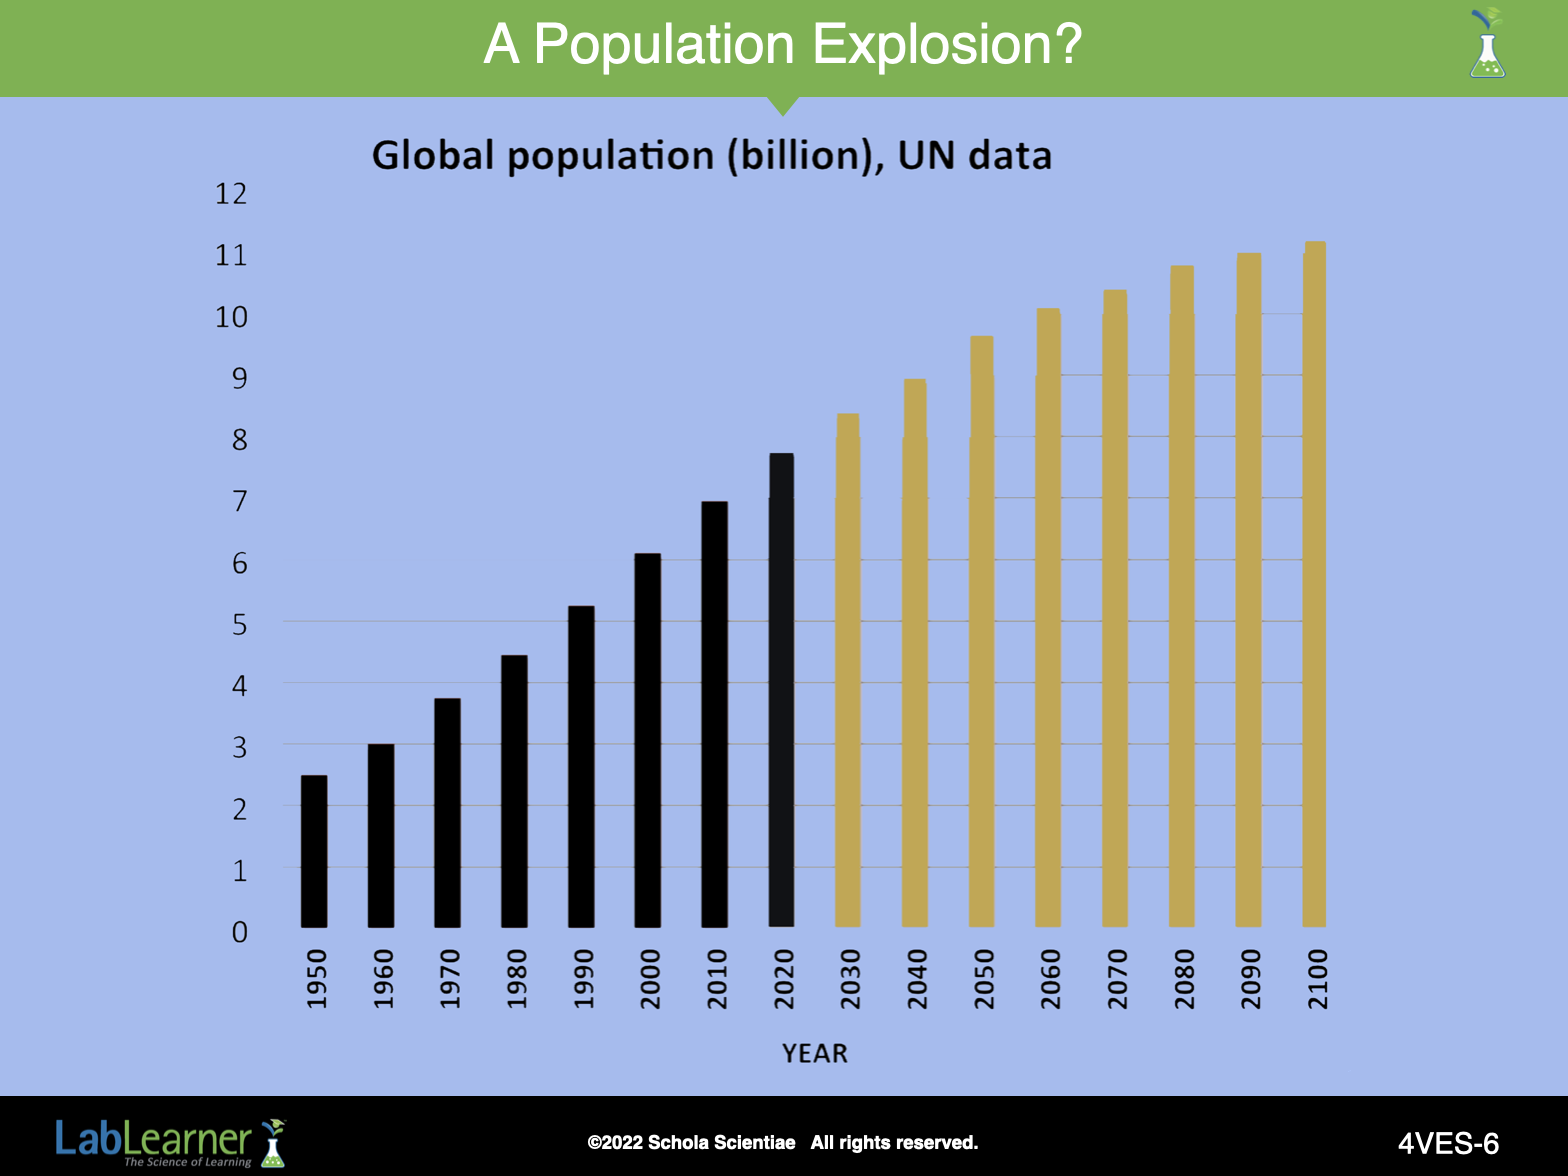
Explain to students that Earth’s renewal system is powerful, but the ability of humans to actively manipulate the environment is stretching the spheres to their limits – and occasionally beyond. This is becoming an ever-increasing concern as the human population continues to grow.
To put things in perspective, travel back in time over 2000 years. At this time, the population of the Earth contained approximately 200 million people. A thousand years later, the world’s population had increased by only 110 million people. Back then, it took a thousand years for the population to grow by 110 million people. Now, it takes just over one year to grow the same amount.
As the graph depicts, there are currently 7 billion humans inhabiting the planet, a substantial difference from the 200 million not so long ago. This vast increase in population is changing the way we use resources like animals for food, timber, and even fossil fuels. In turn, the rapid rise in consumption is placing new-found pressures on the entire Earth System.
______________________________________________
SLIDE 4VES-7
Teacher’s Notes
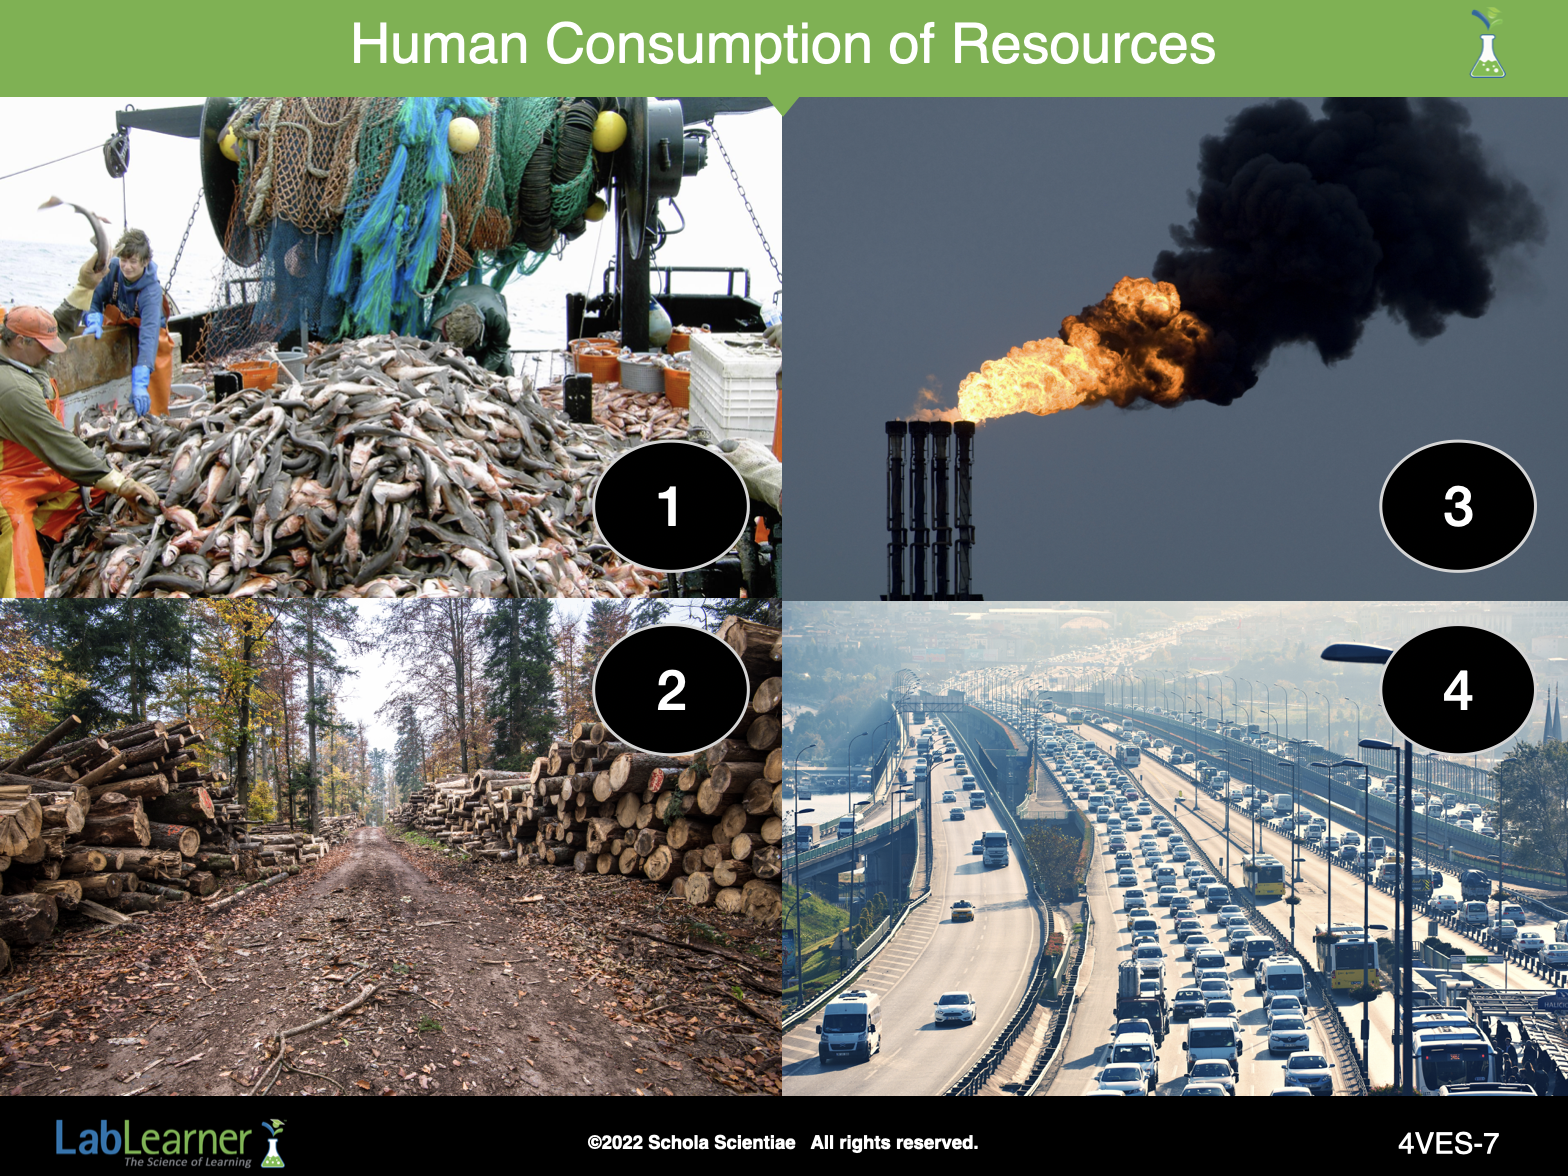
Explain to students that our population of 7 billion, along with the estimated 30 to 100 million other species, depends on the resources within Earth’s spheres for survival. Unfortunately, in our pursuit and consumption of these resources, we are leaving behind a path of destruction and waste, placing Earth’s resources and health at risk.
Images 1 and 2
Living things such as fish and trees are considered renewable resources because they can reproduce to replace individuals lost to human consumption, but this is true only up to a point.
Overfishing occurs when more fish are caught than the population can replace through natural reproduction. Likewise, over-harvesting of trees occurs when forests are cut down faster than they can regrow. Gathering as many resources as possible may seem like a profitable practice, but overfishing and over-harvesting have serious consequences. The results can lead to (but are not limited to) the extinction of species, the disruption of food webs, and the destruction of the natural habitats of many species.
Images 3 and 4
Fossil fuels — oil, coal, and natural gas — supply our energy needs, but their production and use have significant impacts.
When we extract oil, coal, and natural gas from the Earth’s crust and then burn these fossil fuels for transportation and industry, we are putting more carbon into the atmosphere than is being removed naturally through the carbon cycle, ultimately causing atmospheric carbon dioxide concentrations to increase.
Elevated levels of atmospheric carbon dioxide, along with other greenhouse gases, trap some of the Sun’s energy, leading to global climate change (change in weather patterns).
Note: Greenhouse gases include carbon dioxide, methane, nitrous oxide, water vapor, and fluorinated gases. These gases trap heat similar to the glass panels of a greenhouse, hence the name greenhouse gases.
Note: The United States is the second-largest contributor to carbon dioxide in our atmosphere, though it is home to just 4.4 percent of the world’s population. If everyone in the world lived the way people do in the U.S., it would take four Earths to provide enough resources for everyone!
Note: These events were chosen because they each have powerful impacts on the planet’s resources and future. In addition, they are human-driven events, which ultimately means that we have the power to lessen their negative effects by changing our behaviors.
______________________________________________
SLIDE 4VES-8
Teacher’s Notes
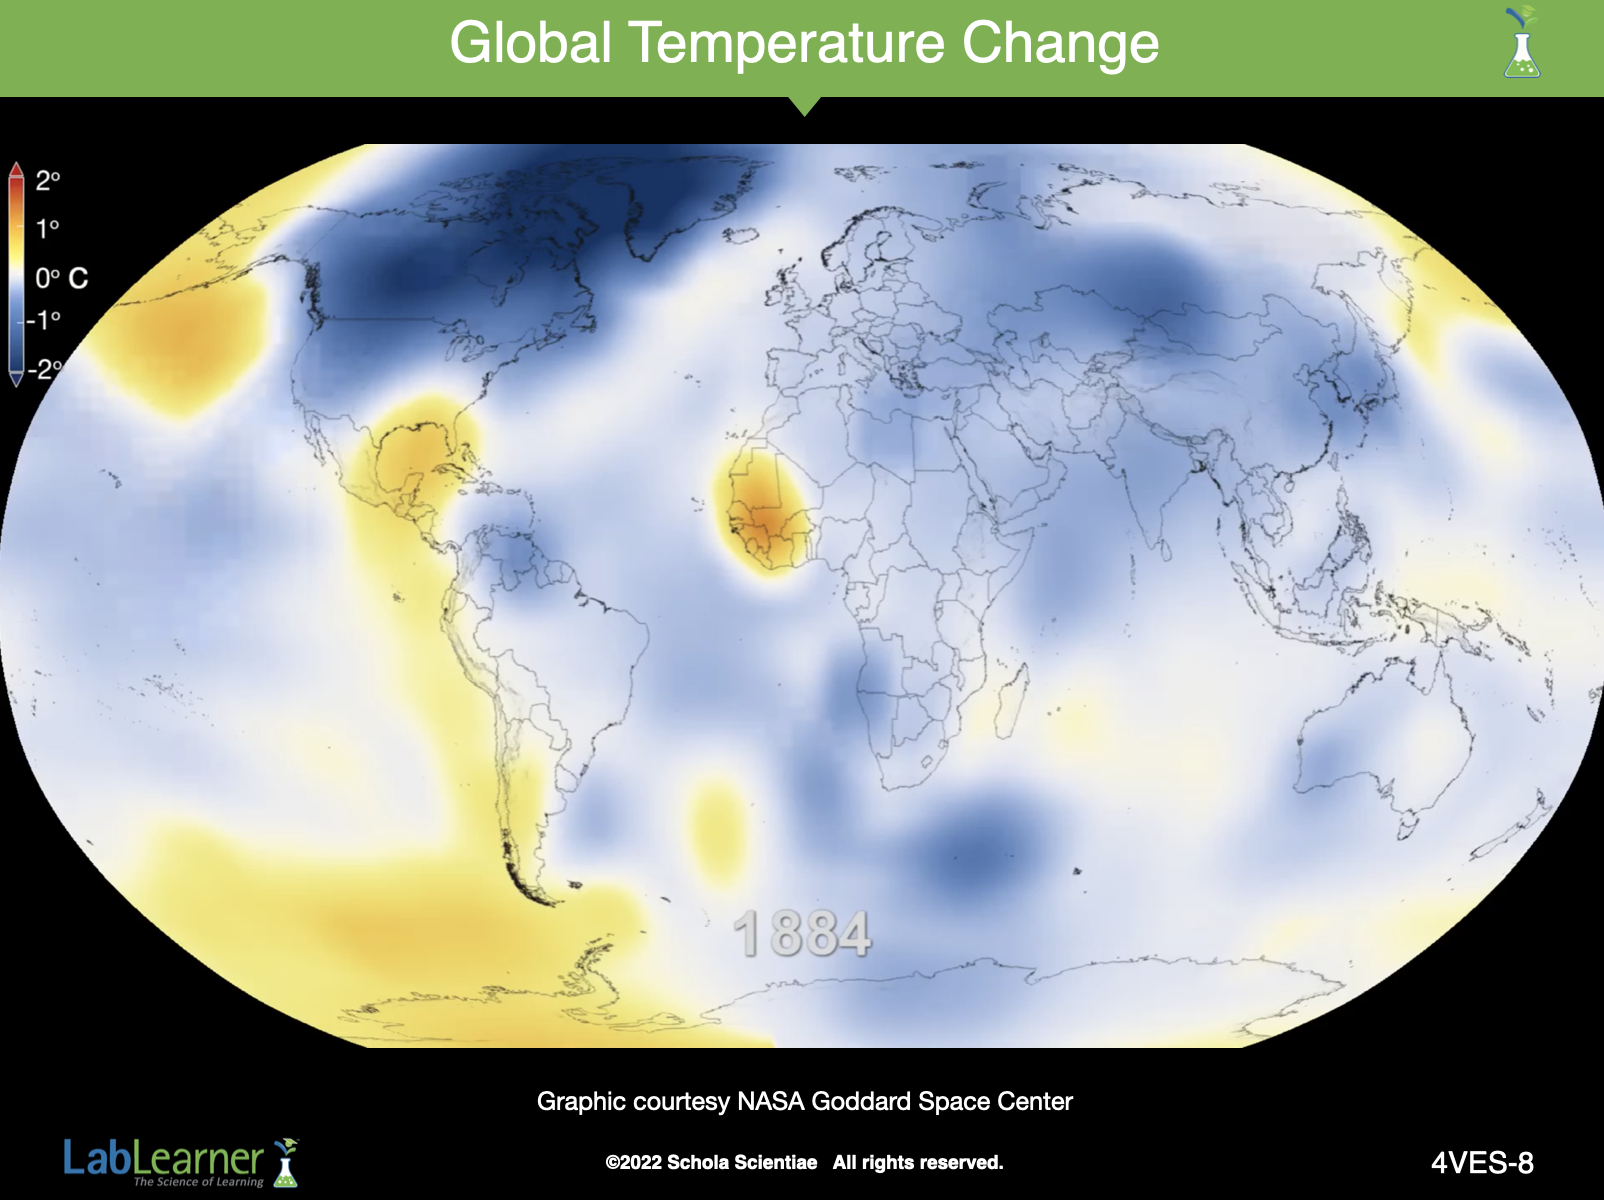
Explain to students that, throughout Earth’s history, the planet has gone through natural cooling and warming cycles. These cycles are signs that Earth’s ability to balance the amount of solar energy entering and exiting the Earth System varies over time.
- The color-coded map on this slide displays a progression of changing global surface temperatures from 1880 through 2013. Higher than normal temperatures are shown in orange and red and lower than normal temperatures are shown in blue. The full animation is shown below:

Ask students what they observed. Is Earth experiencing a cooling or warming cycle?
Note: Students should respond that the animation became progressively orange-red, depicting a warming cycle.
- Scientists agree that Earth is currently experiencing a warming cycle, but they are divided as to whether or not the increasing temperatures are due to natural warming mechanisms or humanity’s influence on greenhouse gases. It may, of course, be both. Further research and data collection will need to be gathered before a consensus among the scientific community prevails.
Ask students: Based on your scientific knowledge, do you feel global warming is natural or manmade? Why?
Note: Accept all reasonable, scientifically-based answers.
______________________________________________
SLIDE 4VES-9
Teacher’s Notes
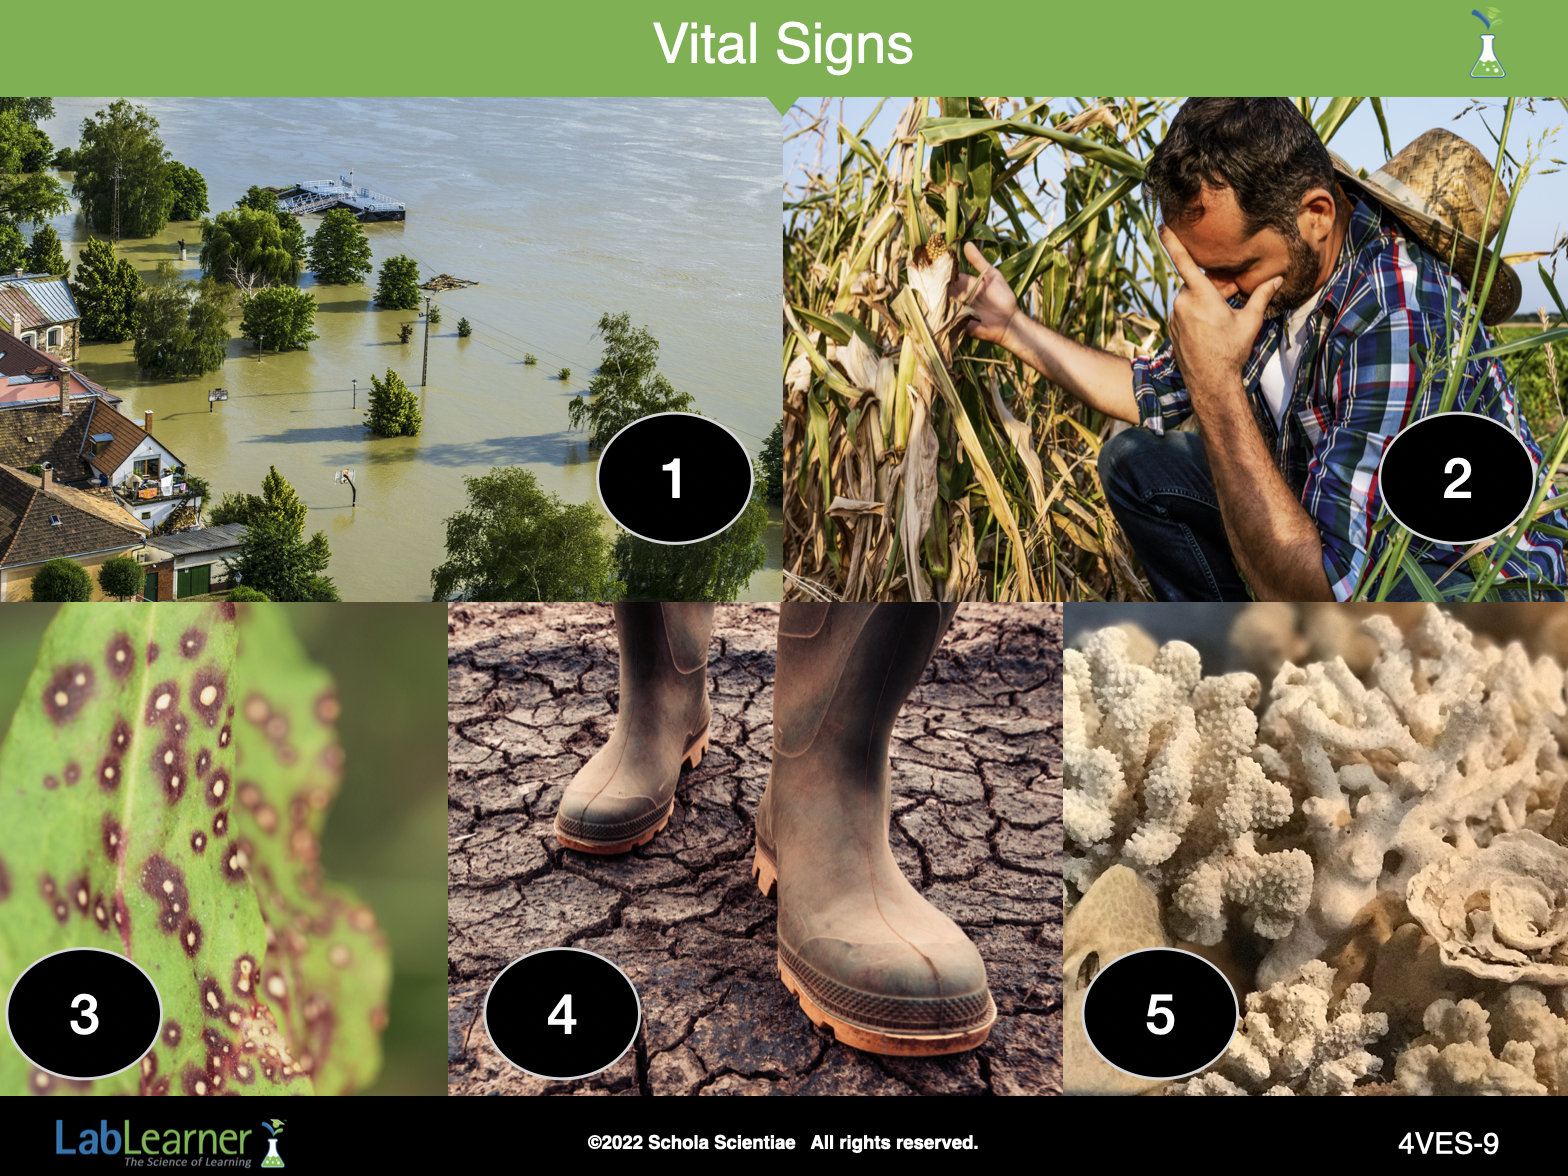
Explain to students that a one-degree global change is significant because it takes a vast amount of heat energy to warm all the oceans, atmosphere, and land by that much. In the past, a one-to-two-degree drop was all it took to plunge the Earth into the Little Ice Age, and a five-degree drop was enough to bury a large part of North America under a towering mass of ice.
Although global temperatures have only increased 0.55ºC over a 100 year span, the Earth System is already showing signs that is is struggling to adapt. The images on this slide convey some of the trends associated with those struggles.
Image 1 – Rising Sea Levels
Two major mechanisms are causing sea levels to rise. First, portions of the cryosphere, such as mountain glaciers and polar ice sheets, are melting, releasing water into the oceans. Second, as greenhouse gases direct heat back to Earth, oceans absorb the heat causing their temperatures to rise and their warmer water to expand. Trapped within a basin bounded by the continents, the water has nowhere to go but up.
Ecosystem Impact Examples:
- Rising sea levels are a threat to people who live near the ocean. Some low-lying areas will have more frequent flooding, and very low-lying land could be submerged completely. Saltwater may intrude into groundwater drinking supplies, contaminate irrigation supplies, or overrun agricultural fields.
- As sea levels rise, saltwater may mix into freshwater systems forcing some key species to relocate or die. This removes predators or prey that were critical in the existing food web.
- Rising water levels can also put fragile coral reefs in danger. Coral relies on sunlight, which could become scarce as water levels rise.
Image 2 – Failing Agricultural Output
Many regions are finding it more difficult to grow crops, raise animals, and catch fish in the same ways and same places as they have done in the past. The difficulties are due to extreme weather patterns, insect pests, diseases, and other climate change-induced stresses.
Ecosystem Impact Example:
- As the world seeks to feed over 7 billion people, climate change may create new food supply challenges such as famine and long-term food security.
Image 3 – Increase in Pests and Disease
Climate change poses a threat to the control of pest and disease invasions. Warming temperatures are allowing “pests and diseases” including insects, plant diseases, and invasive weeds to live in higher latitudes, invading previously uninhabitable areas. Additional climate factors that aid in pest and disease invasions are warmer winter minimum temperatures, changes in precipitation patterns, and water shortages.
Ecosystem Impact Examples:
- Without the severe winter cold which kills beetle larvae, pine bark beetle populations have exploded to unprecedented levels across the Western United States, killing billions of trees.
- Poison ivy is expected to become more “toxic” as a result of increased levels of CO2 in the atmosphere.
Image 4 – Extreme Weather Patterns
Global warming leads to climate change, which increases both the likelihood and intensity of extreme weather events, which include torrential rainfall, superstorms, and droughts.
Ecosystem Impact Examples:
- In addition to damaging homes and property, extreme events can affect human health in a number of ways. They can reduce the availability of safe food and drinking water, damage roads and bridges, disrupt access to hospitals and pharmacies, and worsen air quality leading to asthma attacks and other respiratory and cardiovascular health effects.
- When water bodies (lakes, creeks, ponds, lagoons, and lakes) dry out, and water animals die, entire food chains and ecosystems are affected.
- Hurricanes generate strong winds that can completely defoliate forest canopies and cause dramatic structural changes in wooded ecosystems
Image 5 – Ocean Acidification
Oceans are absorbing a large portion of the carbon dioxide emitted into the atmosphere. Some of the absorbed carbon reacts within the water to form carbonic acid. This, in turn, makes the oceans more acidic and less hospitable to many forms of marine life.
Ecosystem Impact Examples:
A more acidic environment has a dramatic effect on some calcifying species, including oysters, clams, sea urchins, shallow water corals, deep-sea corals, and calcareous plankton. These species are indispensable for ecosystems worldwide: they provide nursery habitats for fish, a vital link in marine food webs, and natural defenses against storms and erosion.
Today, more than a billion people worldwide rely on food from the ocean as their primary source of protein. Many jobs and economies in the U.S. and around the world depend on the fish and shellfish in our oceans.
Note: Changes in the timing of seasonal life-cycle events, range shifts, and extinction risks are potential additional ill effects of global warming.
- Many scientists project that these trends will continue and in some cases accelerate, posing significant risks to various facets of Earth’s spheres, including natural resources that are vital to the economy, environment, and our quality of life.
______________________________________________
SLIDE 4VES-10
Teacher’s Notes
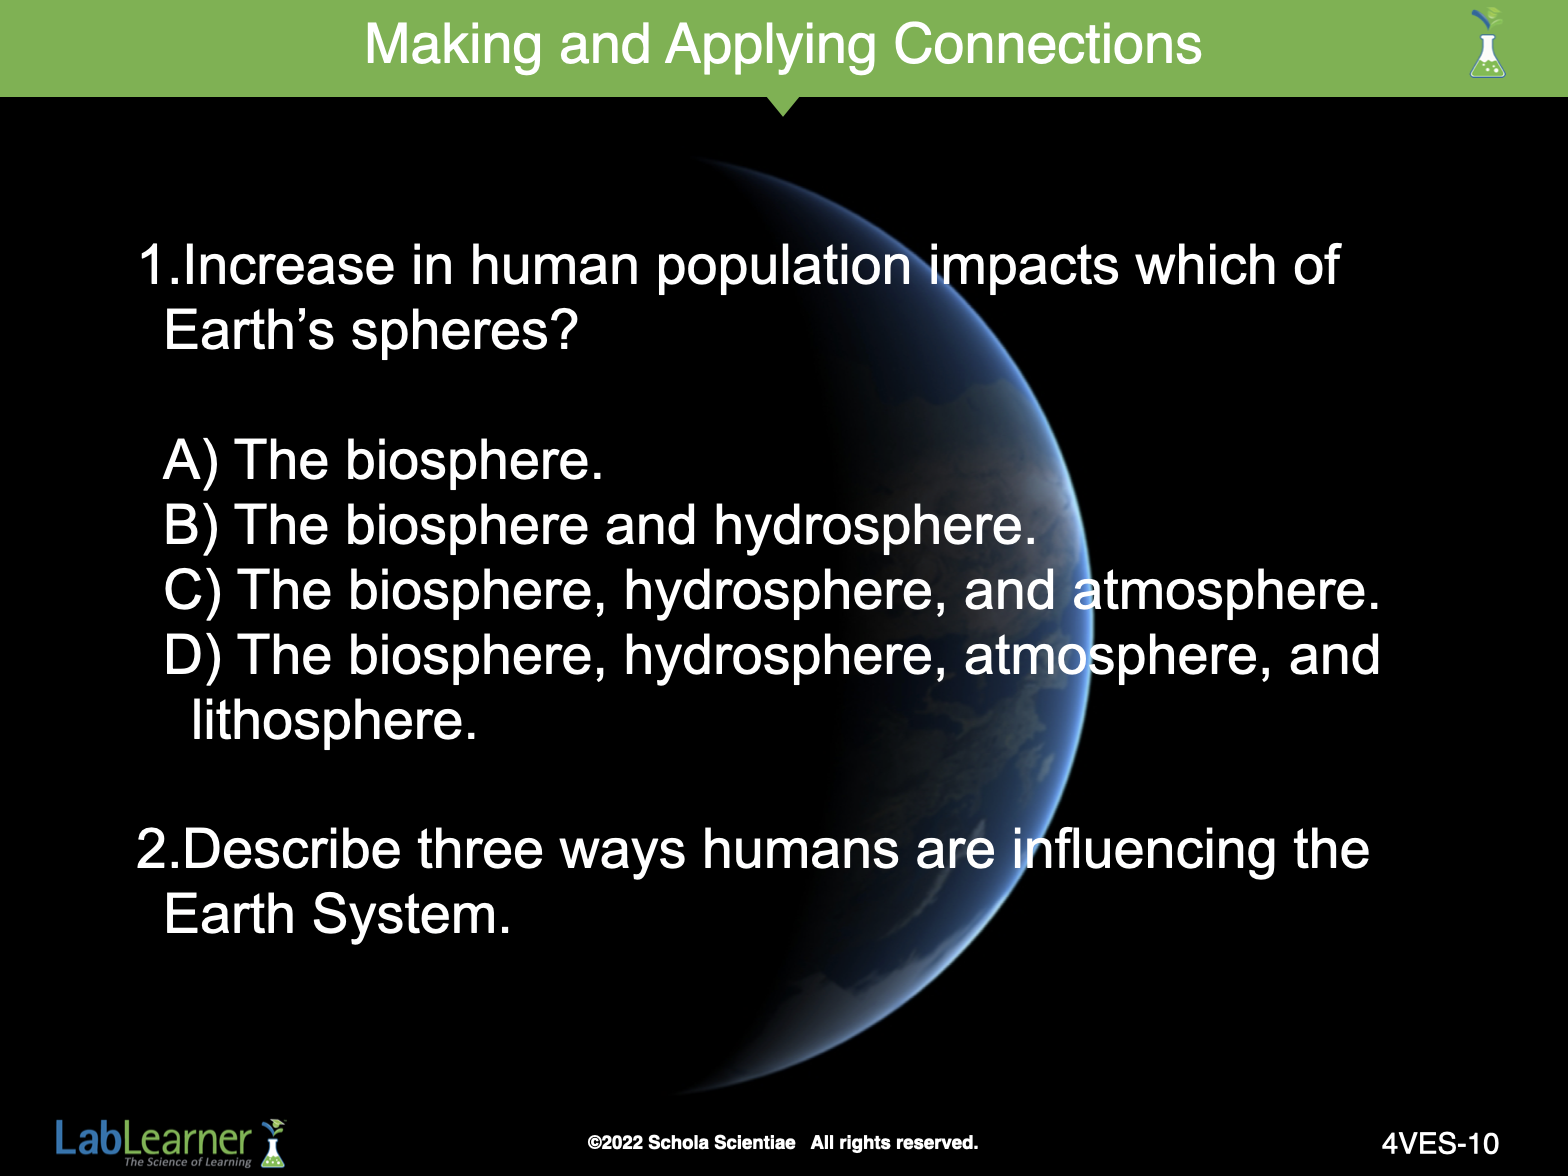
Question 1 – Answer D
There are currently 7 billion humans inhabiting the planet, a substantial difference from the 200 million not so long ago. This vast increase in population is changing the way we use resources like animals for food, timber, and even fossil fuels. In turn, the rapid rise in consumption is placing new-found pressures on the entire Earth System.
One human-driven event that impacts all of Earth’s spheres, either directly or indirectly, is the consumption of fossil fuels. When we extract oil, coal, and natural gas from the Earth’s crust then burn these fossil fuels for transportation and industry, we are putting more carbon into the atmosphere than is being removed naturally through the carbon cycle, ultimately causing atmospheric carbon dioxide concentrations to increase.
Elevated levels of atmospheric carbon dioxide, along with other greenhouse gases, trap some of the Sun’s energy, leading to global climate change (change in weather patterns).
Global warming and climate change may lead to the following impacts or trends: rising sea levels, failing agricultural output, increase in pests and disease, extreme weather patterns, and ocean acidification.
Question 2 – Student answers will vary. Sample responses are below.
Sample Response 1:
Overfishing occurs when more fish are caught than the population can replace through natural reproduction. Likewise, over-harvesting of trees occurs when forests are cut down faster than they can regrow. Gathering as many resources as possible may seem like a profitable practice, but overfishing and over-harvesting have serious consequences. The results can lead to (but are not limited to) the extinction of species, the disruption of food webs, and the destruction of the natural habitats of many species.
Sample Response 2:
Fossil fuels — oil, coal, and natural gas — supply our energy needs, but their production and use have significant impacts.
When we extract oil, coal, and natural gas from the Earth’s crust then burn these fossil fuels for transportation and industry, we are putting more carbon into the atmosphere than is being removed naturally through the carbon cycle, ultimately causing atmospheric carbon dioxide concentrations to increase.
Elevated levels of atmospheric carbon dioxide, along with other greenhouse gases, trap some of the Sun’s energy, leading to global climate change (change in weather patterns).
Sample Response 3:
Over the past decades, a number of reforestation projects around the world have succeeded in bringing forests back to life and health. The Green Belt Movement in Kenya is one of the most well-known, but efforts to revive forests have succeeded around the world.