Teacher Portal:
Earth’s Forces
Investigation 4 – PostLab
 PRINT IT
Use your browser to download a printable PDF as help during the slide presentation and to make additional notes. In your browser, go to File > Print and then choose to save as PDF.
NAVIGATE IT
Once the slide presentation is launched
- use your left and right arrows to advance or go back in the slide presentation, and
- hover your mouse over the left edge of the presentation to get a view of the thumbnails for all the slides so that you can quickly move anywhere in the presentation.
- Click HERE to launch the slide presentation for the CELL.
SHARE IT

SLIDE VEFORCE4-post-1
In Investigation Four, students studied the important force of friction. In the lab, they learned how to measure frictional force with a spring scale and test the frictional force of several different surface types.
______________________________________________

SLIDE VEFORCE4-post-2
Begin the PostLab analysis of the experiments with a review of the Trials conducted. The following questions are intended as a guide for student discussion:
Remind students that before they can analyze the data collected in the Lab, they should first refresh their memory of the trials. One good way to do this is to use the Cognitive Tool, Summarize. In this case, the Summarize tool can be used as follows:
Tell students to look back at Trials 1 through 3. Ask students: Scientists call something that varies in an experiment, a variable. What variables were we investigating in the first trial? What did we vary? In the first trial, the effect of surface type (a variable) on the force of friction (a variable) was examined.
Ask students: Which surface types were varied? The lab table, masking tape, and sandpaper.
Ask students: How can Trial 4 be summarized? In Trial 4, students measured the weight of three combinations of objects using the spring scale.
Direct students to the Table in Problem 8, where students recorded the results of Trials 5 through 8. Ask: What was varied in Trials 5 through 8? Students should recognize that the weight of the objects pulled across the surface varied in Trials 5 through 8.
Assist students in summarizing the whole experiment. Ask students: Can you use the variables we discussed and make a sentence that summarizes the experiments we conducted in the lab? In the lab, students conducted an experiment to investigate the effects of varying surface types and weights, on the force of friction.
______________________________________________

SLIDE VEFORCE4-post-3
Begin to analyze the first three Trials. Students will first need to calculate the average force of friction obtained over the three surfaces.
1. Divide the class into cooperative groups. If possible, students should work with the same groups with whom they worked in the Lab.
2. Refer students to Problem 4 of their Student Data Record. Tell students that they need to first calculate the average force of friction for each surface type.
3. Ask students to look at the Table and ask for a volunteer to tell the class how to calculate the average force of friction. Students should suggest that they should find the sum of the three runs for each surface type, then divide by three to obtain the average.
4. Remind students that the average is also called the mean of a set of numbers.
5. At the instructor’s discretion, allow students to work collaboratively to calculate the average force of friction for each surface type.
6. Ask students to review their data. Ask students: Which surface type resulted in the lowest force of friction? Dragging the woodblock across the lab table resulted in the lowest force of friction.
7. Ask students: Which surface type resulted in the highest force of friction? Dragging the woodblock across the sandpaper resulted in the highest force of friction.
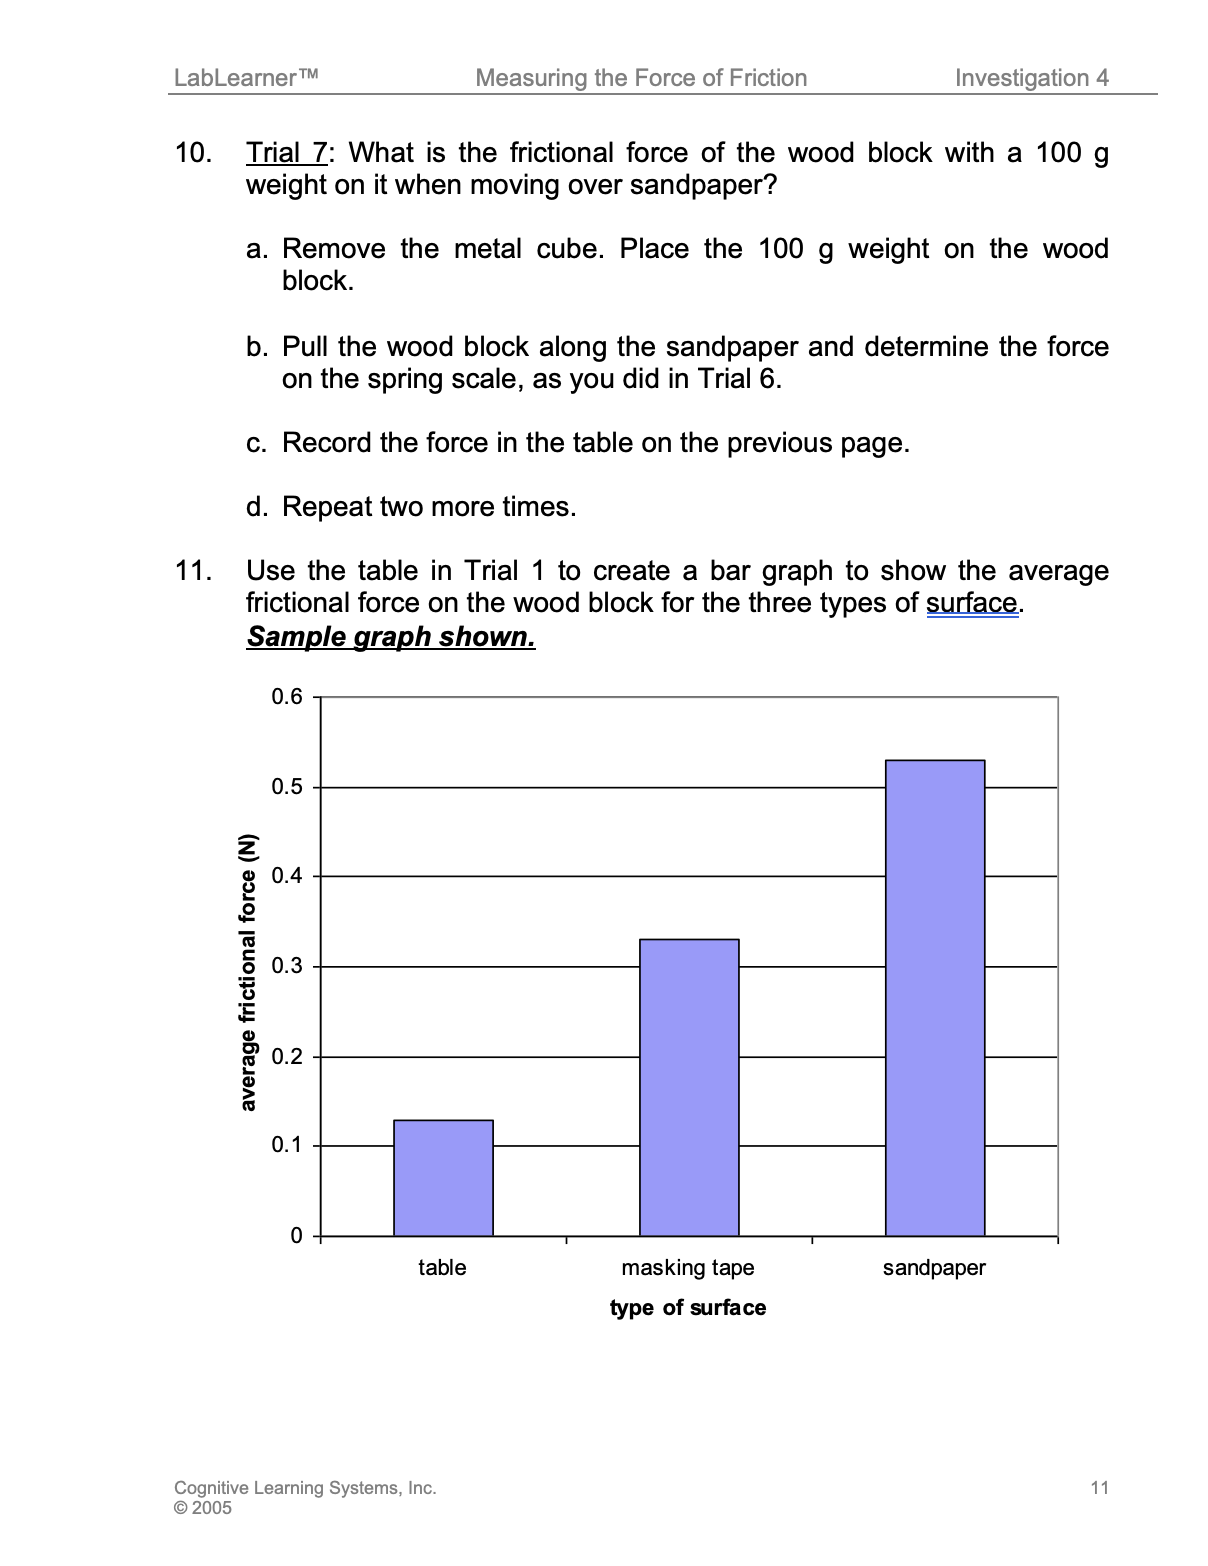
8. Direct students’ attention to Problem 11 in their Student Data Record.
9. Guide students in the construction of a bar graph to show the results of the first three Trials in a graphical form. If necessary, refer students to the Procedural Tool, Creation and Completion of a Bar Graph.
10. Direct students to record their conclusions in Problem 12 in their Student Data Record.
______________________________________________
SLIDE VEFORCE4-post-4
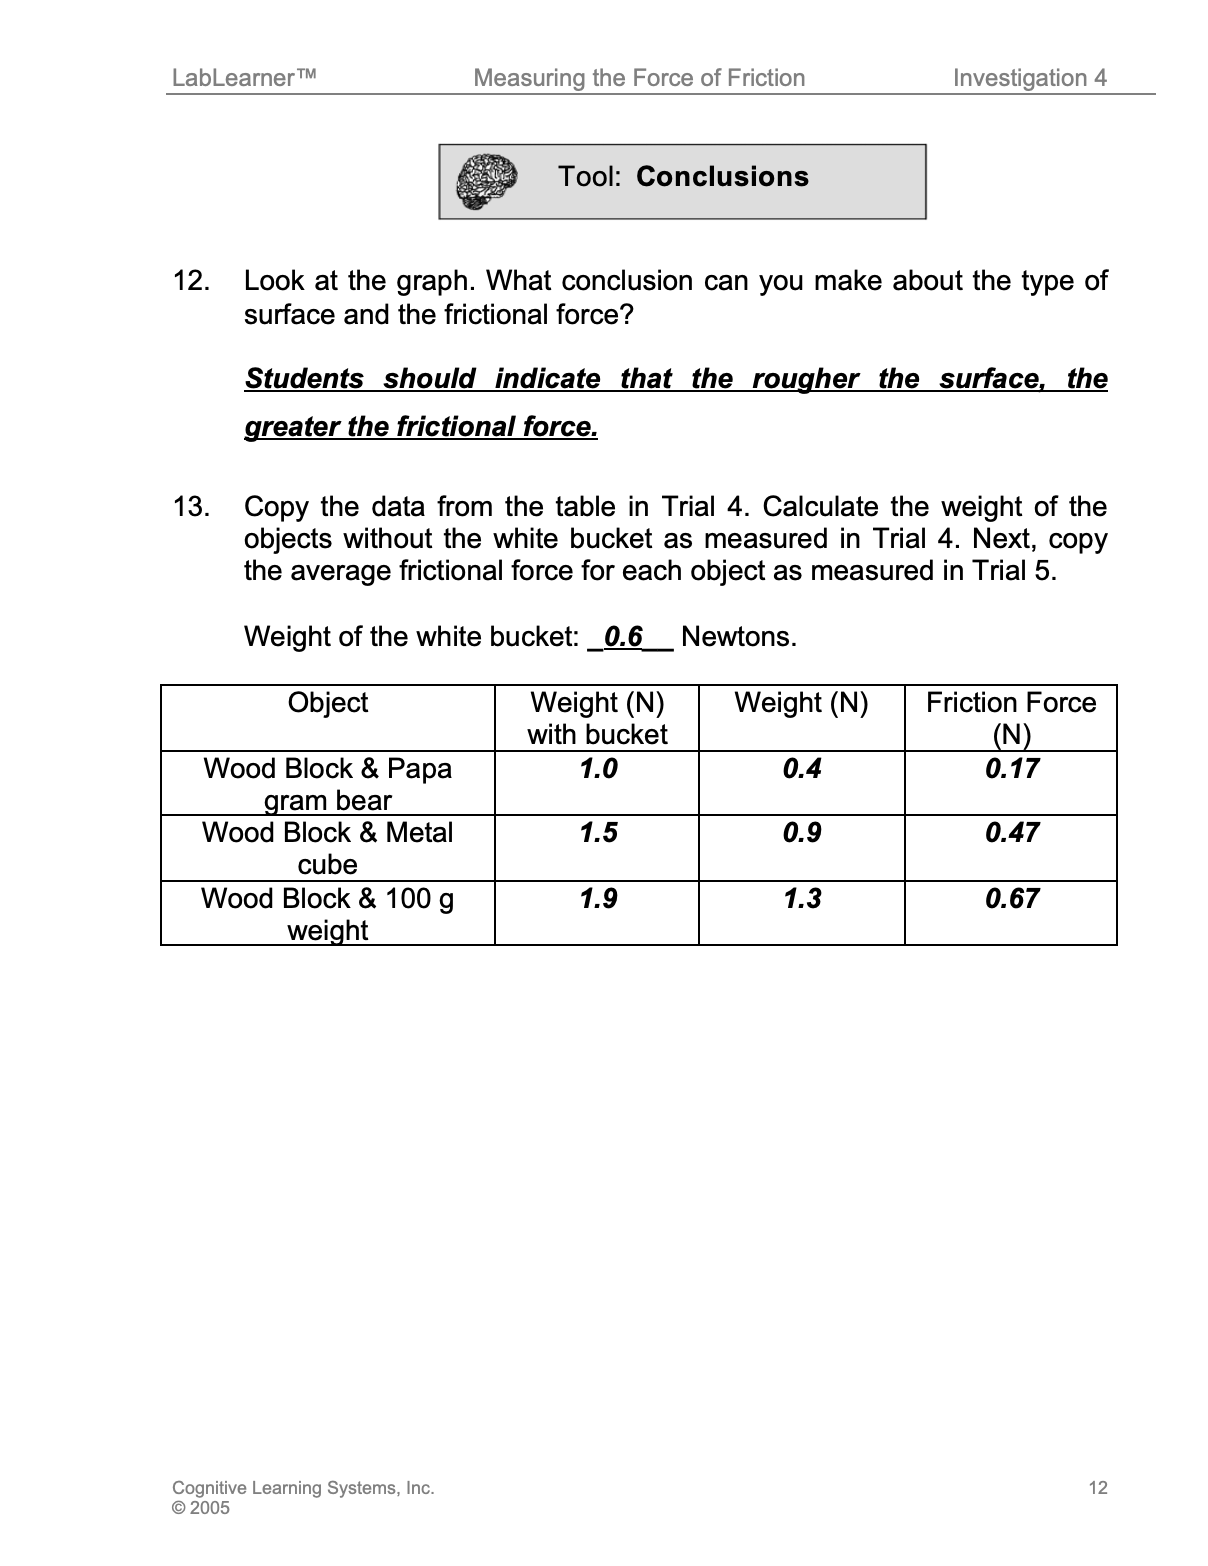
Copy the data from the Table in Trial 4. Calculate the weight of the objects without the white bucket as measured in Trial 4. Next, copy the average frictional force for each object as measured in Trial 5.
1. Direct students’ attention to the table in Problem 13. Students should first copy the data from the Table in Problem 7 into the second column of the table.
2. Students should subtract the weight of the bucket from the weight of each of the objects. The bucket was used as a method of easily finding the weight of the other objects and so the weight of the bucket is not relevant to the analysis of Trials 5 through 7.
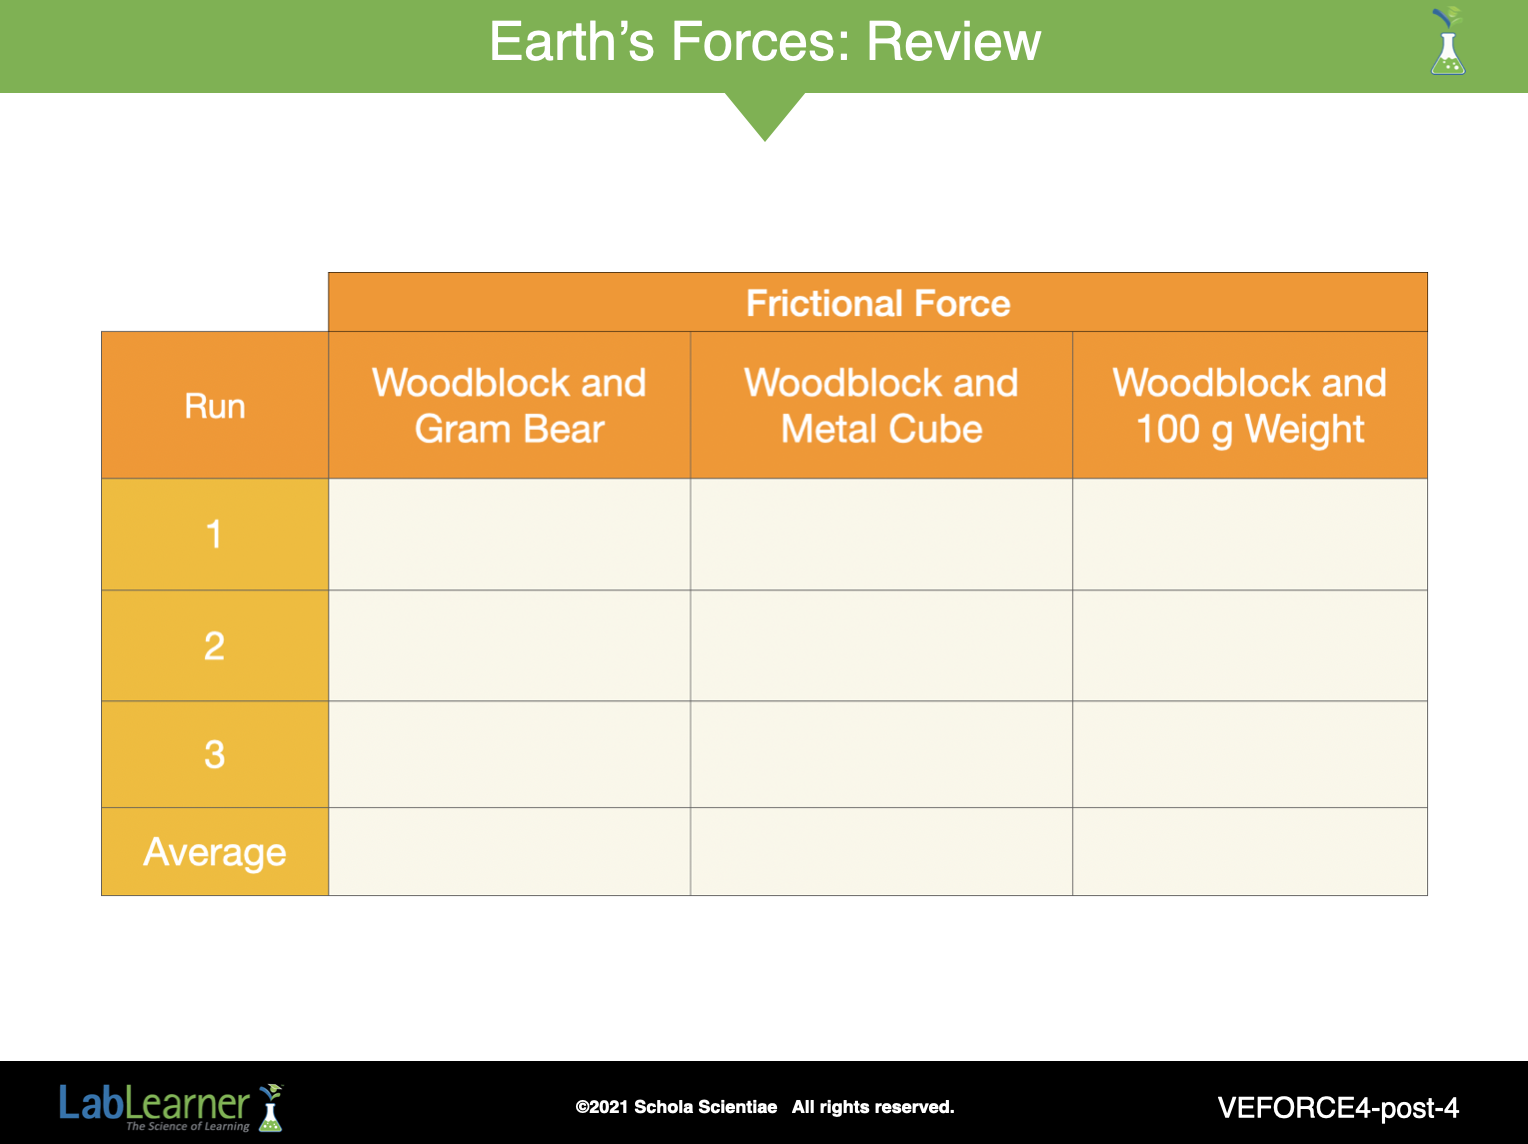
3. Ask students to decide on a method to calculate the average frictional force present during Trials 5 through 7. The data is contained in the Table in problem 8. Students should recognize that the appropriate method of calculating the average frictional force is to sum the three runs for each object and then divide each by three.
4. Students should copy the frictional force data for each of the three object combinations from Problem 8.
5. At the instructor’s discretion, allow students to collaborate in their groups to complete the table.
______________________________________________
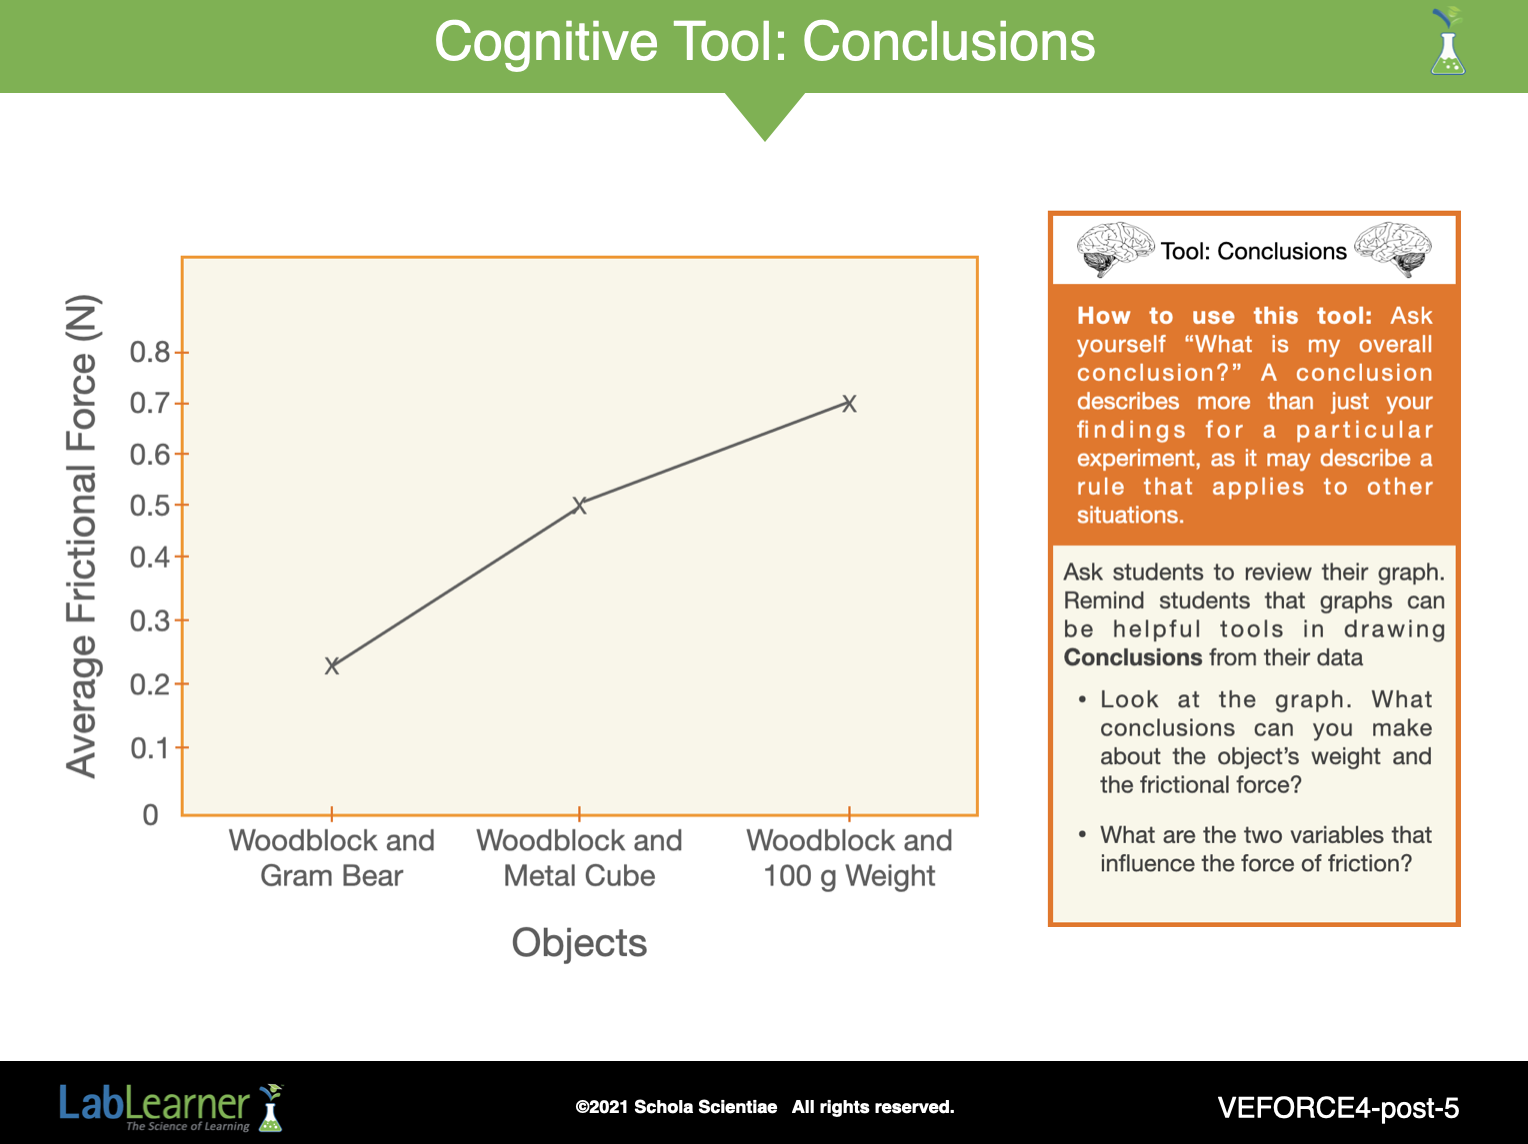
SLIDE VEFORCE4-post-5
Ask students to examine the Table carefully.
Ask students: Is the friction force greater or smaller than the weight (force of gravity) of an object? Students should indicate that the frictional force is less than the force of gravity on an object.
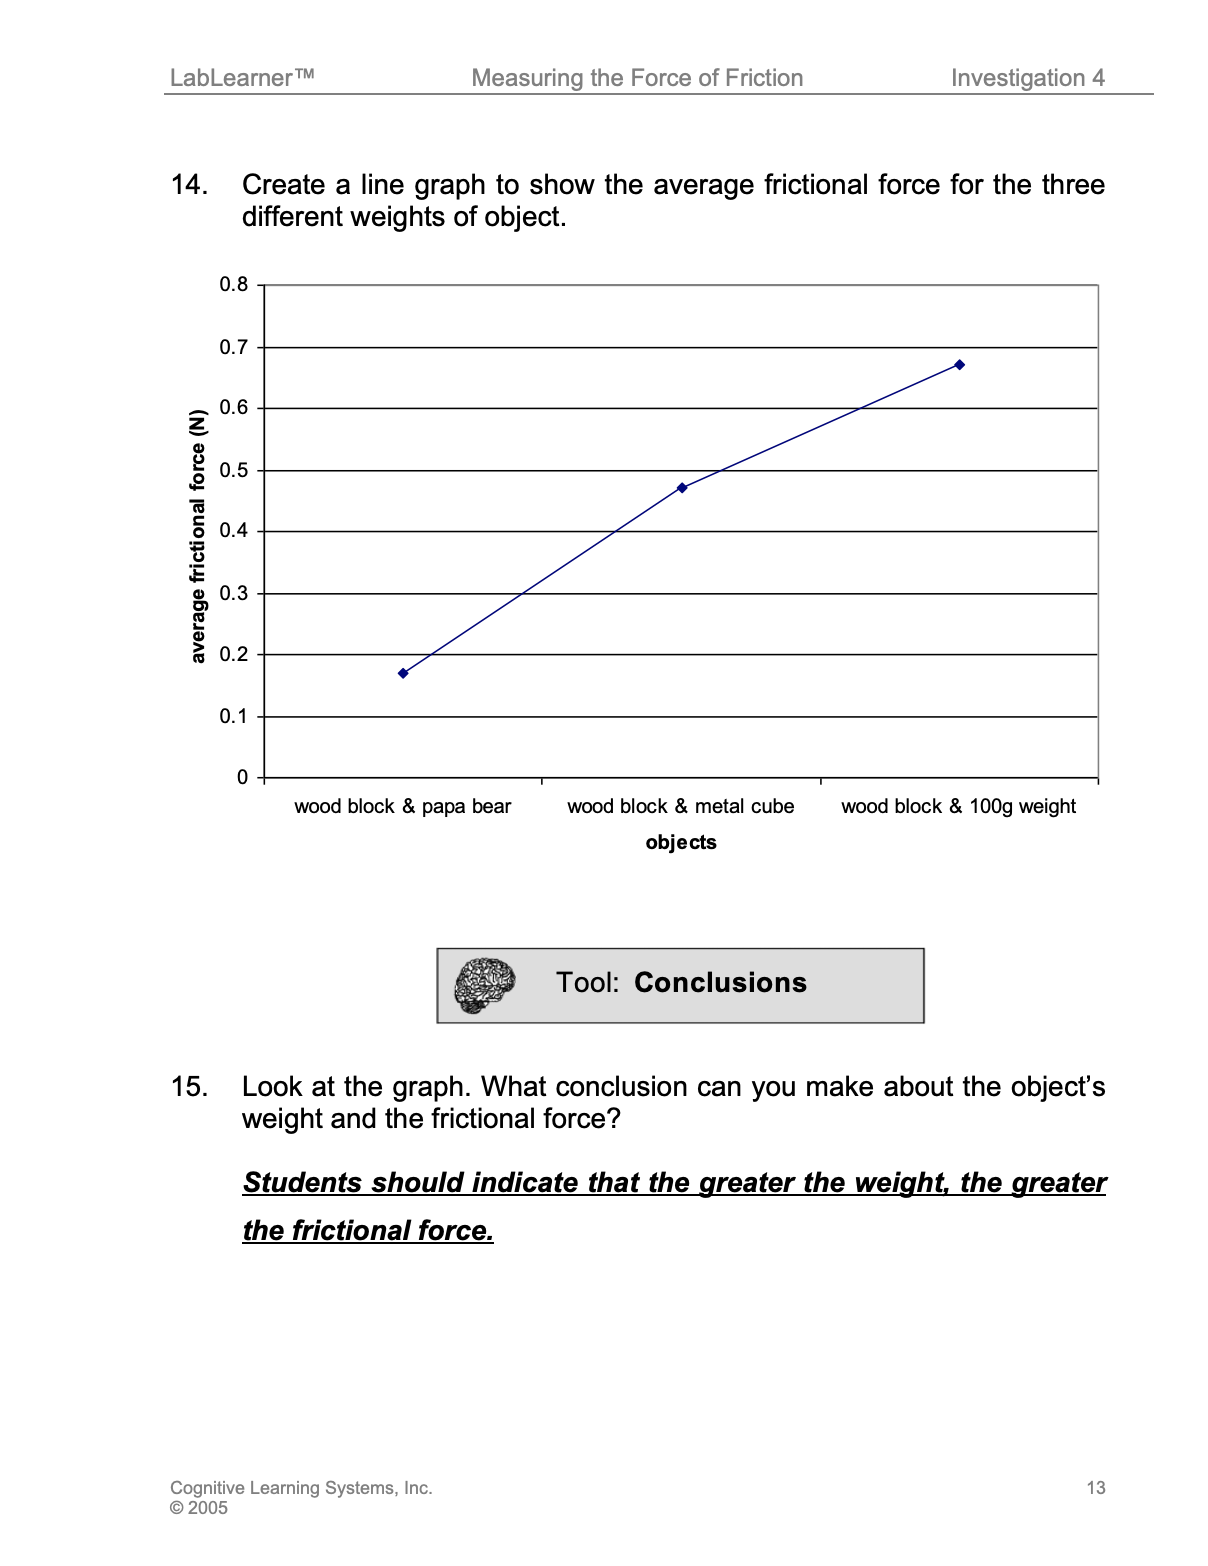
Ask students if they can think of a type of graph that would be appropriate for displaying their data. Student answers may vary. Guide students to realizing that a line graph is appropriate.
Instruct students to construct a line graph in the blank space in Problem 14 of the Student Data Record. Students may refer to their Procedural Toolbox if they need assistance in creating and completing a line graph.
Direct students to record their conclusions in Problem 15 of their Student Data Record.
______________________________________________

SLIDE VEFORCE4-post-6
Close the Investigation with a brief application exercise, to promote students’ ability to transfer the experimental data to real-world applications.
The following questions are intended as a guide for student discussion:
Ask students: Imagine that you have to push two boxes along the floor. One box weighs 20 Newtons and the other box weighs 30 Newtons. Which one would be harder to move, and why? Students should indicate that because weight is related to the force of friction, it would be harder to push the box weighing 30 Newtons.
Ask students: Would keeping the 20 Newton box moving involve a force of friction greater than, less than, or equal to 20 Newtons? Students should recognize that because the force of friction involved once an object is moving is less than the force of gravity acting on the object (its weight), a force of less than 20 Newtons would be required.
Ask students: You have new basketball shoes. The first time you play basketball in the gym while wearing them, you slide around. Could you do anything to the shoes to stop yourself from sliding? Student answers may vary. Student answers should include a method of making the sole of the shoe rougher would help to prevent sliding.
Referring to the basketball shoes above, Ask students: Would you have increased or decreased the force of friction? Students should indicate that they would increase the force of friction in order to prevent sliding.
KEYS: LAB/POSTLAB