Teacher Portal:
Exploring Ecosystems
Investigation 5 – PostLab
 PRINT IT
Use your browser to download a printable PDF as help during the slide presentation and to make additional notes. In your browser, go to File > Print and then choose to save as PDF.
NAVIGATE IT
Once the slide presentation is launched
- use your left and right arrows to advance or go back in the slide presentation, and
- hover your mouse over the left edge of the presentation to get a view of the thumbnails for all the slides so that you can quickly move anywhere in the presentation.
- Click HERE to launch the slide presentation for the CELL.
SHARE IT
SLIDE VECO5-post-1
This was the fifth and final regular Investigation of the LabLearner CELL Exploring Ecosystems. In it, students explored the impact of environmental pollutants on plants and animals in an ecosystem.
______________________________________________
SLIDE VECO5-post-2
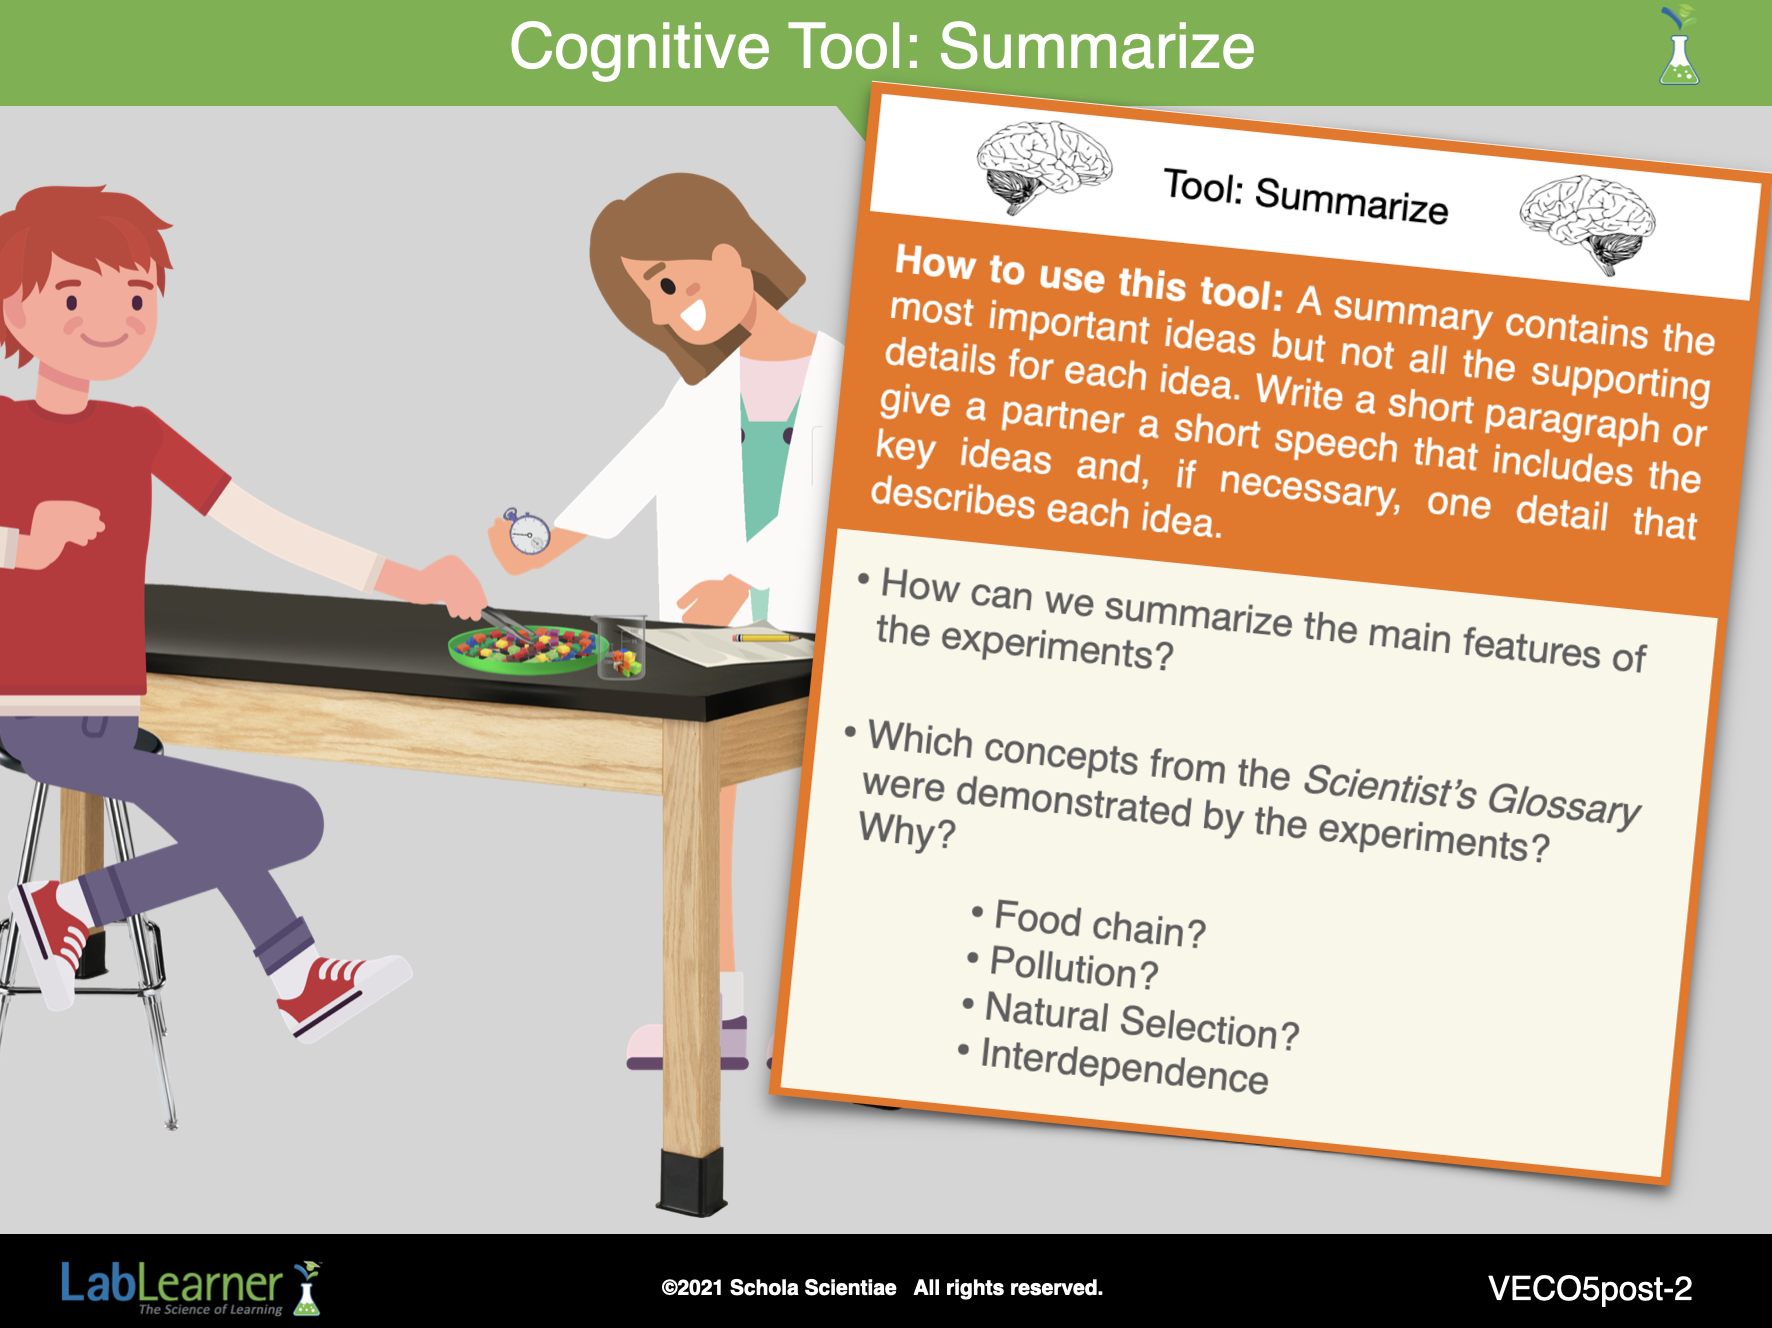
A. Begin the analysis of the experiments by summarizing the procedure of the experiments and connecting the key terms that the experiments were designed to demonstrate, to specific outcomes. Students should refer to their Scientist’s Glossary to support the identification and comprehension of key terms.
- Model to students the process of revisiting the experiments performed in the Lab, by expressing an interest in thinking about the main points and features of the experiments. Encourage students to do this with you, and in doing so use the Summarize tool from the Cognitive Toolbox.
- Ask students: How can we summarize the main features of the experiments? Students should recall modeling being rabbits in three environments: one unaffected environment, one environment in which the number of producers was reduced, and one environment in which the food source for the rabbits was affected. Students used forceps to model eating, used gram cubes to model food, and fed during a period of one minute to simulate one year.
- Ask students: Which concepts from the Scientist’s Glossary were demonstrated by the experiments? Why? Student answers may vary. Sample terms and reasons include:
- Food chain: The experiments included a producer (plants) and a type of herbivore (rabbits) that ate the plants.
- Pollution: The experiments demonstrated pollution of the producer and subsequent pollution of animals.
- Natural Selection: Rabbits that ate fewer than 15 g of polluted food, survived.
- Interdependence: Pollution of the land affected the biomass of producers and eventually the biomass (number) of herbivores.
______________________________________________
SLIDE VECO5-post-3
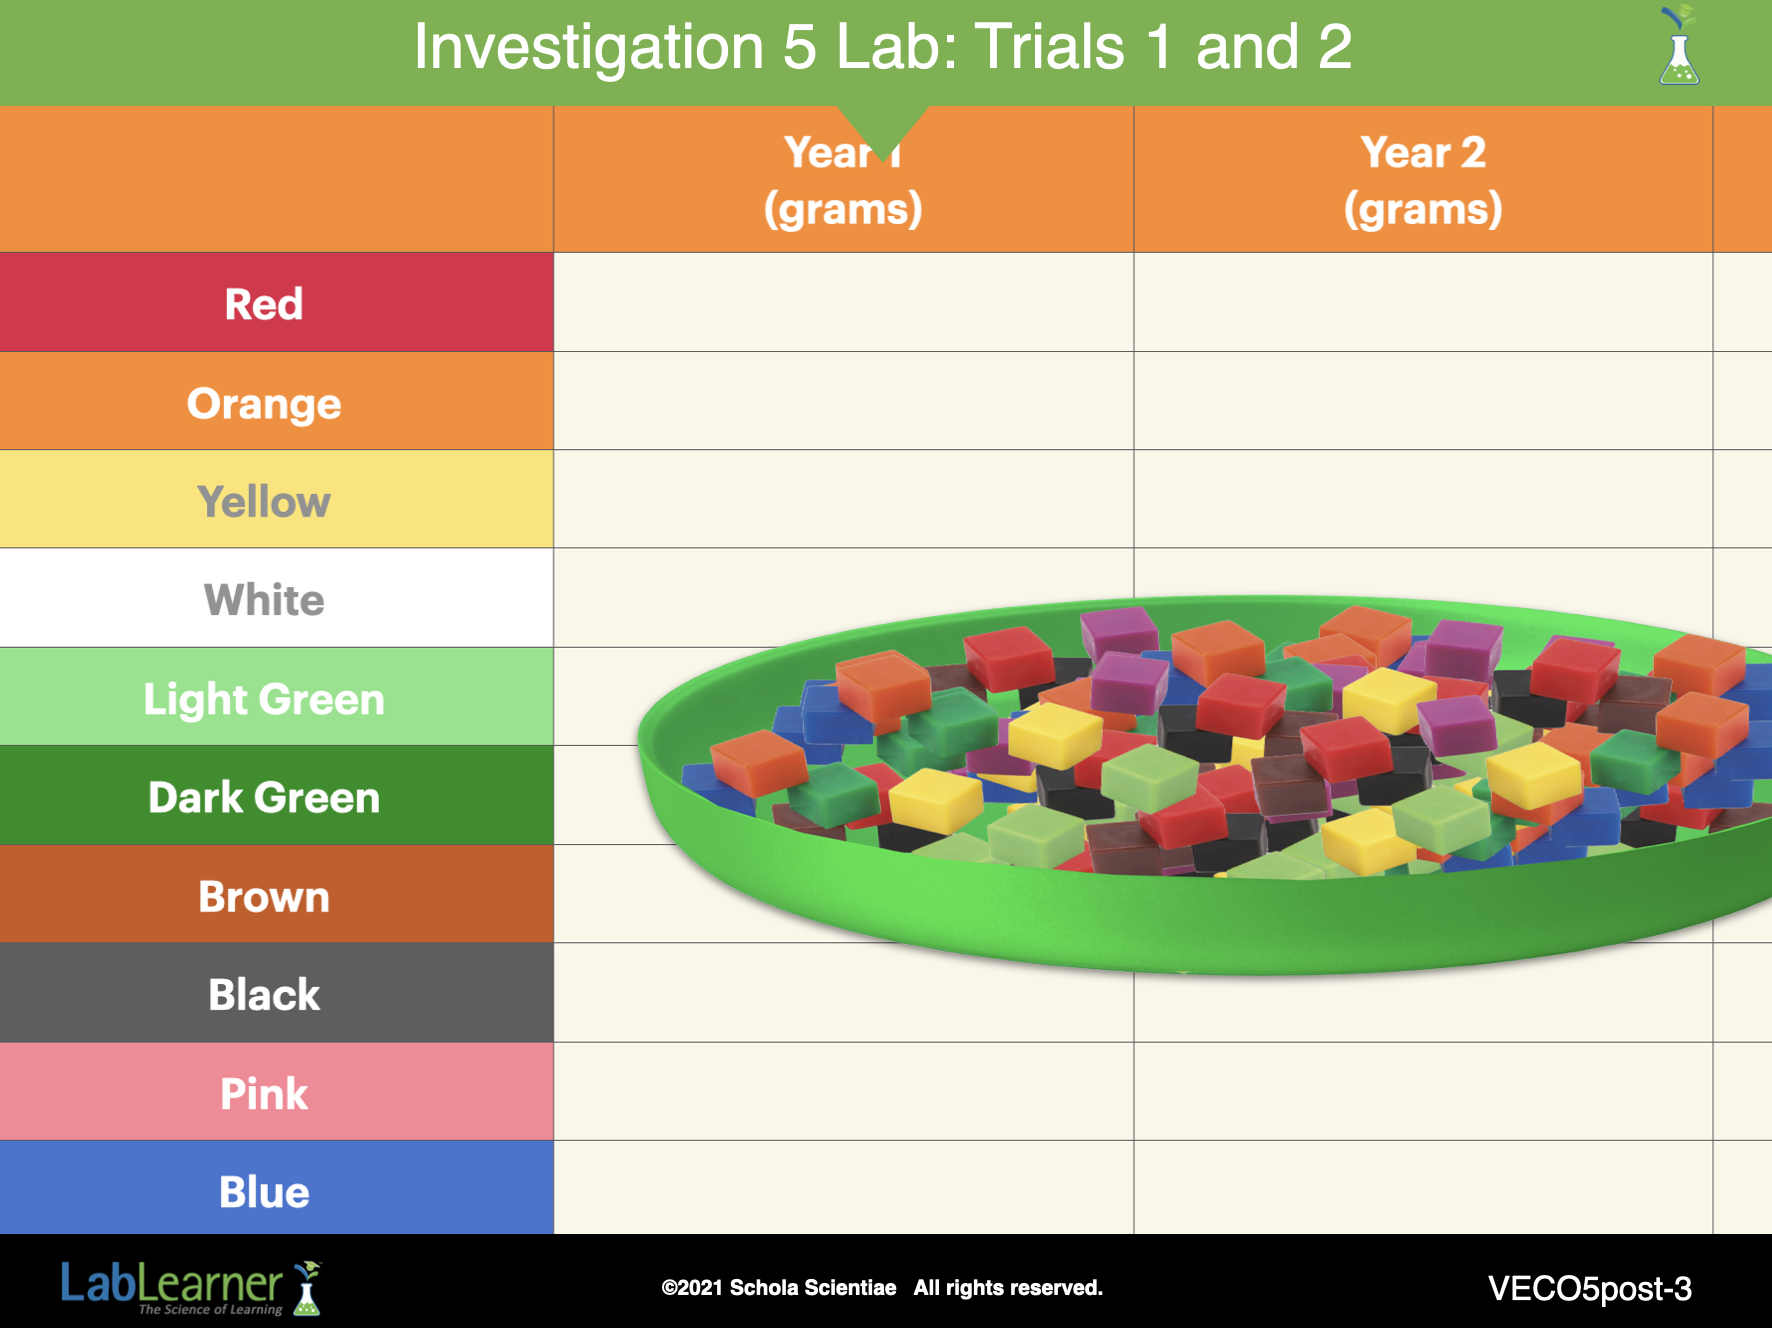
B. Review Trials 1 and 2 as a class.
1. Refer students to Table 1 in the Student Data Record.
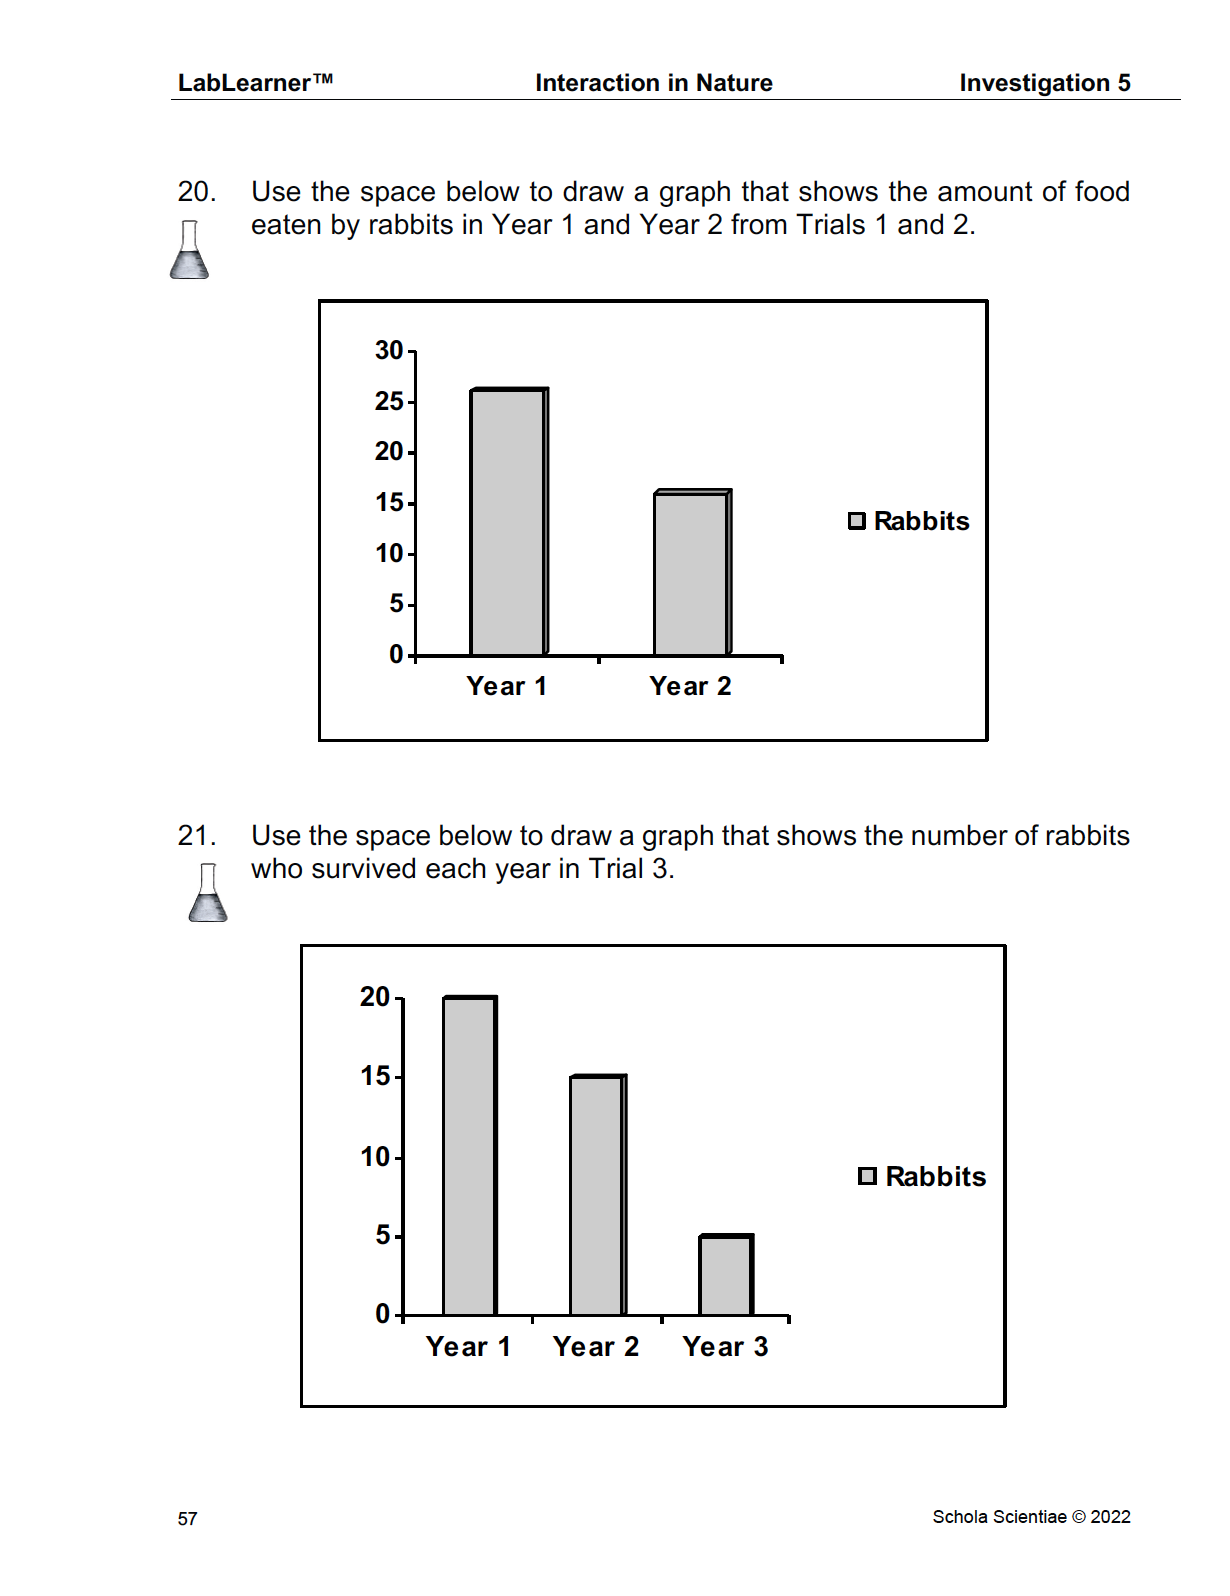
Ask students: How did the total amount of food eaten in Year 1 compared with the total amount of food eaten in Year 2? Students should indicate that because there was less biomass for the rabbits to eat in Year 2, less food was eaten in Year 2.
2. Ask students: If it takes 13 g of biomass to support a rabbit, how many of you (rabbits) survived Year 1? The class answer will vary. Count the number of students (rabbits) eating 13g or more of biomass.
3. Ask students: How many of you (rabbits) survived Year 2? The class answer will vary. Count the number of students (rabbits) eating 13g or more of biomass.
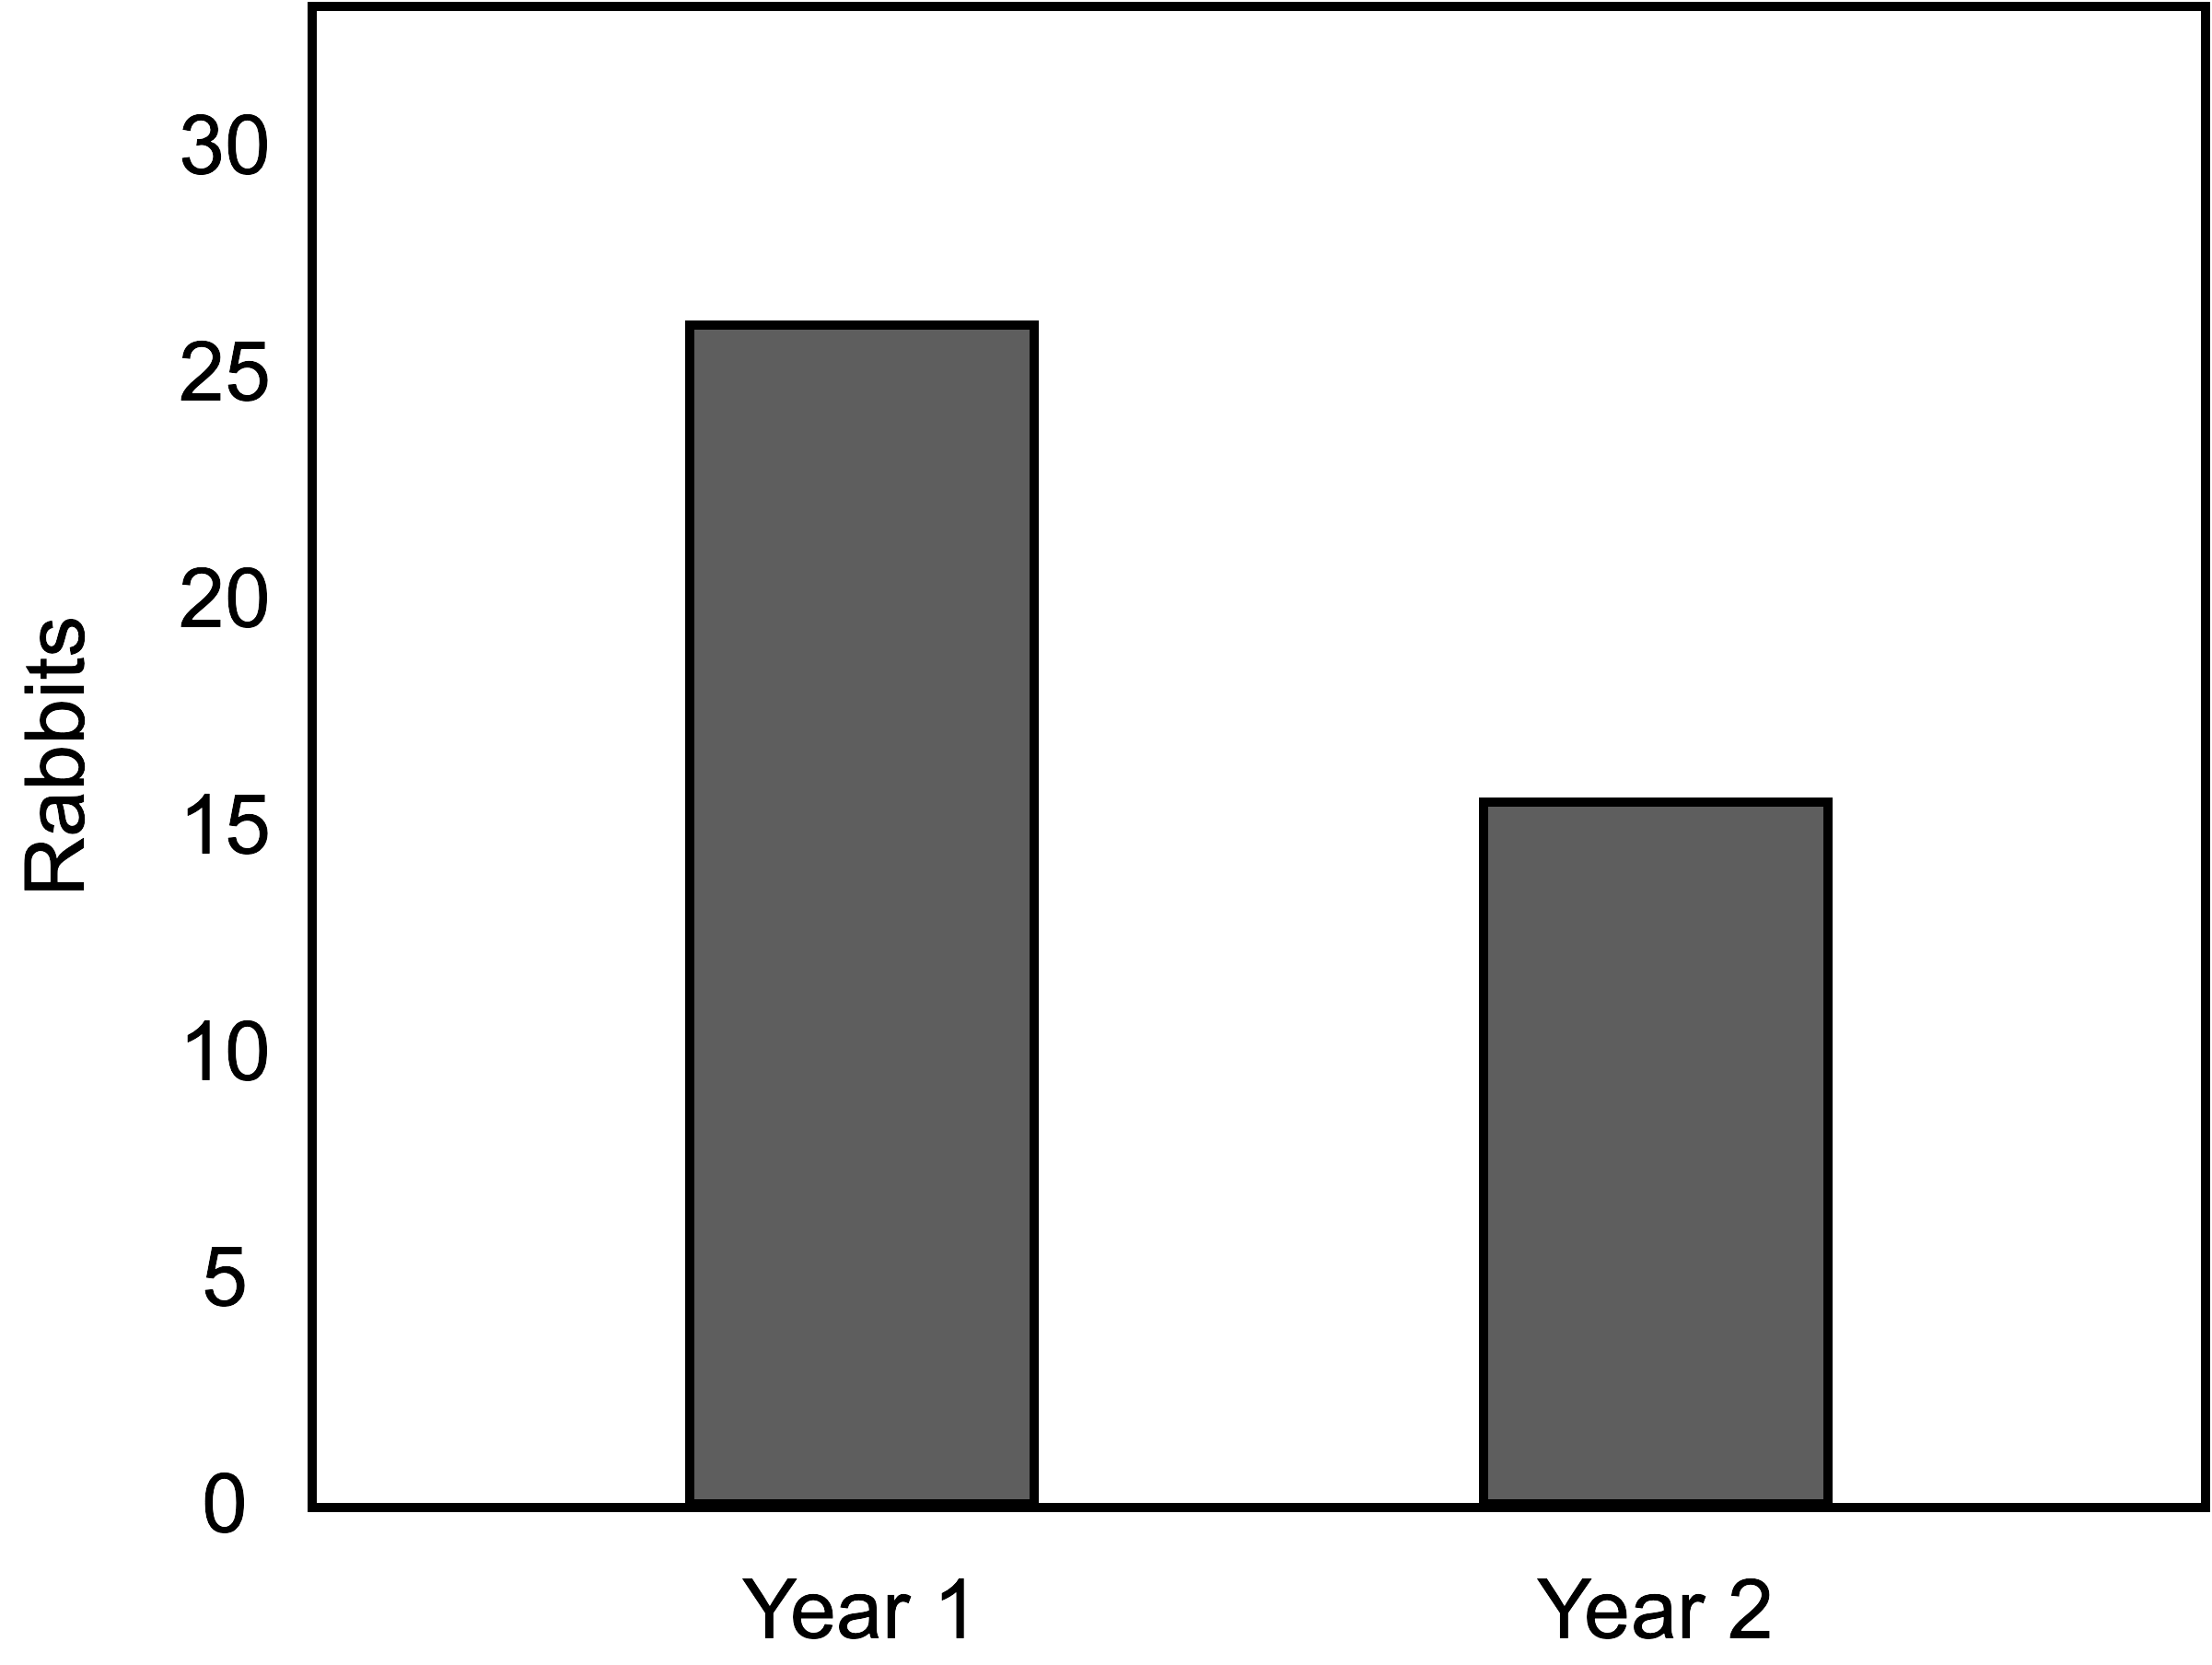
4. Ask students if they can think of a way to show this result using a graph or chart. Students should indicate that a bar graph is an appropriate method of displaying the data. Encourage students to use the data (particularly the maximum number of rabbits who survived) to determine the appropriate x and y axes for the graph. If necessary, refer students to the Procedural Tool Creation and Completion of a Bar Graph.
a. Allow students approximately 5 to 10 minutes to create the graph in Problem 20 of the Student Data Record.
b. Reproduce the appropriate axes on the board. Review the data as a class and complete the graph. Sample data are shown below:
______________________________________________
SLIDE VECO5-post-4
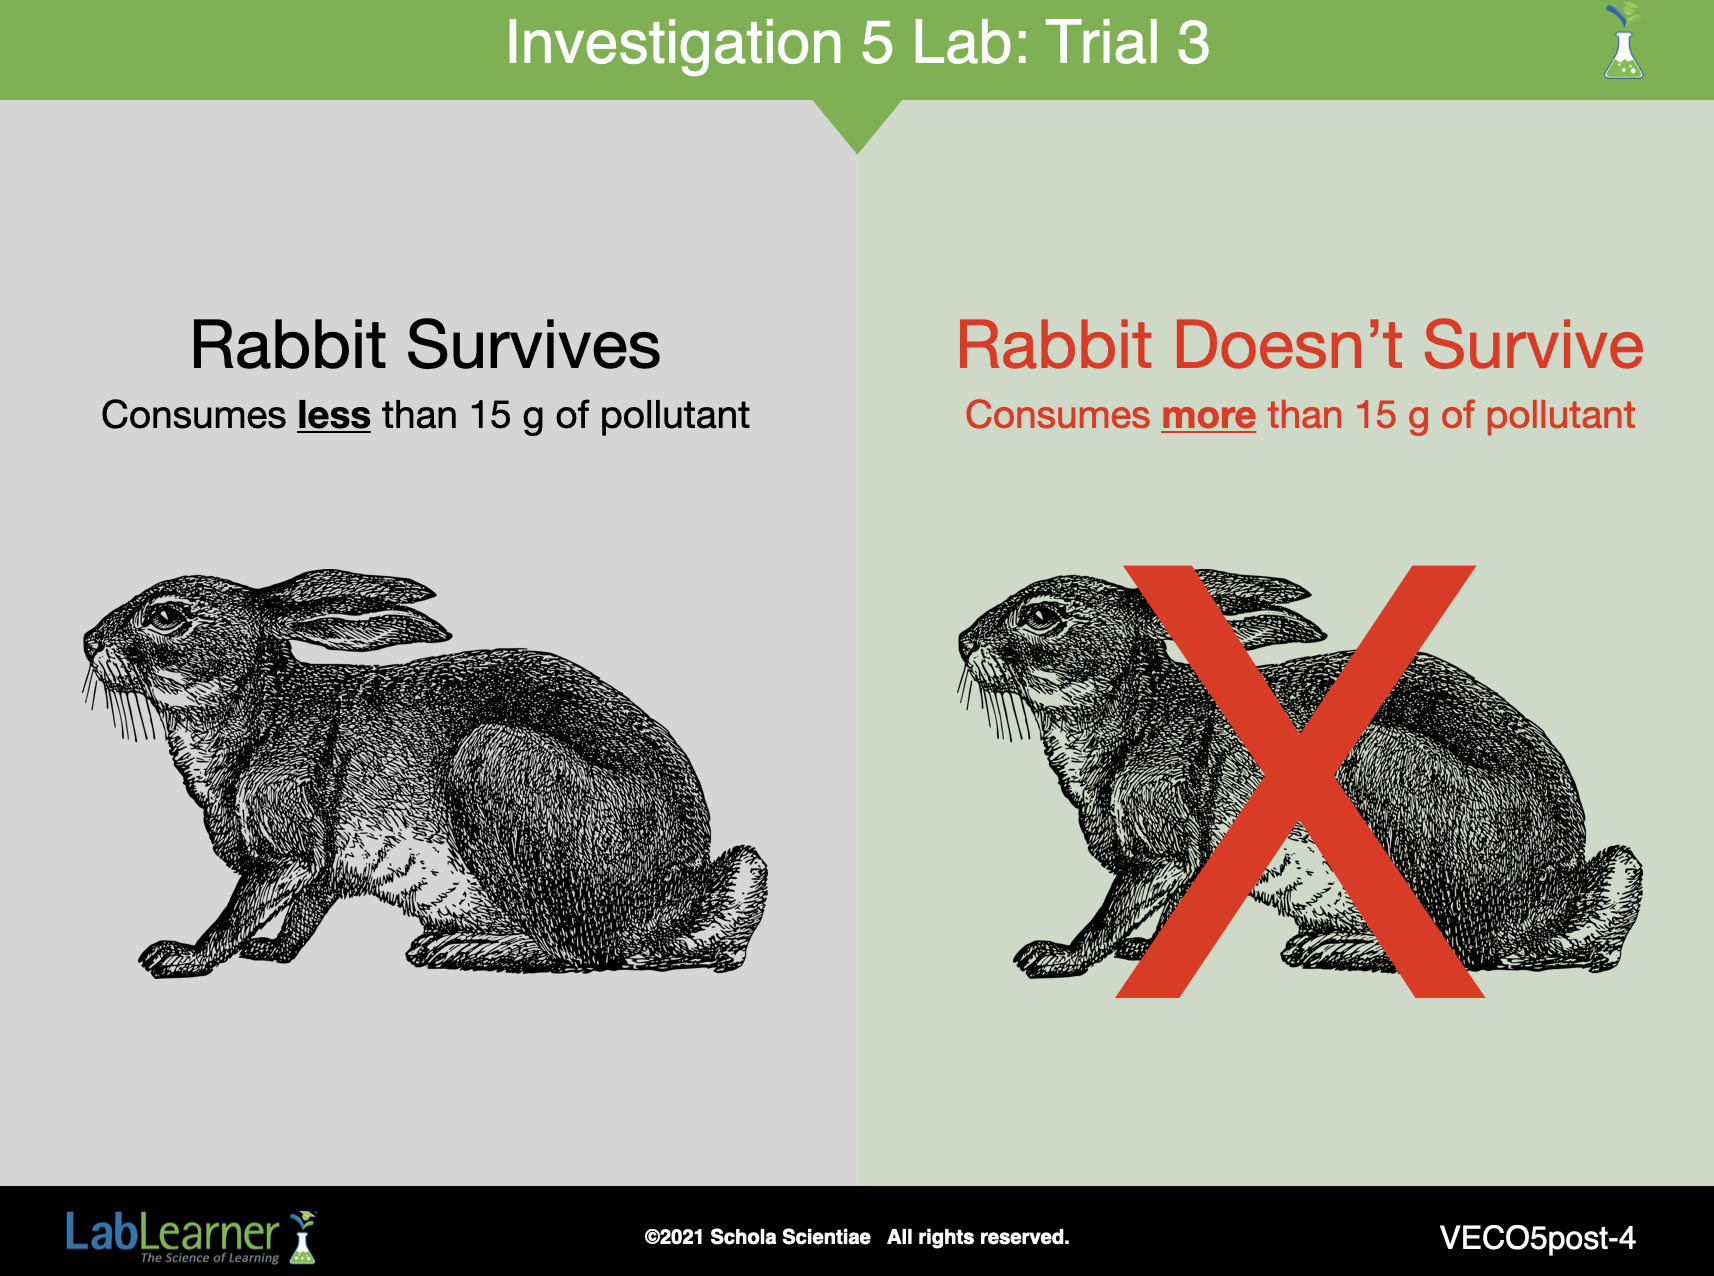
C. Review Trial 3, in which students modeled the effect of eating polluted food on the population of rabbits. The following questions are intended to further students’ comprehension.
1. Refer students to Problem 14 in the Student Data Record.
Ask students: How many grams of polluted food did you eat? Student answers will vary.
2. Refer students to Problem 15 in the Student Data Record. Explain that if a rabbit eats more than 15 grams of polluted food, it dies.
a. Ask students: How many years did your rabbit survive? Student answers will vary.
b. Record the number of rabbits that survived by eating less than 15 g of polluted food in Year 1, Year 2, and Year 3 on the board. Students will use this data to create a graph.
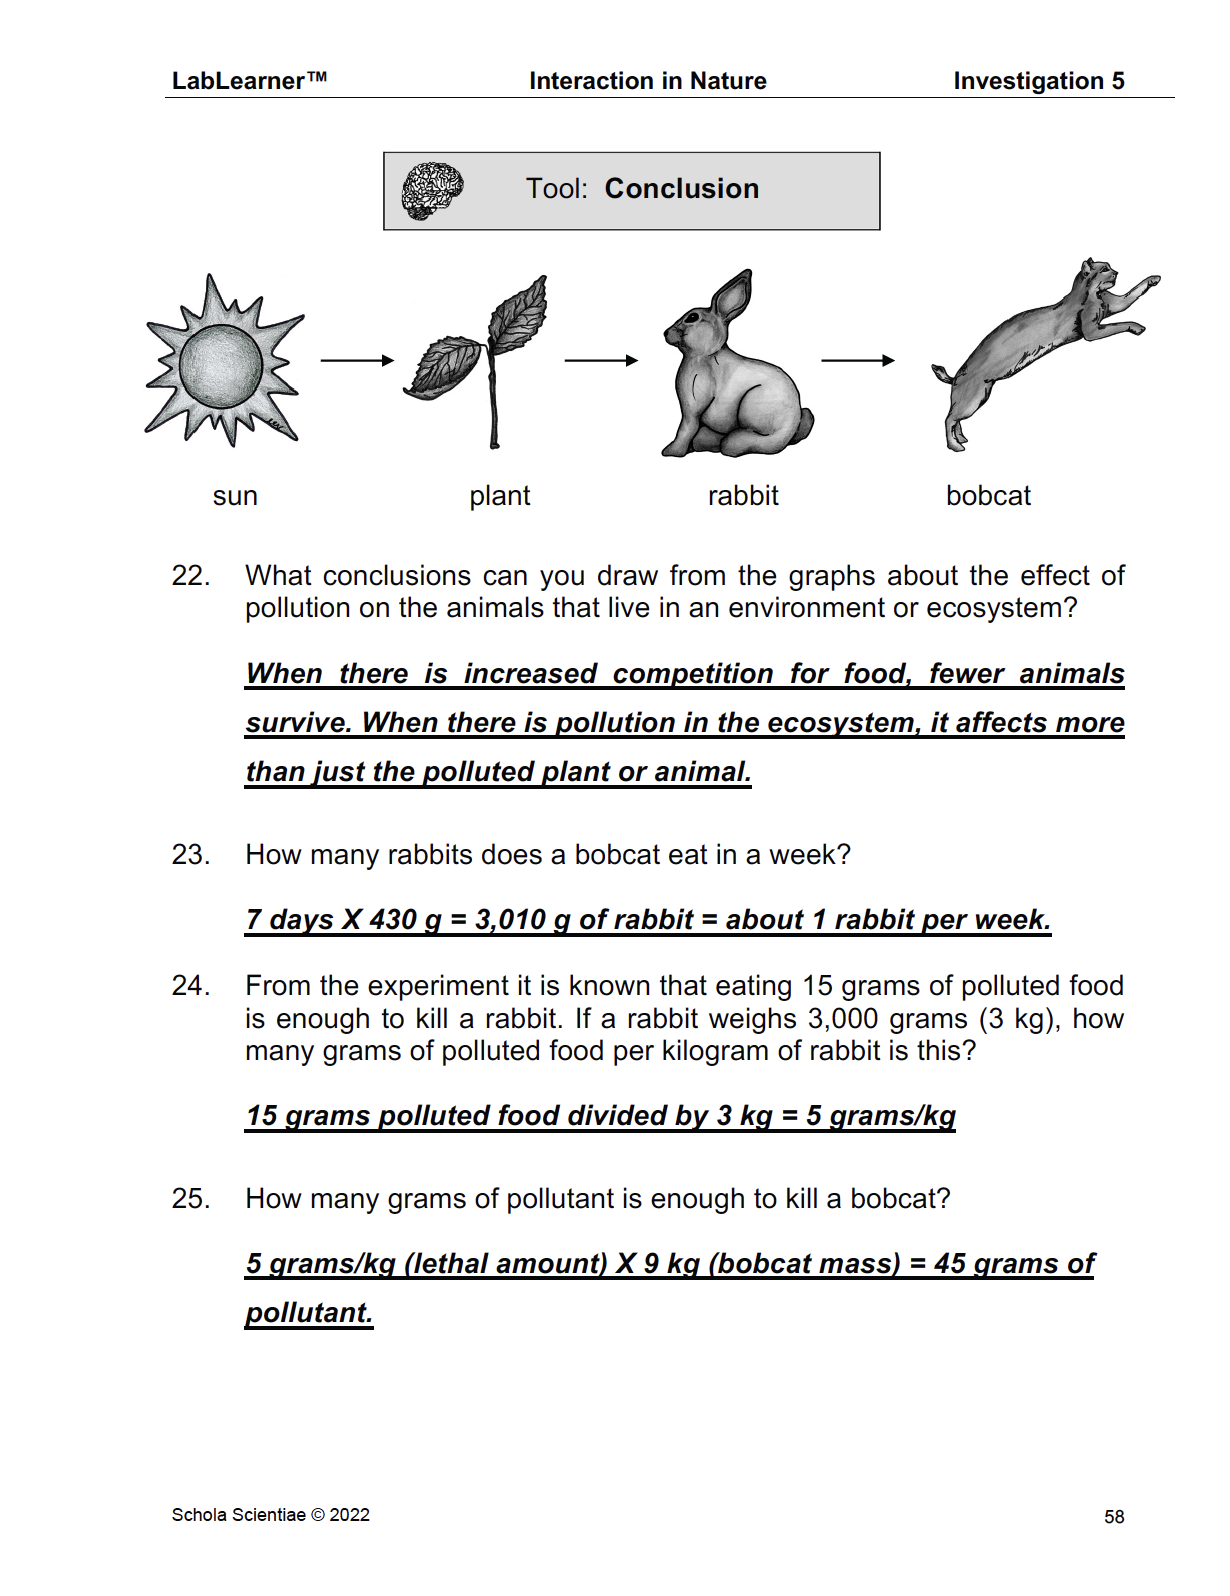
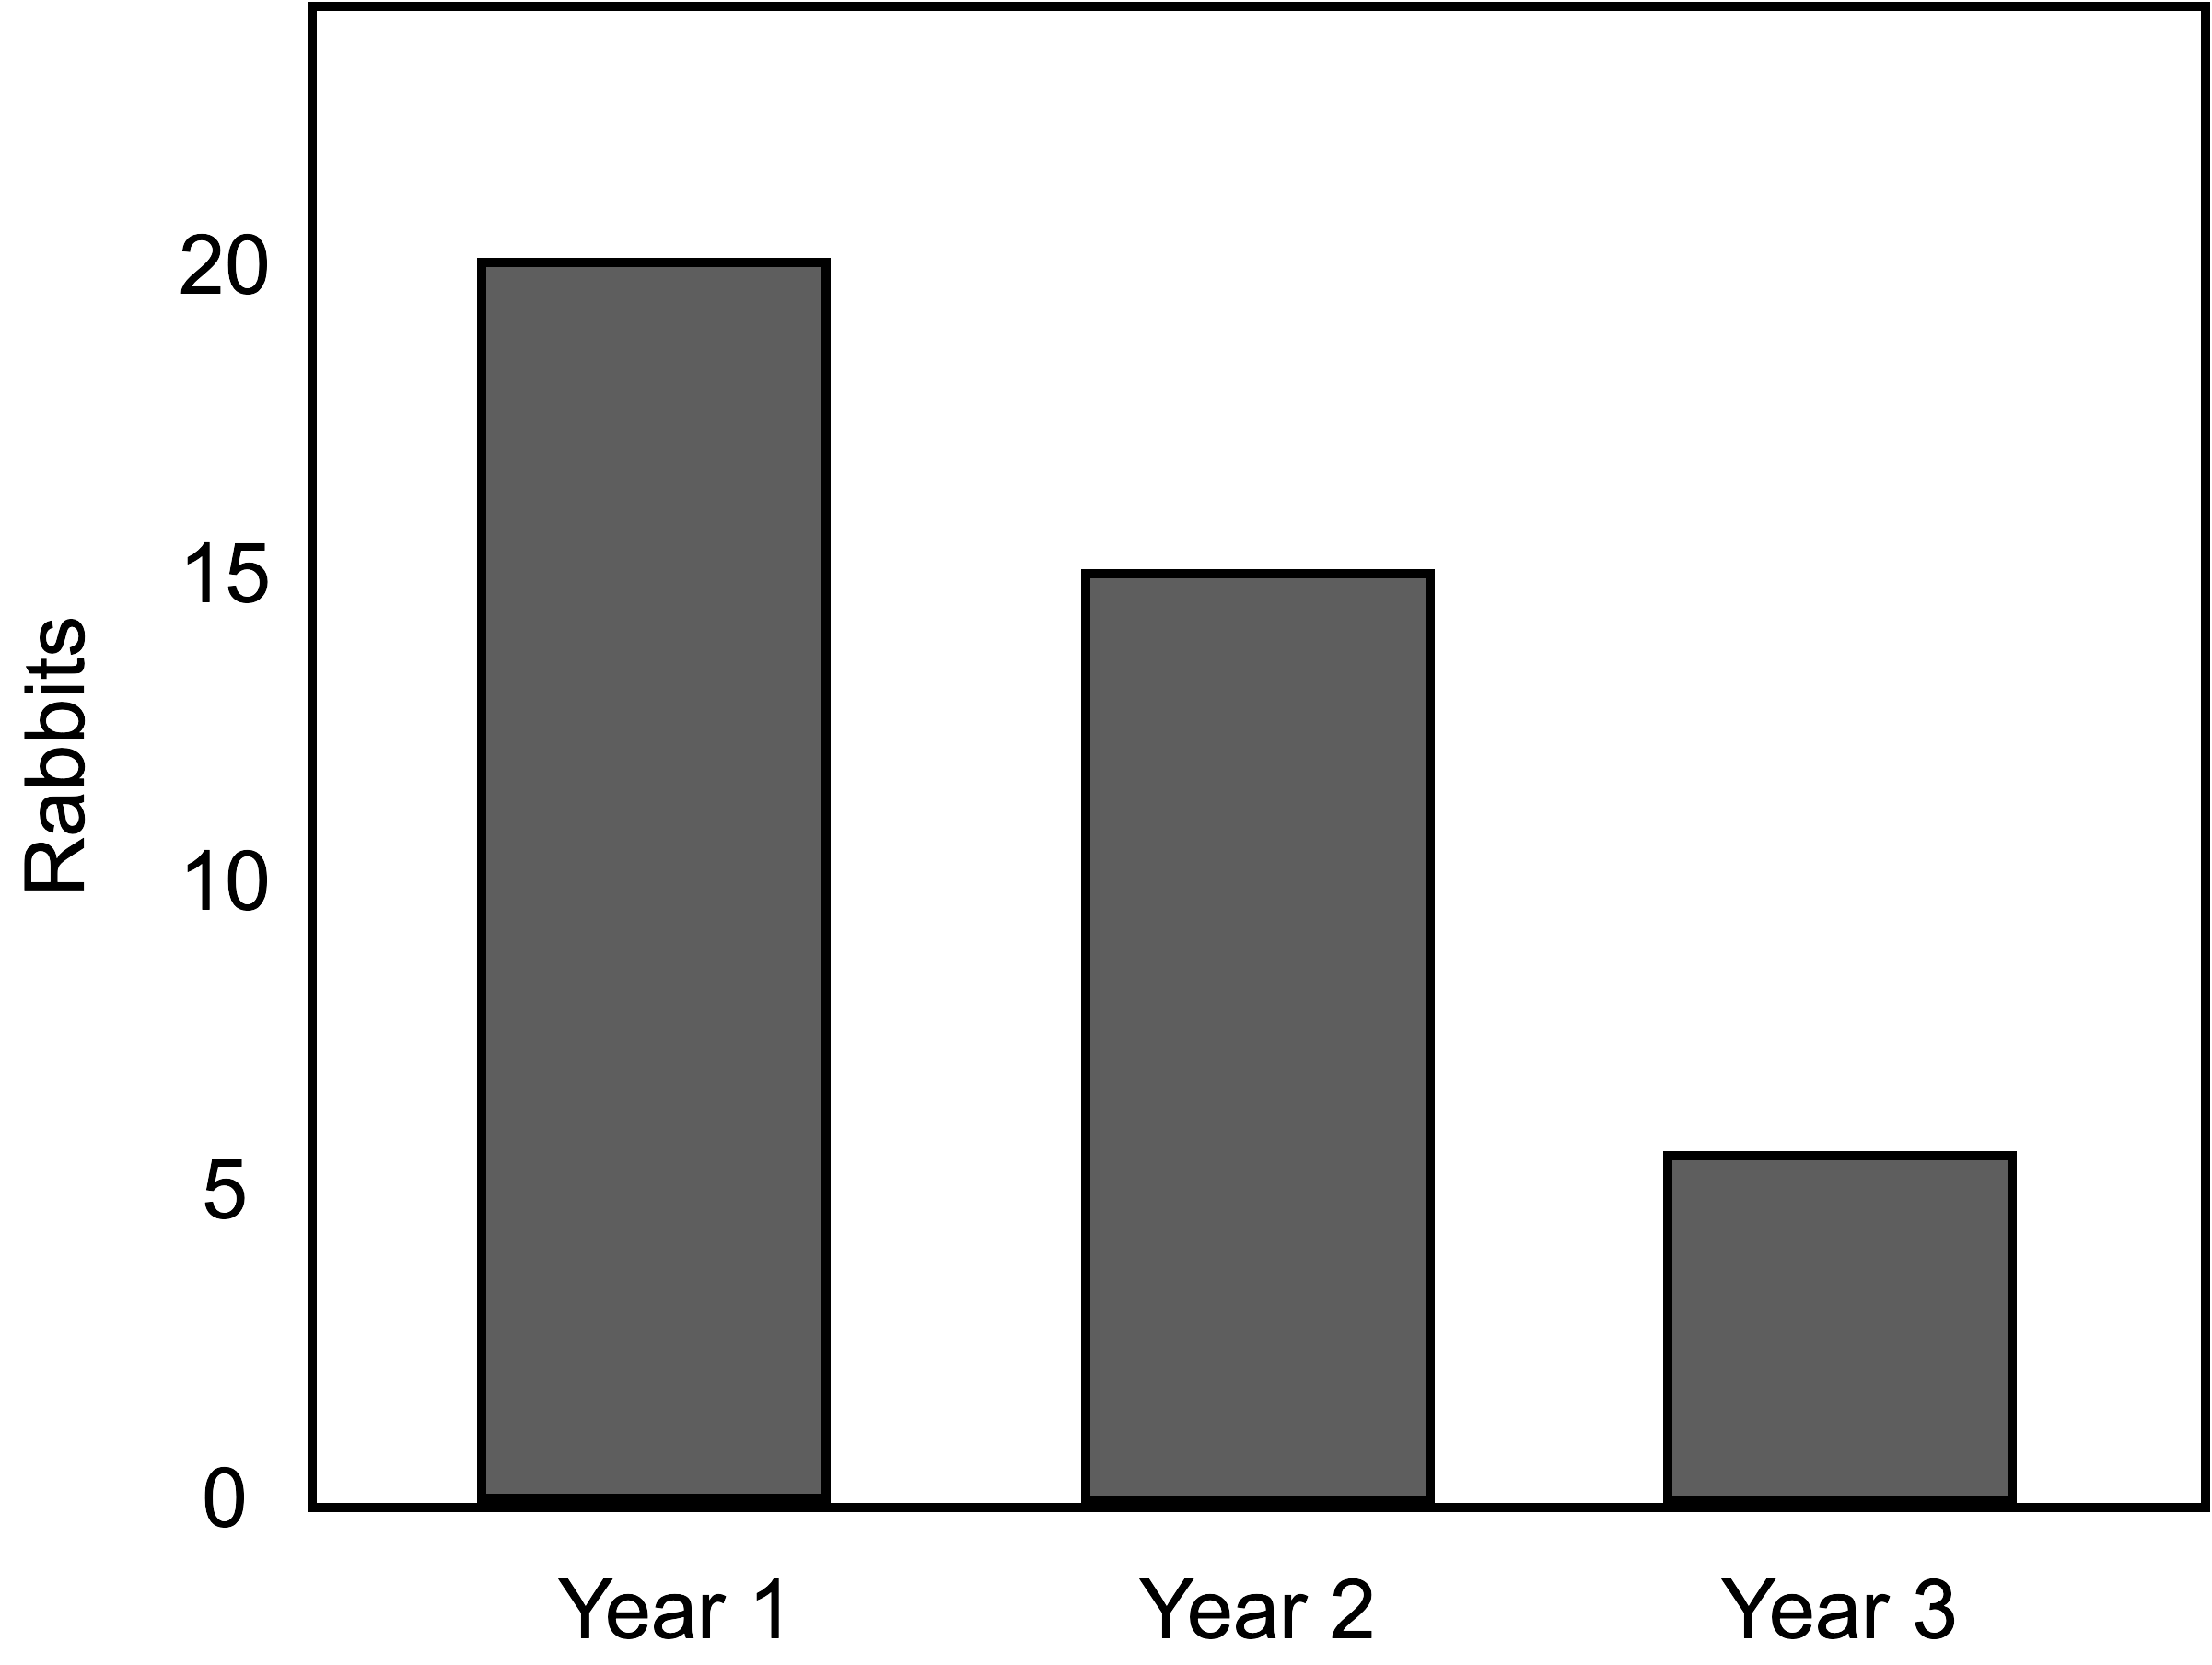
3. Explain that the trend or year-by-year results can be shown on a bar graph. Encourage students to use the data to show year by year, the number of rabbits who survived.
If necessary, discuss the fact that years should be shown on the x-axis, and the number of rabbits who survived each year should be shown on the y-axis. If necessary, refer students to the Procedural Tool Creation and Completion of a Bar Graph.
a. Allow students approximately 5 to 10 minutes to create the graph in Problem 21 of the Student Data Record.
b. Reproduce the appropriate axes on the board. Review the data as a class and complete the graph. Sample data are shown below:
______________________________________________
SLIDE VECO5-post-5
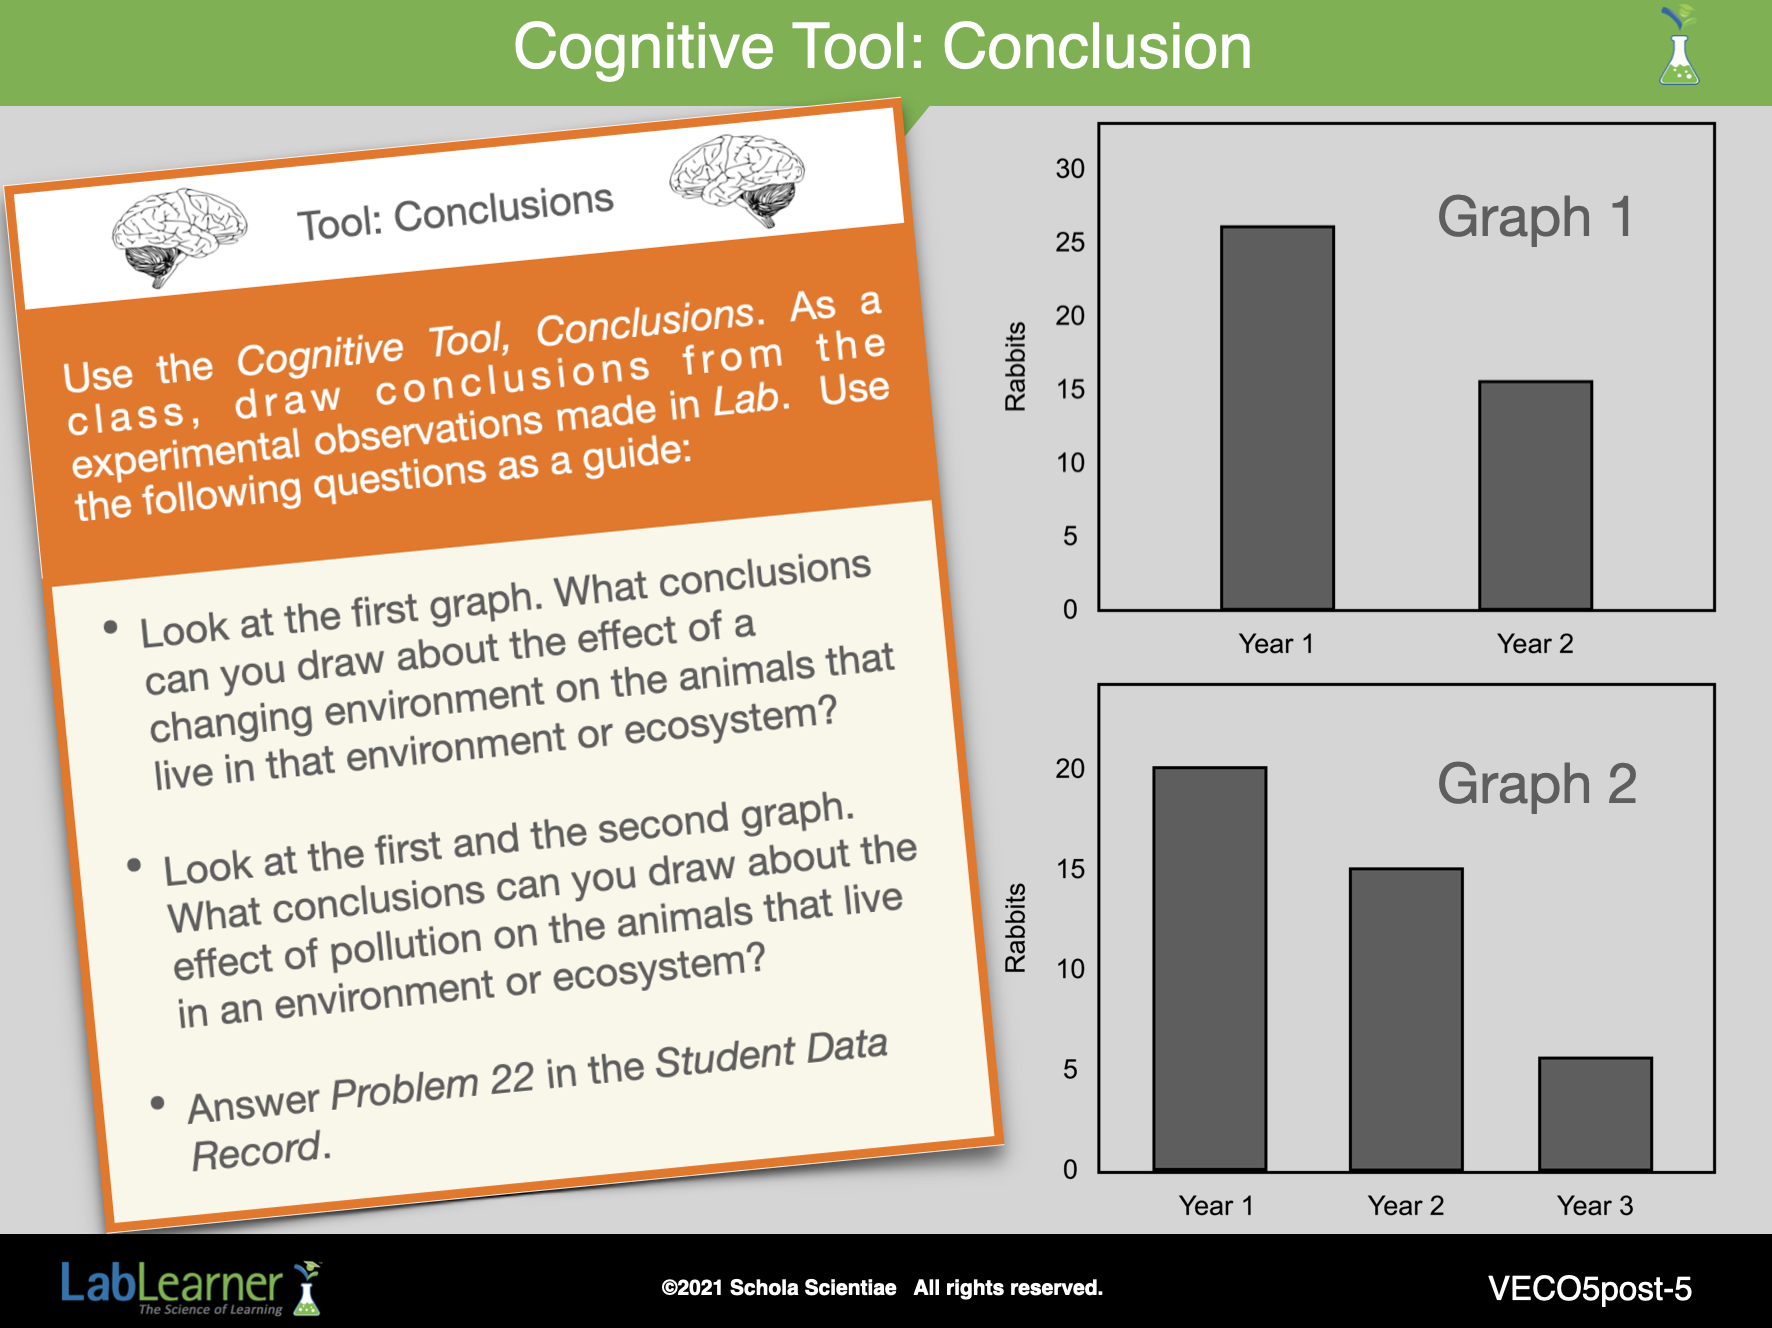
4. Ask students to carefully review their graphs and to reflect upon what the data tells them.
Ask students to carefully review their graph and to reflect on whether or not they see a trend or a year-by-year pattern from examining the data. Comment to students that oftentimes, graphs can help you come to a conclusion. Encourage students to verbalize conclusions based on their knowledge of what the x and y axes represent.
______________________________________________
SLIDE VECO5-post-6
D. The following scenario introduces students to the concept of the concentration of pollutants per amount of body weight. Once pollution reaches a particular concentration it can cause death to animals. Work through the following scenario and calculations as a class.
1. Ask students: What would happen if another animal ate the rabbits that had eaten some polluted food? Student answers will vary.
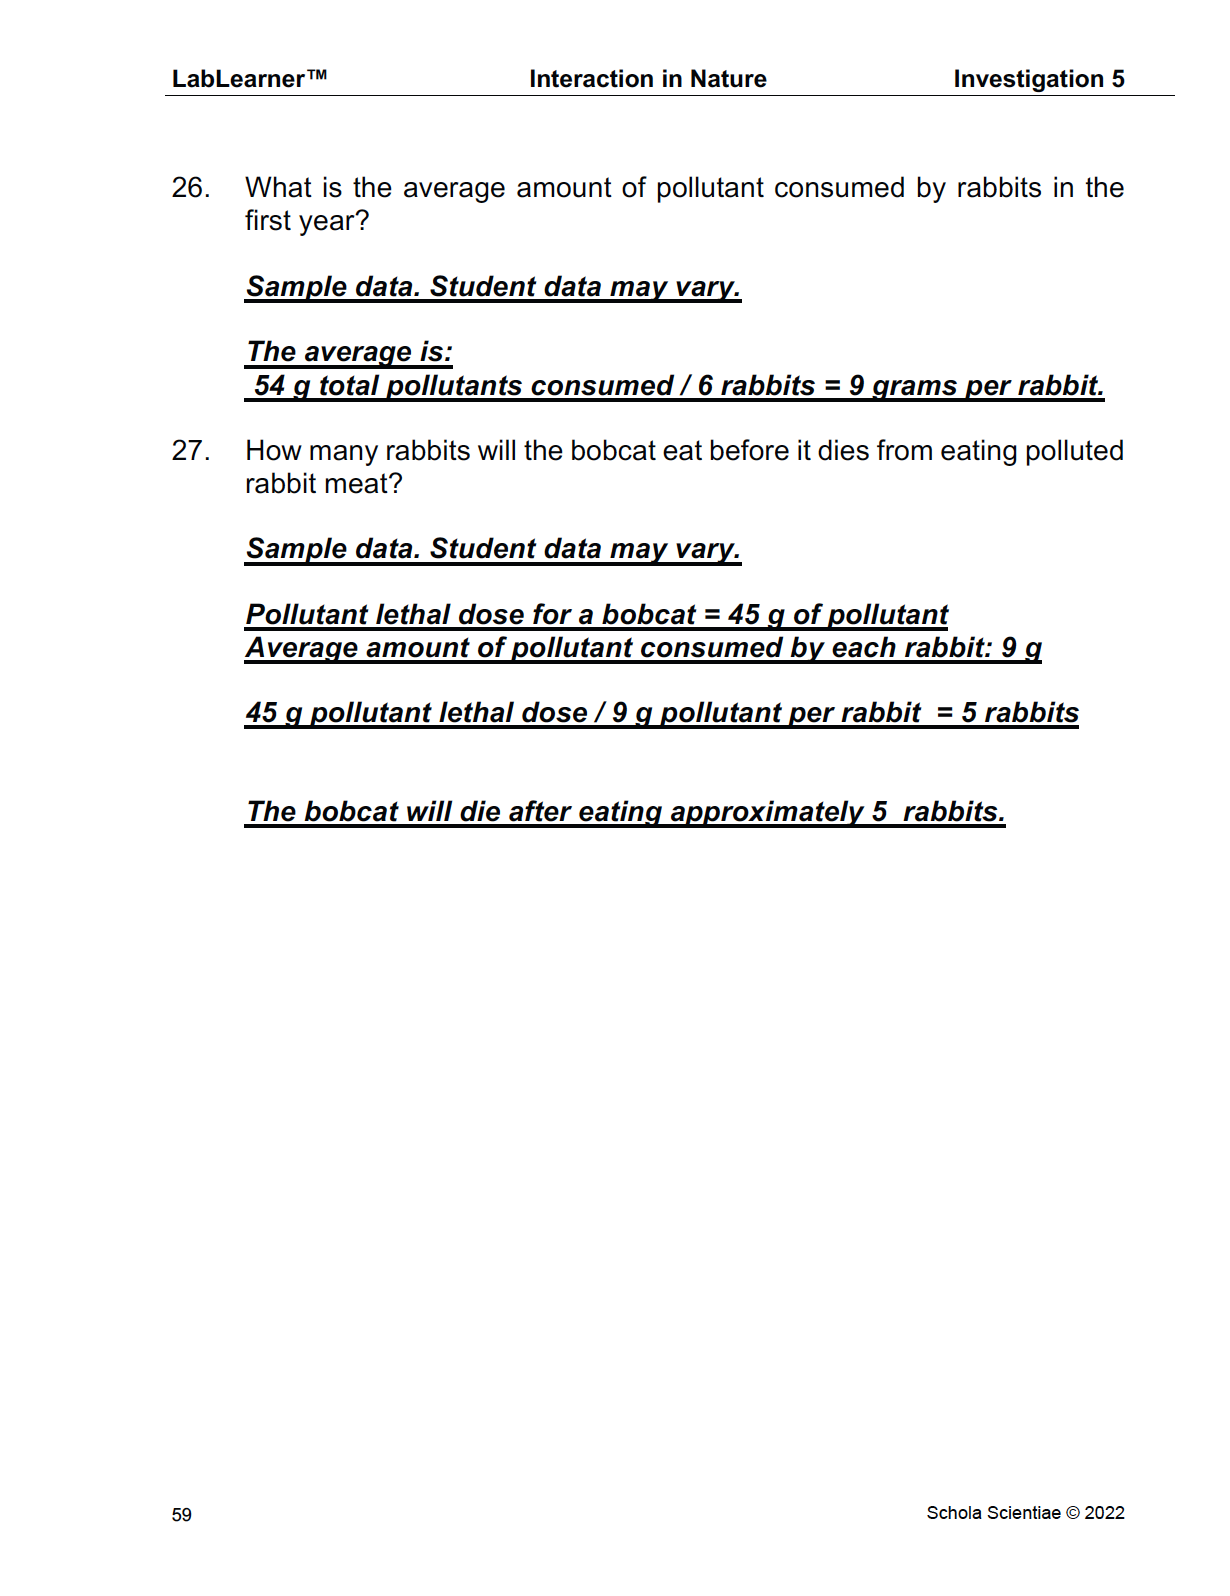
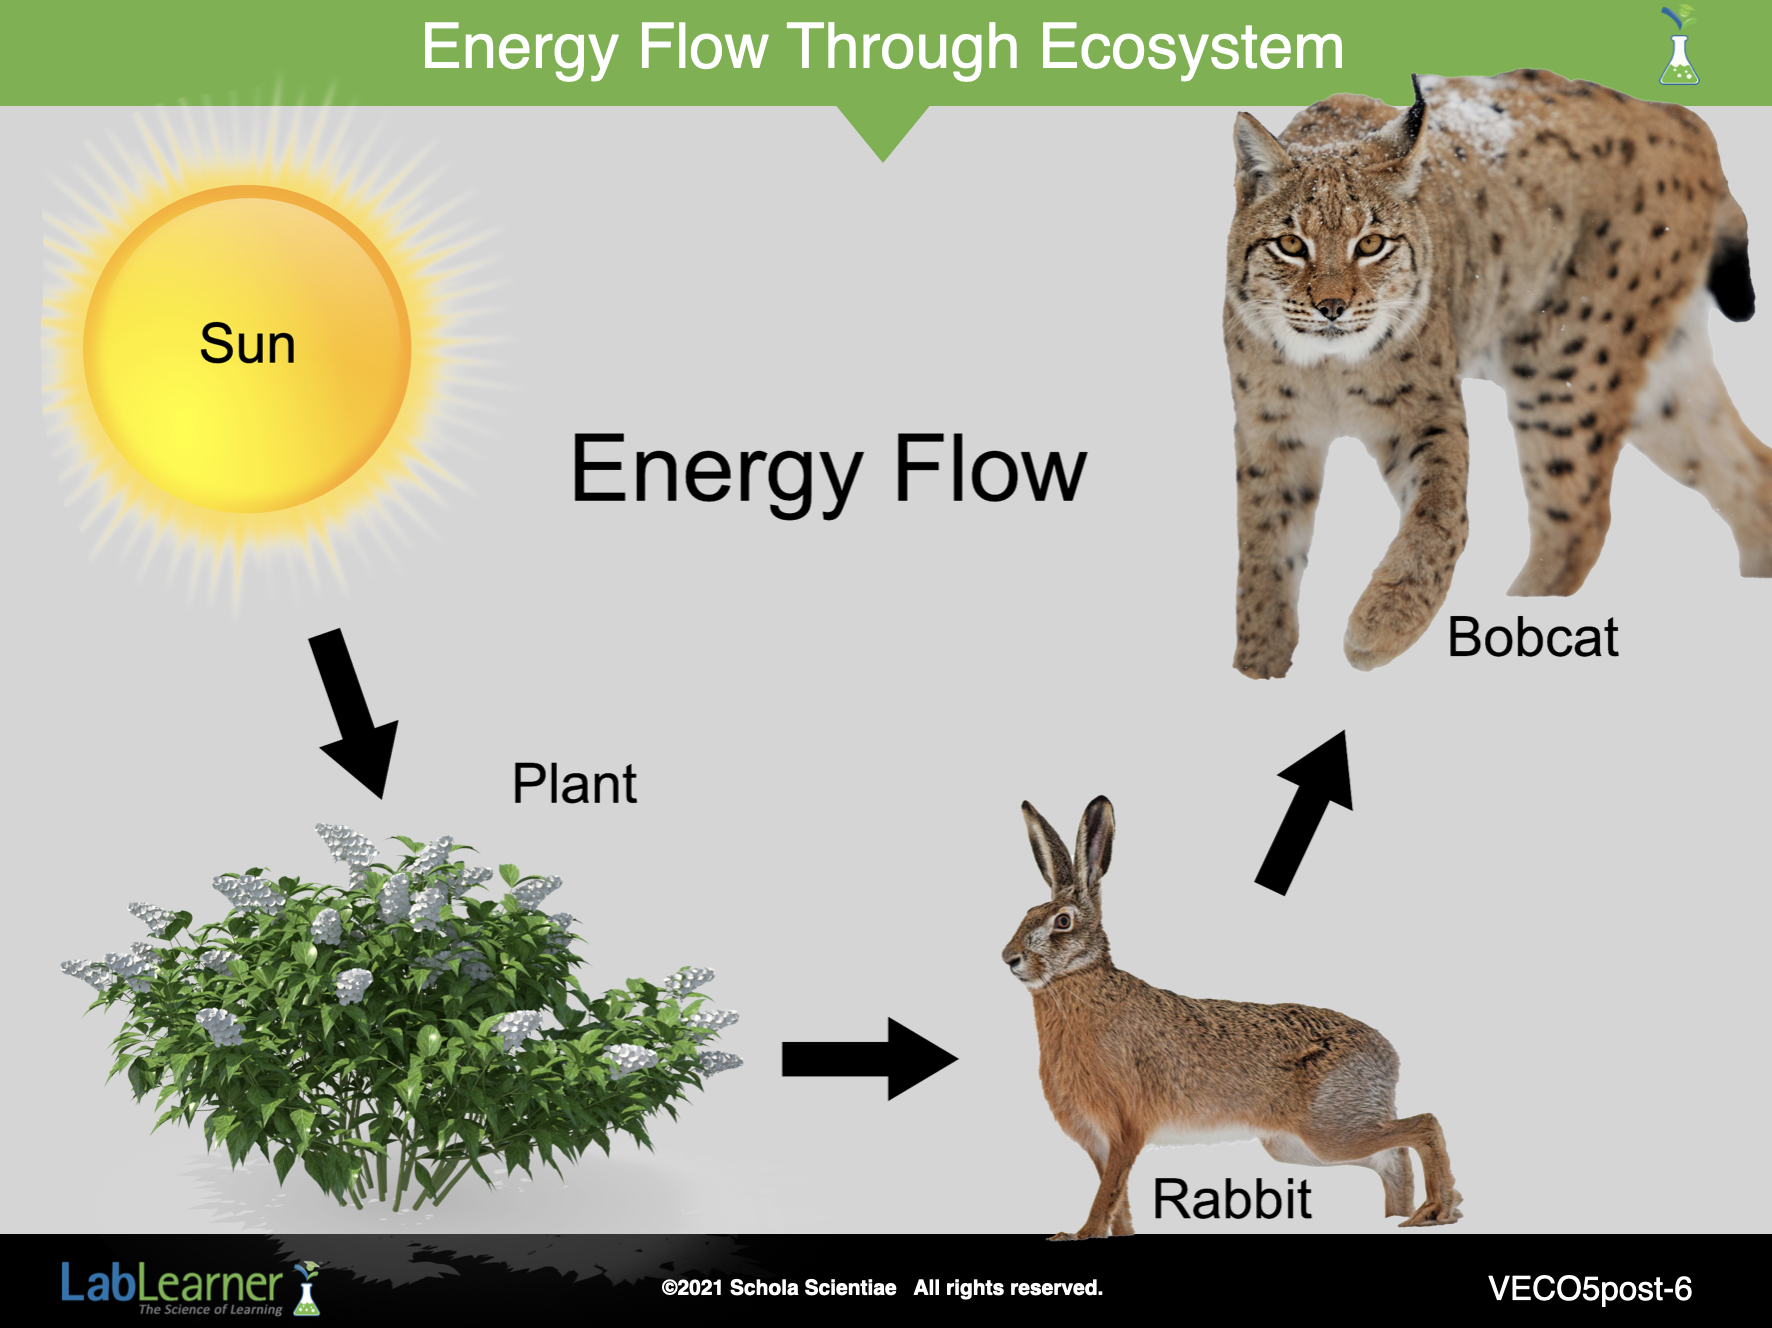
2. Direct students to examine this slide that shows the relation between plants, rabbits, and a rabbit predator, the bobcat.
Notice that it is labeled “Energy Flow”. This is because plants get energy from the Sun through photosynthesis. Rabbits then eat plants and obtain energy for their own growth from them. Finally, to obtain energy to sustain their health and growth, the bobcat is a predator that gains energy by hunting and eating rabbits. Thus, the energy from the Sun provides the energy required for the life of plants, rabbits, and bobcats.
______________________________________________
KEYS: POSTLAB