Teacher Portal:
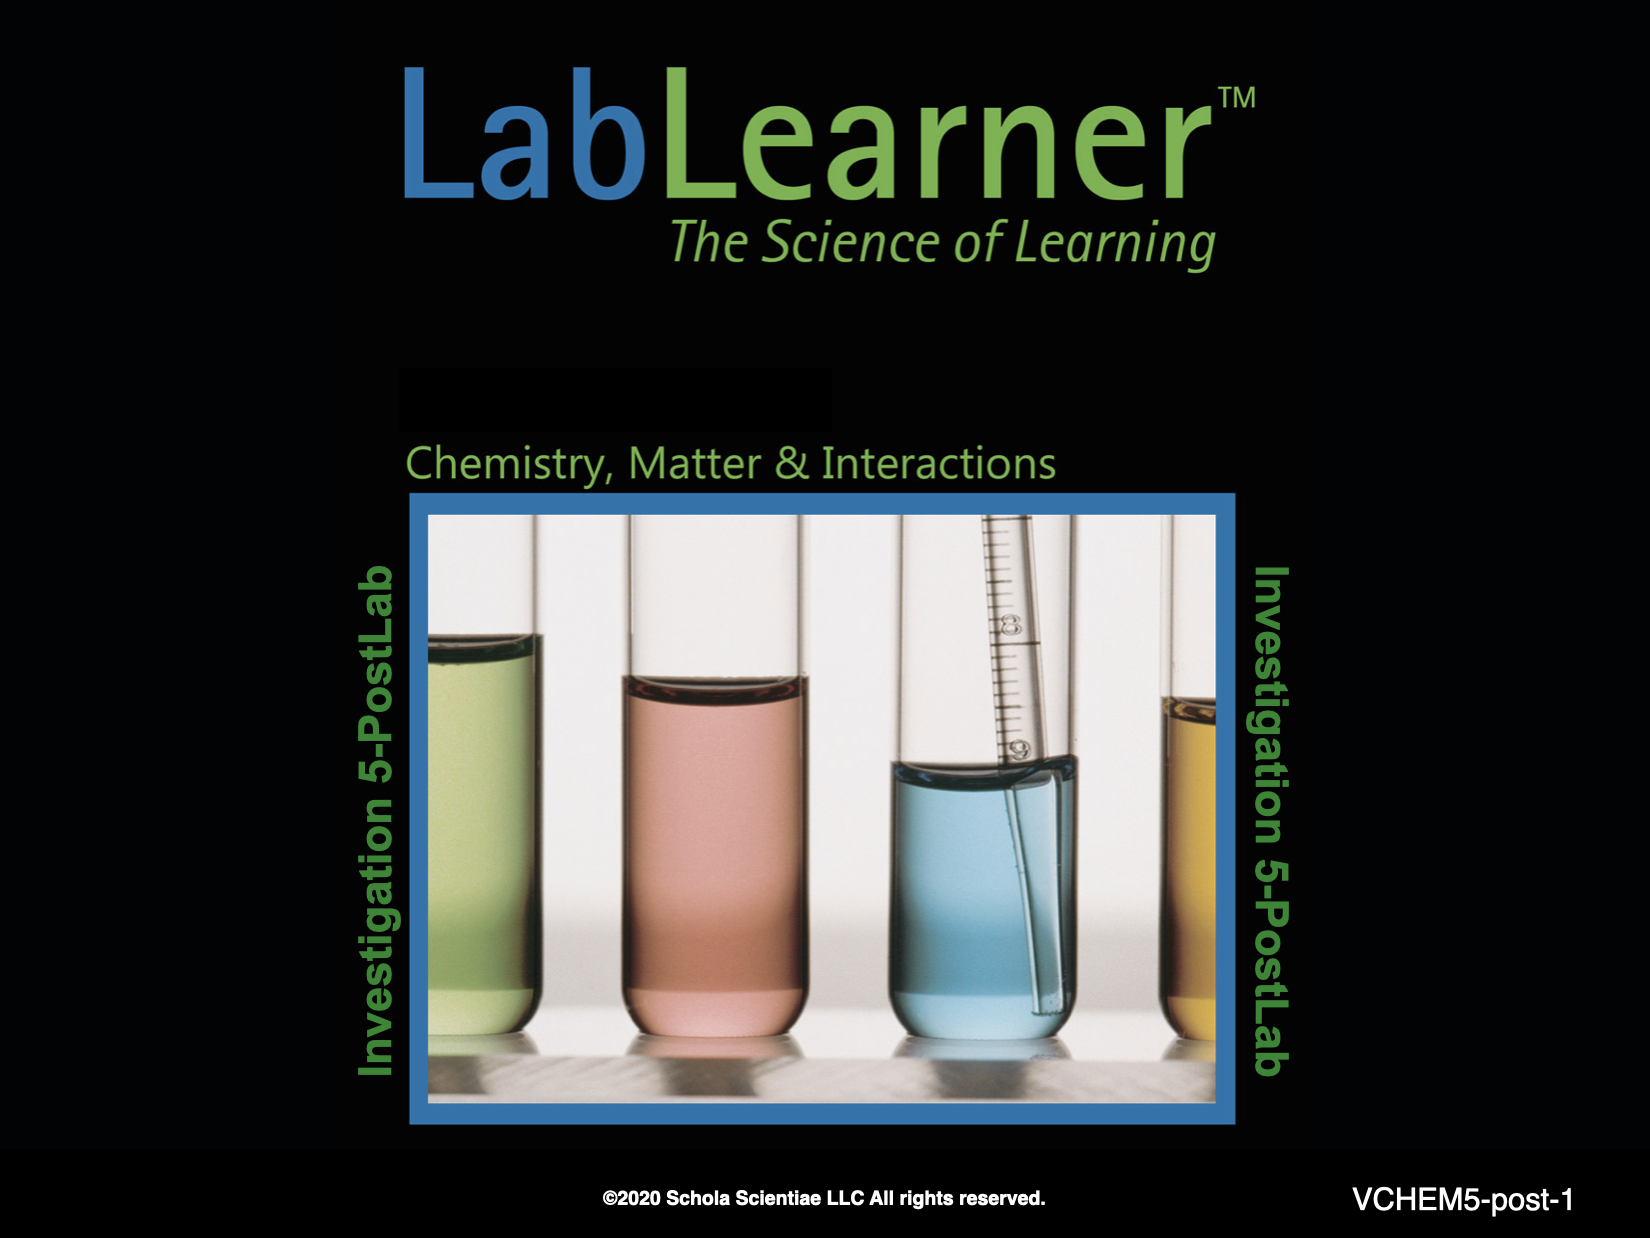
Chemistry, Matter and Interactions
Investigation 5 – PostLab
 ASK WHY
There are five major branches of chemistry today – organic chemistry, analytical chemistry, physical chemistry, inorganic chemistry, and biochemistry. Biochemistry is a branch of chemistry that deals with cells and living systems. Biochemistry studies inheritance (DNA and RNA molecules), metabolism, interactions between cells, and cell growth and repair.
BRANCH OUT
According to the American Chemical Society, “Biochemistry” explores chemical processes related to living organisms. It is a laboratory-based science combining biology and chemistry.
“Biochemists study the structure, composition, and chemical reactions of substances in living systems and, in turn, their functions and ways to control them.”
PRINT IT
Use your browser to download a printable PDF as help during the slide presentation and to make additional notes. In your browser, go to File > Print and then choose to save as PDF.
NAVIGATE IT
Once the slide presentation is launched
- use your left and right arrows to advance or go back in the slide presentation, and
- hover your mouse over the left edge of the presentation to get a view of the thumbnails for all the slides so that you can quickly move anywhere in the presentation.
- Click HERE to launch the slide presentation for the CELL.
SHARE IT
SLIDE VCHEM5-post-1
Begin the analysis portion of the Investigation by asking students to summarize the Trials performed in the lab.
Encourage students to use the Recall tool to think of the experiments performed in the lab. Remind students that using the Summarize tool allows them to look only at the most important parts of an experiment instead of looking at all of the ideas.
Students can use a summary to help them understand our experiments. Review the steps of a summary:
1. Recall and gather data.
2. Choose the most important information.
3. Present or restate the most important information.
______________________________________________
SLIDE VCHEM5-post-2
The following questions may help students Recall and Summarize their experiments:
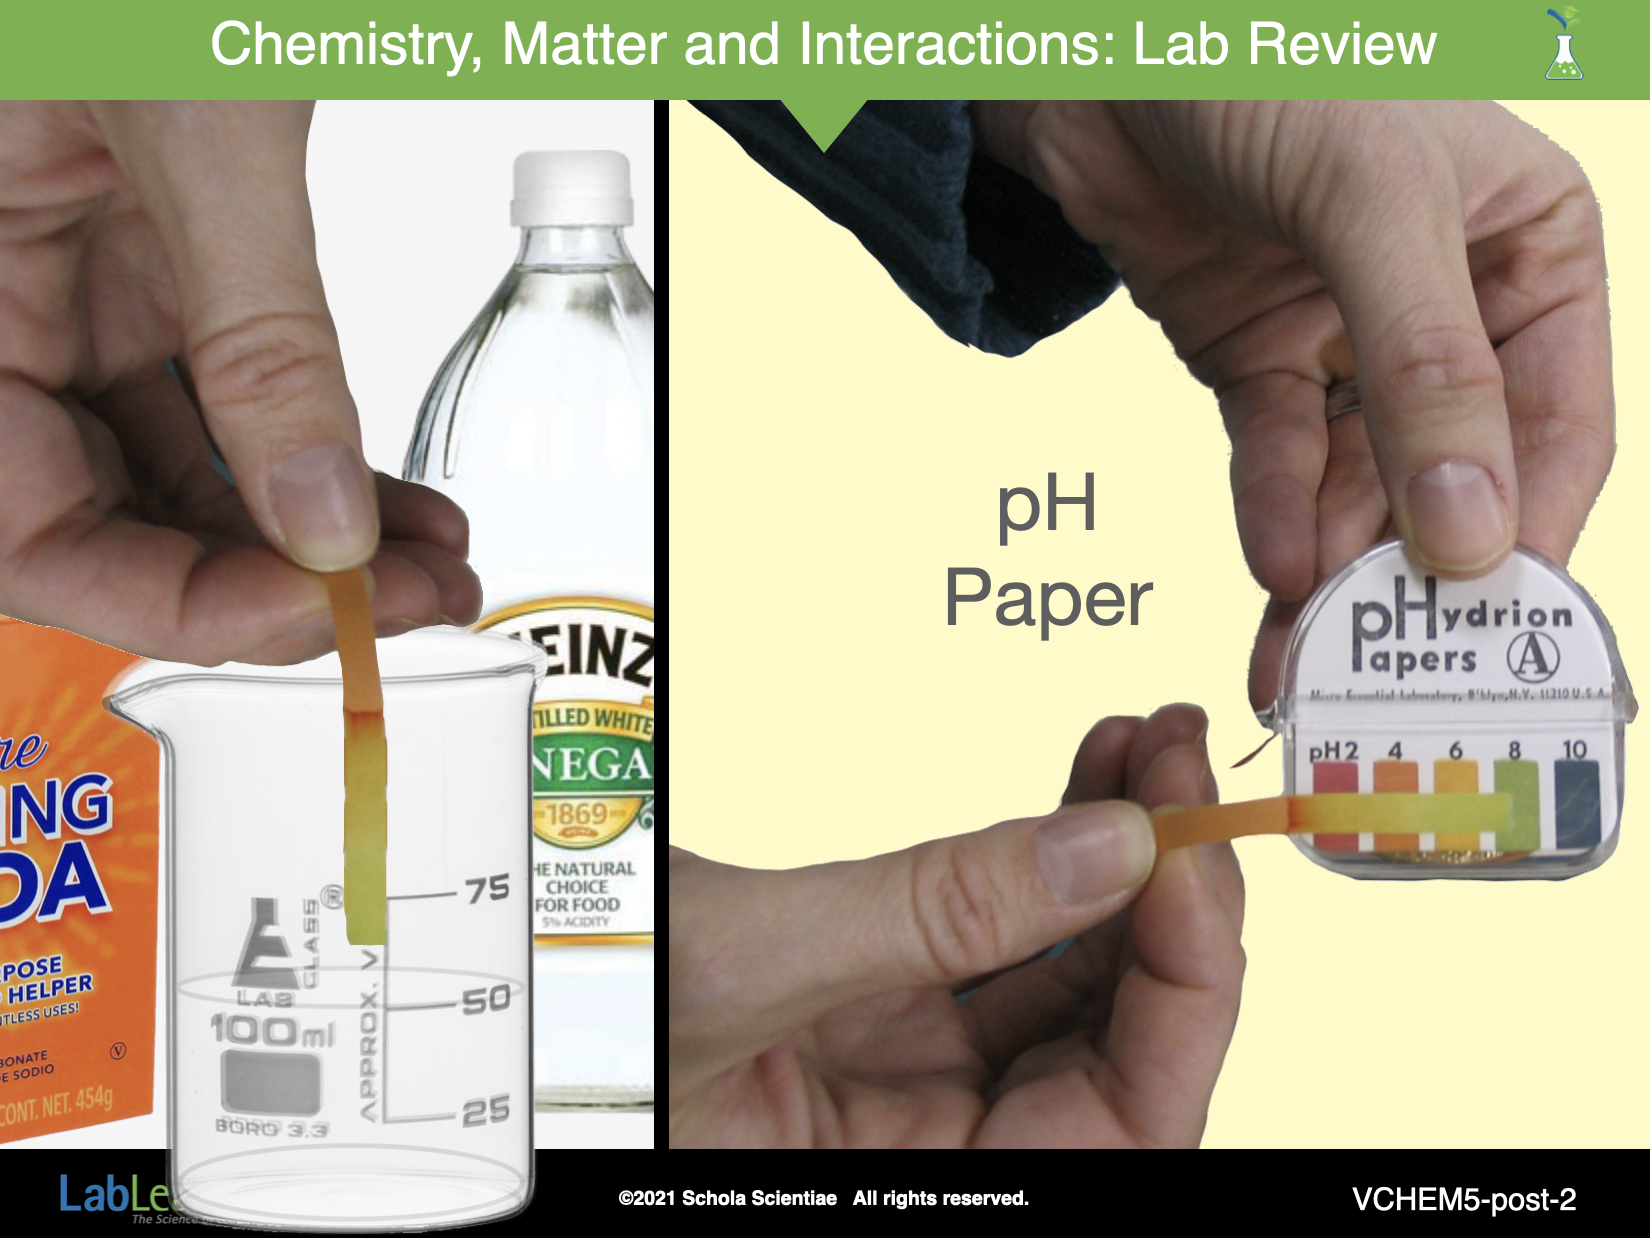
Ask students: What property of matter did you measure during the experiments? Students investigated the property of pH using pH paper and a pH scale.
Ask students: Would you describe pH as qualitative or quantitative? Why? pH is described as a quantitative measurement because it is measured using a scale.
Ask students: How did you measure pH? pH was measured by dipping a strip of pH paper into a liquid substance. The chemical properties of the substance caused the strip to change color. The color of the paper was compared to the color key on the dispenser, and pH was determined.
Ask students: What did you learn about the substance by testing the pH? What words did you
use to describe each substance after you tested the pH? Students learned whether each substance was an acid, a base, or a neutral substance.
Ask students: How did you know whether a substance was an acid, a base, or a neutral substance? Students used the pH scale to determine whether each substance was an acid, a base, or a neutral substance. If a substance had a pH between 1 and 6, it was an acid. If it had a pH of 7, it was neutral, and if the pH was between 8 and 14, it was a base.
______________________________________________
SLIDE VCHEM5-post-3
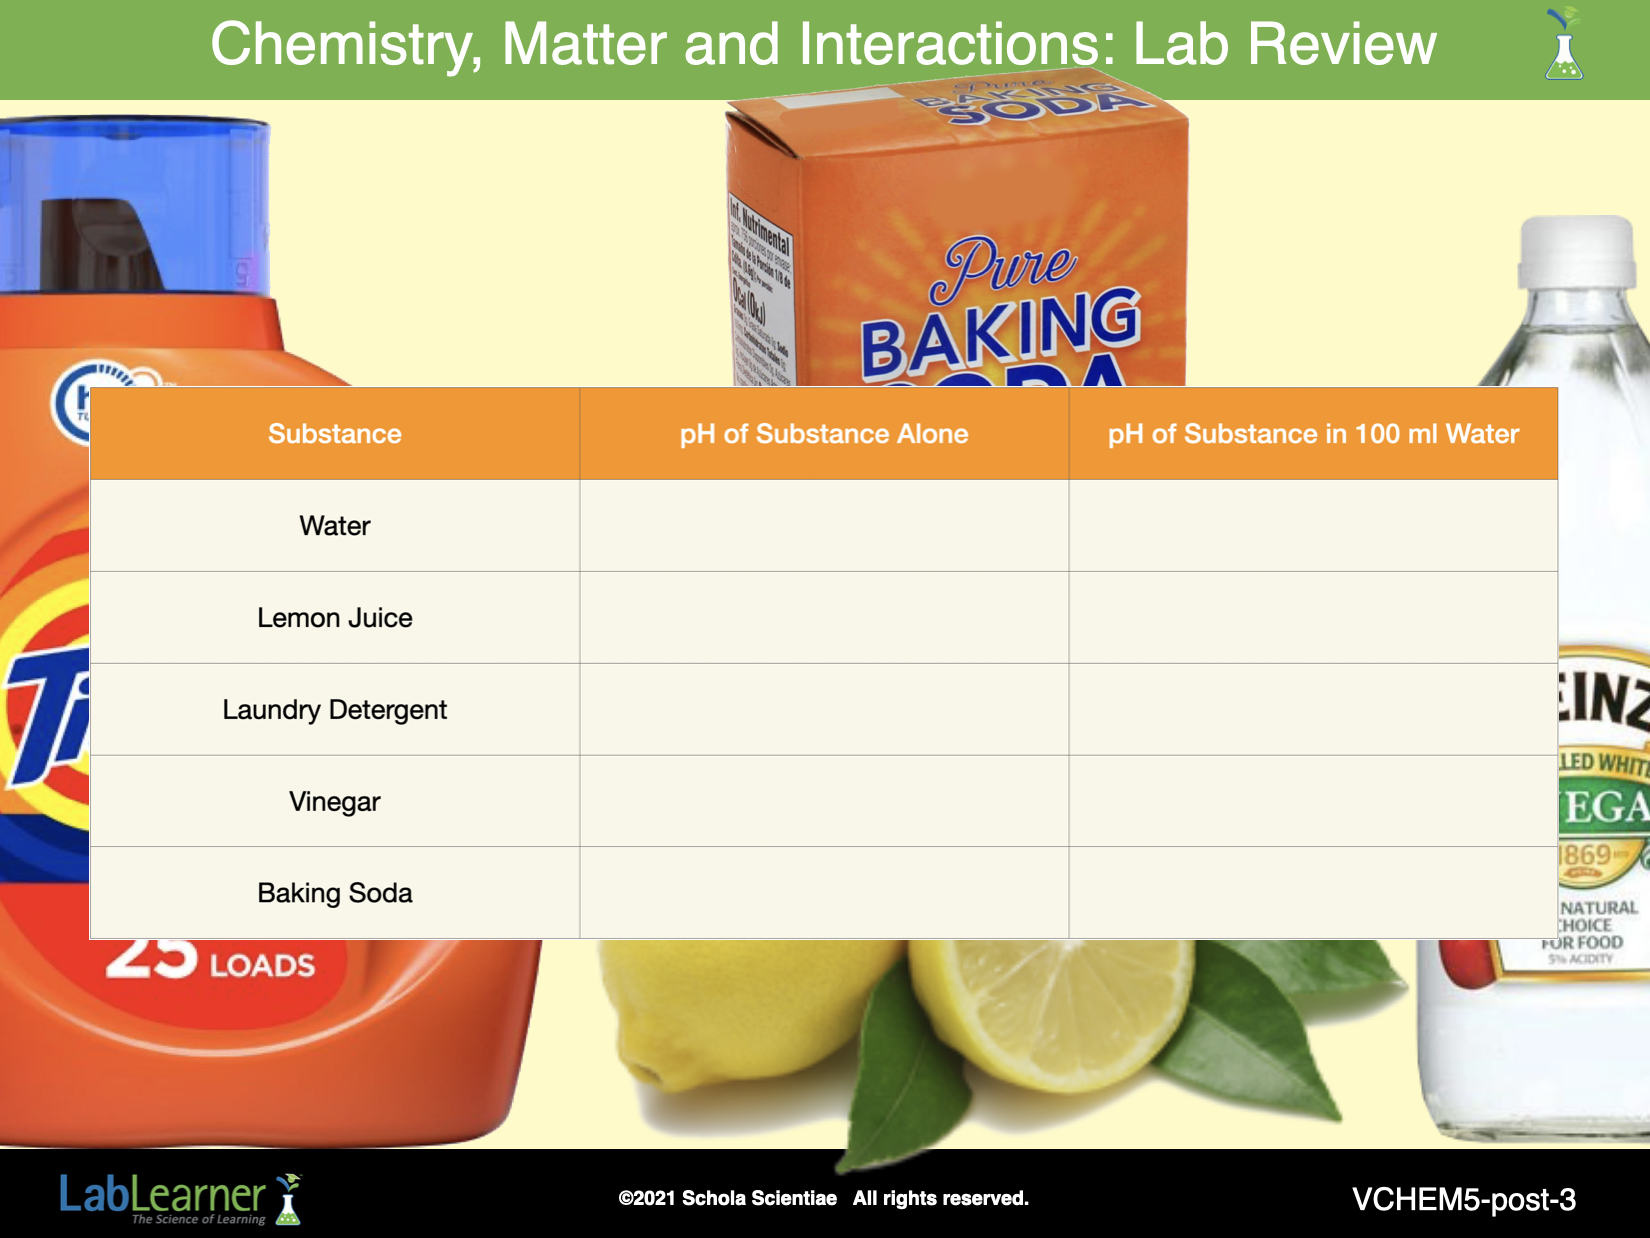
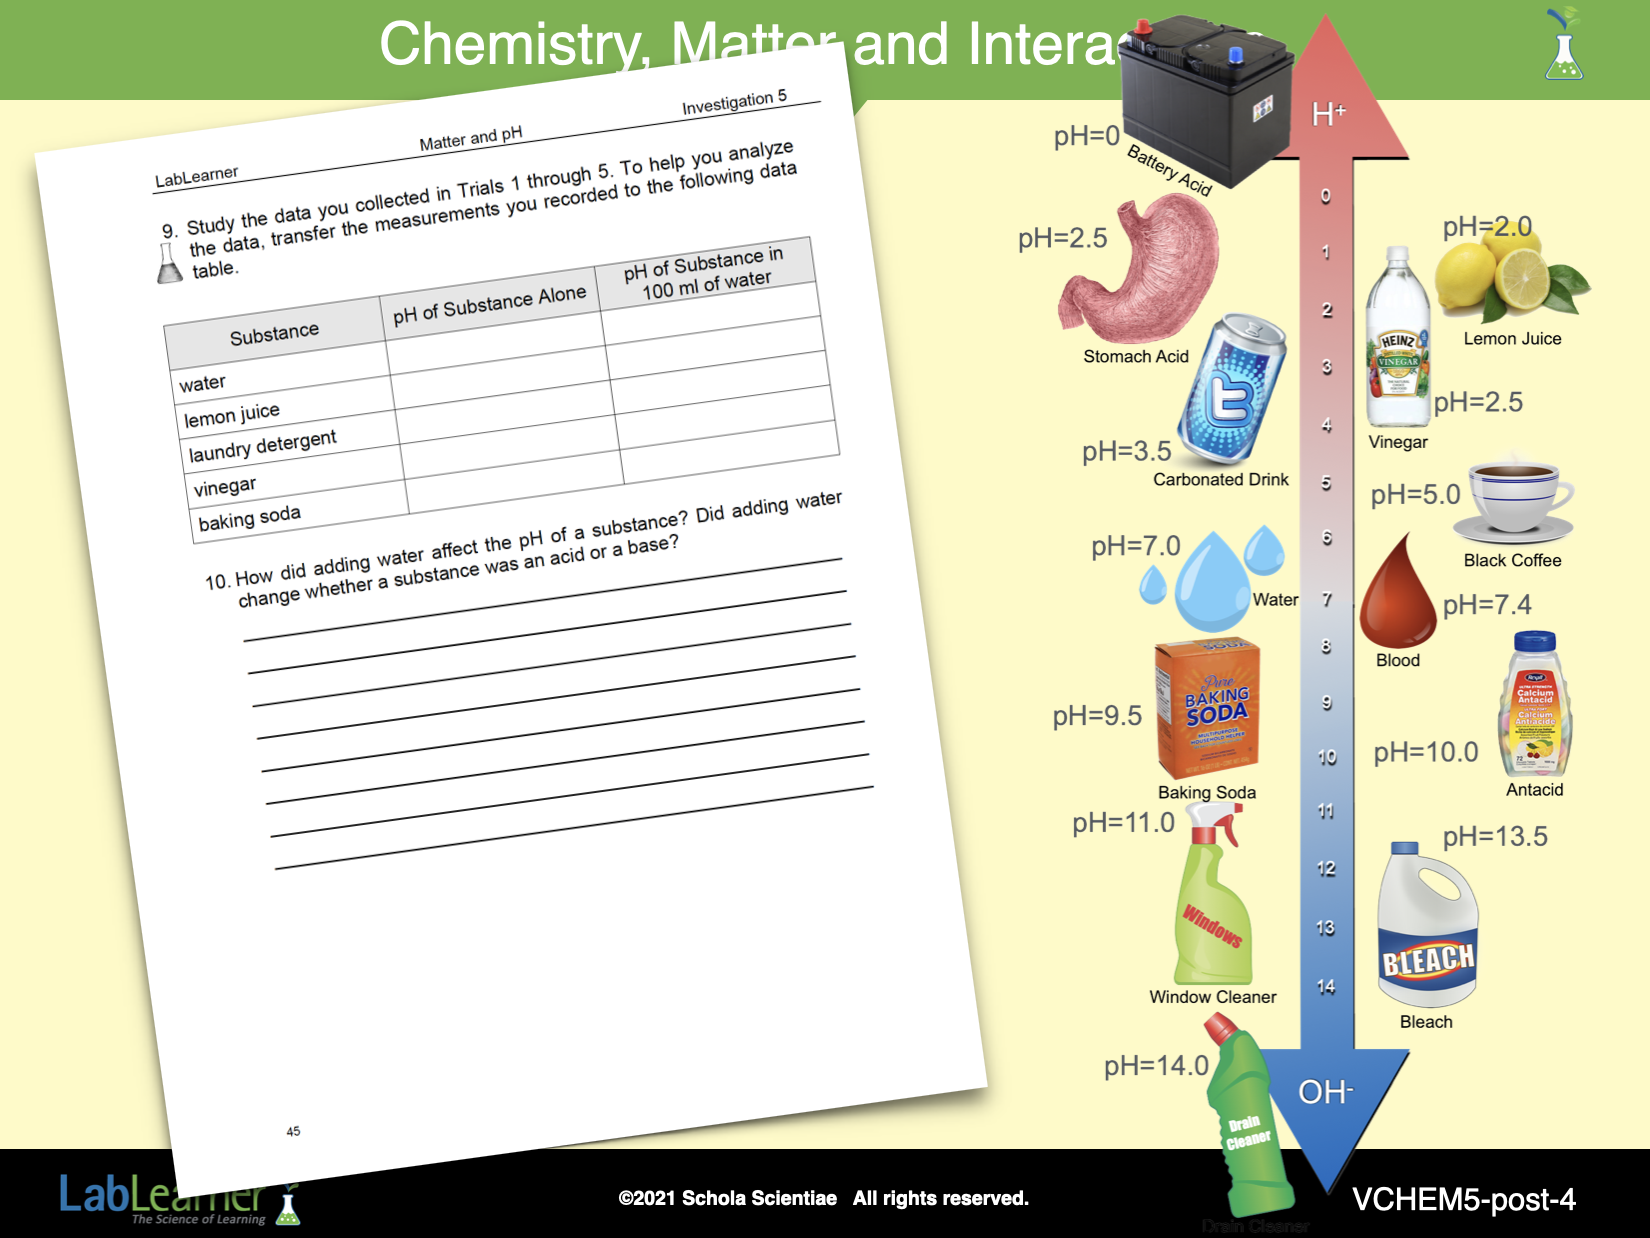
Continue the review of students’ results by facilitating the creation of a Data Table to aid in the analysis and the creation of a summary.
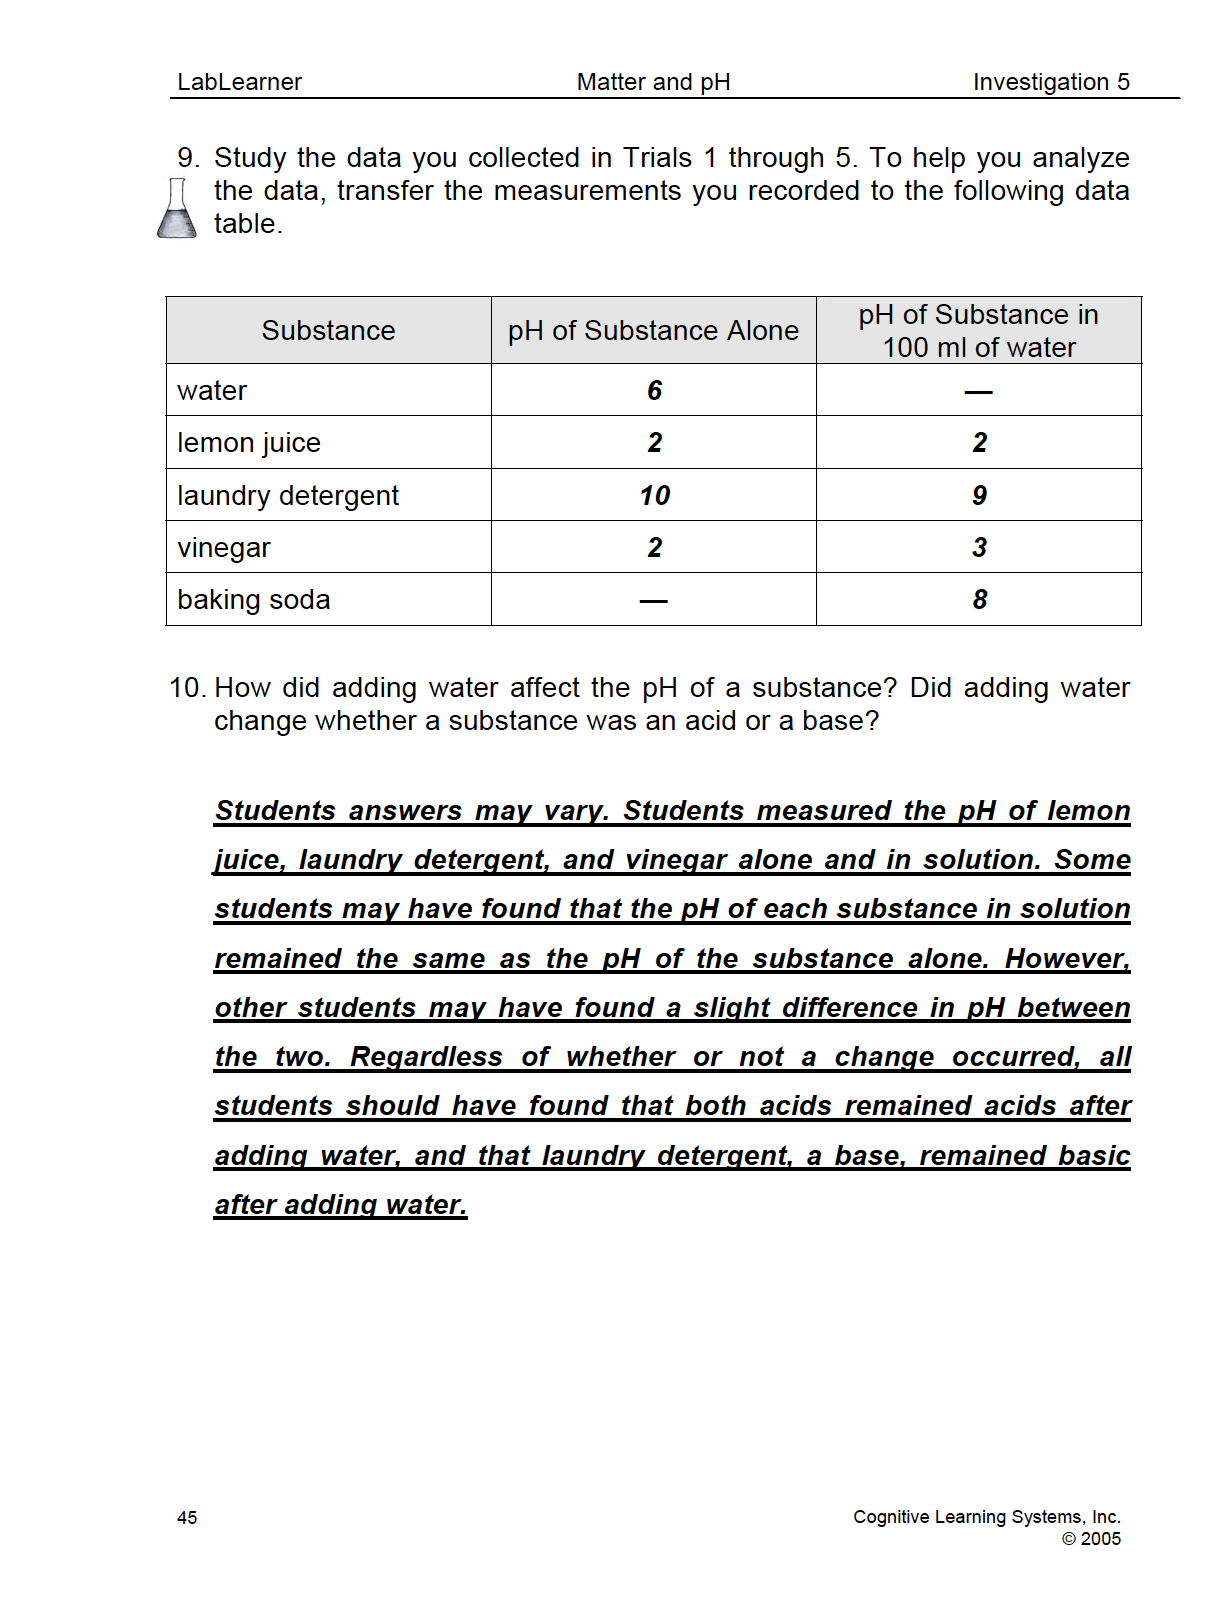
Tell students that Data Tables help to organize data and present data in a way that aids in analysis. Encourage students to look at Trials 1 through 5 in their Student Data Record. In their Student Data Record, those Trials cover five separate pages. When trying to draw conclusions, students must flip between pages to find data. However, by transferring data to a Table, students can study all of their results simultaneously.
Instruct students to look at the Data Table in Problem 9 in their Student Data Record. Point out the three columns in the Table. The first column supplies the list of substances that were tested. The second column provides space to record the pH of the substance, and the third column provides a place to record the pH of the substance when made into a solution in 100 ml of water.
Encourage students to work with their lab group to record the data from Trials 1 through 5 in the Table in Problem 9 of their Student Data Records. Allow sufficient time to complete the Table.
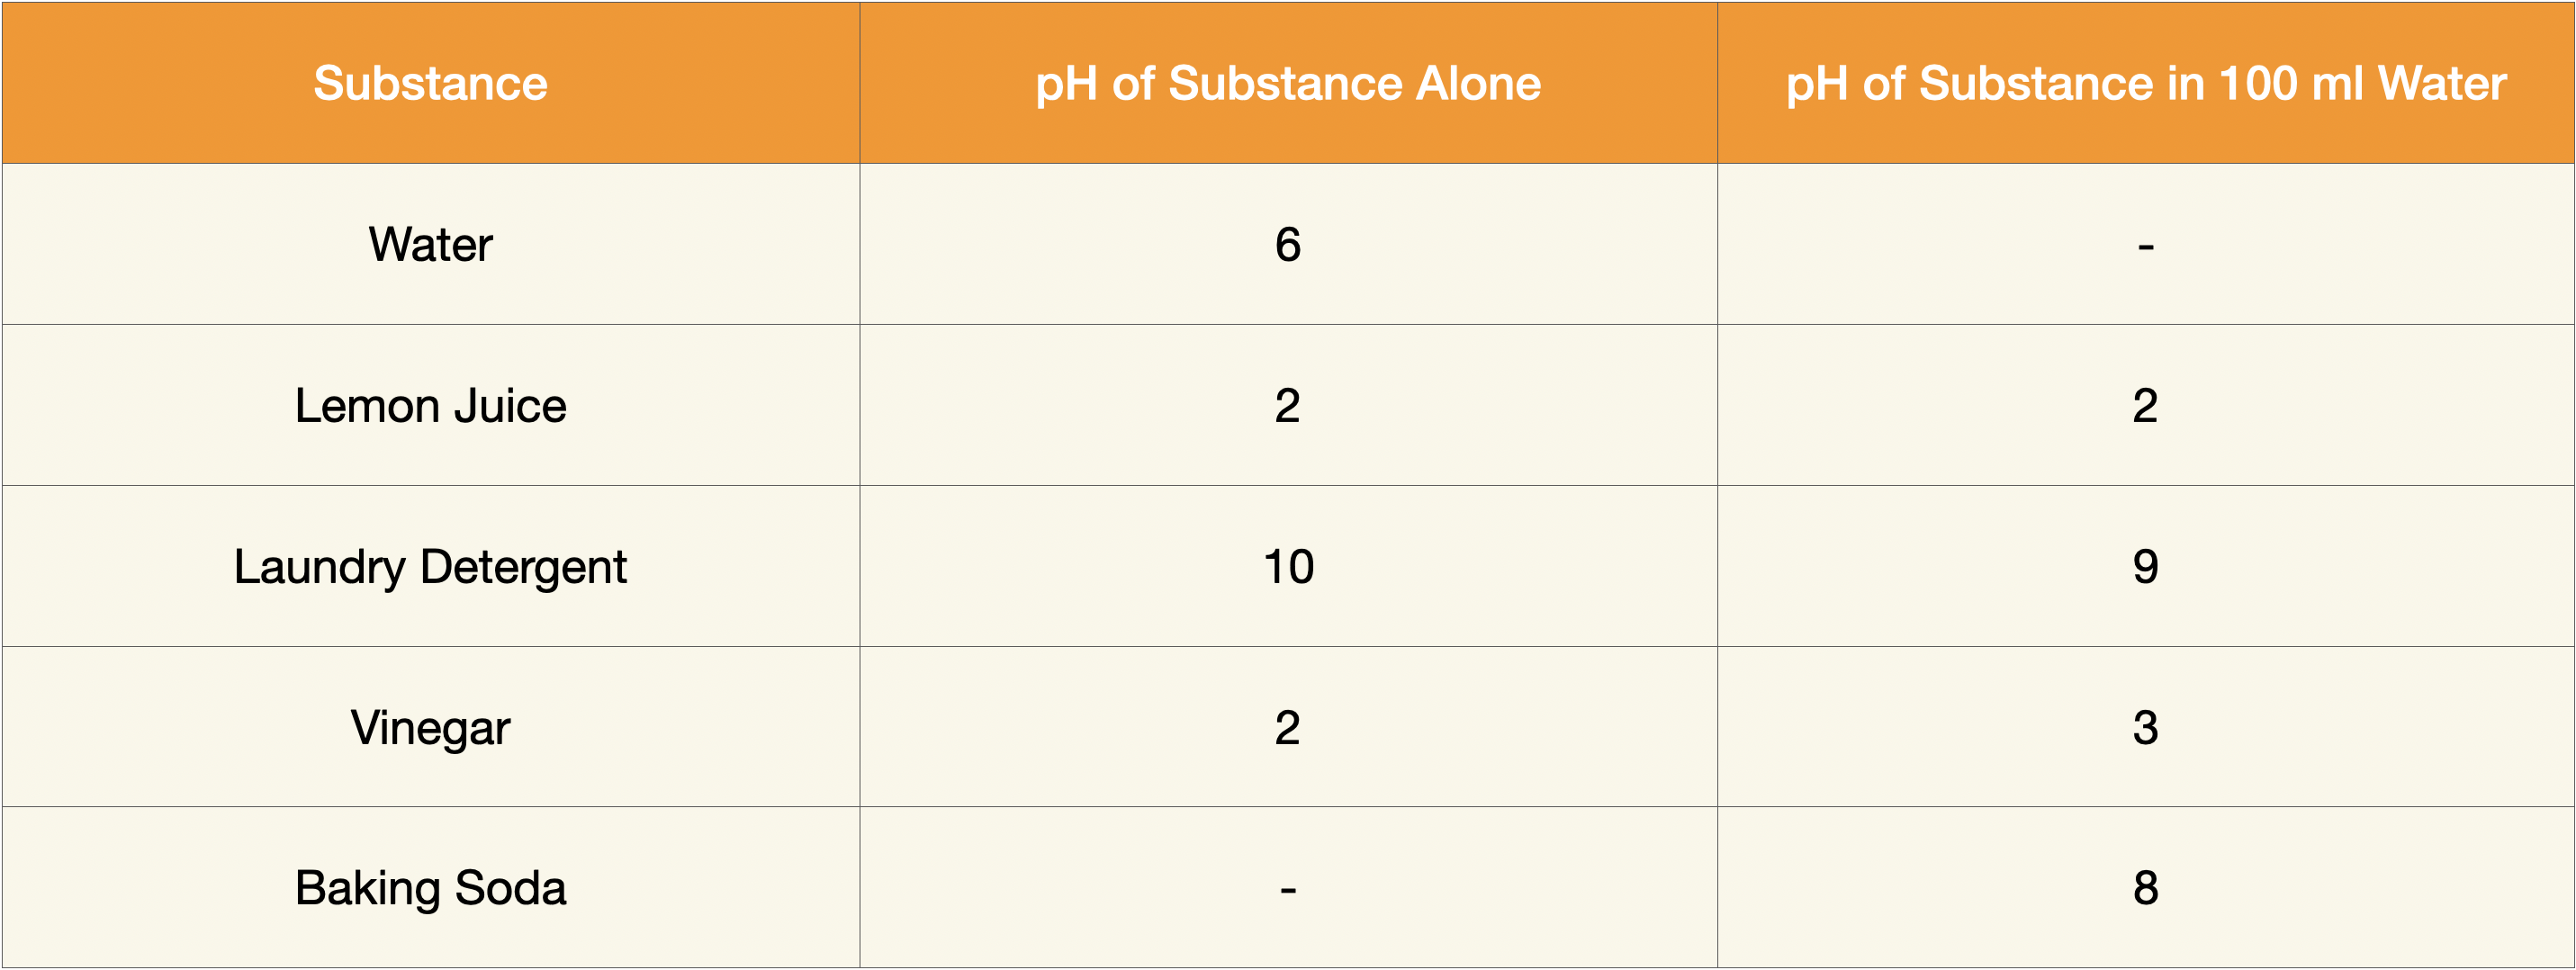
Below is the Data Table with sample data included for teachers:
______________________________________________
SLIDE VCHEM5-post-4
Tell students to use the data recorded in the table to draw conclusions from Trials 1 through 5. Ask the following questions to aid in the analysis and to help identify important information for their summary:
Ask students: Based on your data, which of the substances you tested was/were basic? Were any of the substances strong bases? Based on the pH, baking soda and laundry detergent were basic. Both substances had a pH greater than 7. Although neither of the bases would be classified as strong bases, laundry detergent (pH of 10) was a stronger base than baking soda (pH of 8).
Ask students: Which of the substances was/were acidic? Were any of the substances strong acids? Student answers will vary. Both vinegar and lemon juice had a very low pH, indicating that they are strong acids. Students may have also found water to be slightly acidic.
Ask students: Which of the substances was/were neutral? Student answers will vary. Students may have found water to be neutral.
Compare the values recorded in the second column of the table to those recorded in the third column. Based on these values, what effect did adding 100 ml of water to 10 ml of substance have on the pH of each substance? Did any substance that was acidic become basic after adding water? Did any substance that was basic become acidic after adding water? (Encourage students to record their answers in Problem 10 of the Student Data Record). Student answers may vary. Students measured the pH of lemon juice, laundry detergent, and vinegar alone and in solution. Some students may have found that the pH of each substance in solution was the same as the pH of the substance alone. However, other students may have found a slight difference in pH between the two. Regardless of whether or not a change occurred, all students should have found that both acids remained acids after adding water, and that laundry detergent, a base, remained basic after adding water.
If students noticed a slight difference in the pH of the pure substance and the substance in solution,
Ask students: Why did a slight change occur? As the water was added, the pH of a solution may have moved toward the pH of water, or closer to a pH of 6 or 7. However, because water is neutral rather than a strong acid or a strong base, any change that did occur was minimal.
______________________________________________
SLIDE VCHEM5-post-5
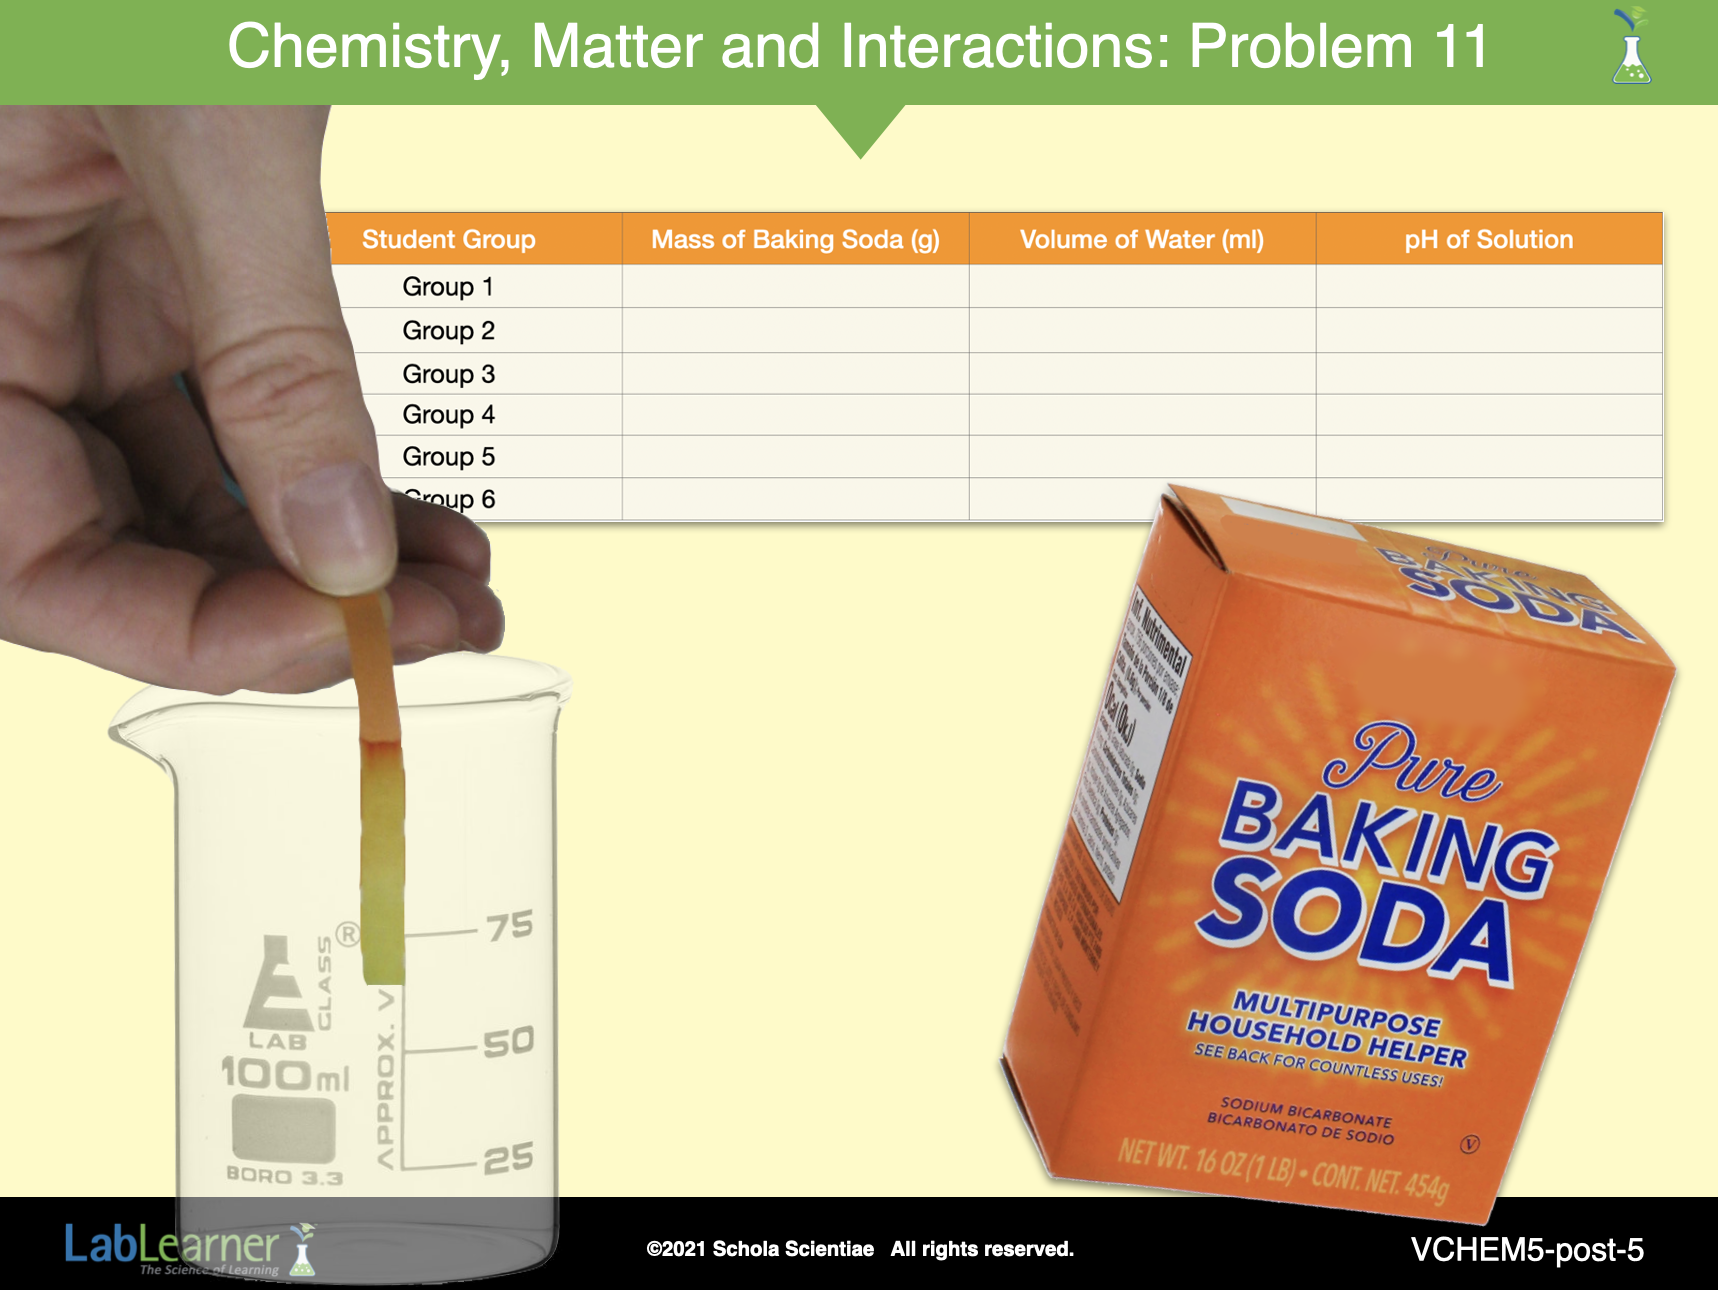
Tell students that in their experiments, they created solutions using a specific amount of solvent (water) and a specific amount of solute (vinegar, laundry detergent, lemon juice, or baking soda). From their data gathered in Trials 1 through 5, students were able to conclude that although adding 100 ml of water to a 10 ml sample of solute may alter the pH of the solute slightly, it does not cause a great change.
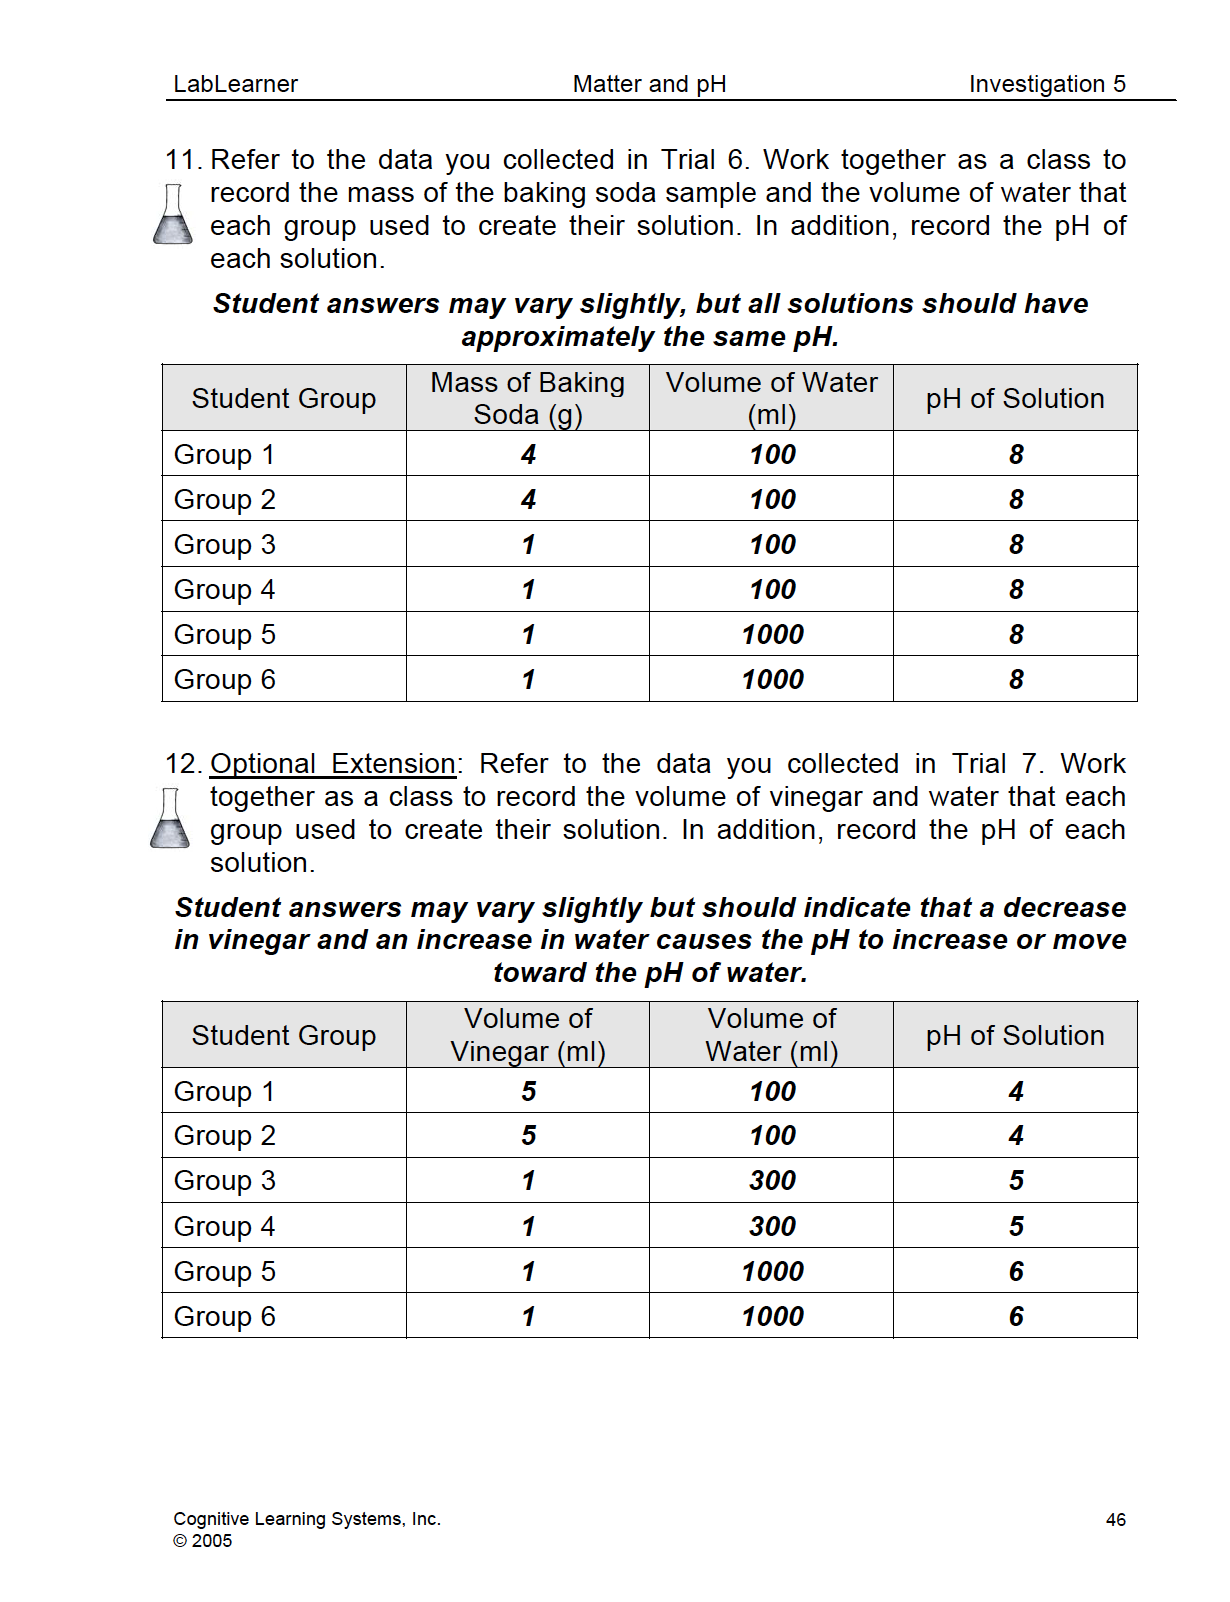
Substances that were acids remained acids after water was added, and substances that were bases remained bases. However, from Trials 1 through 5, students could not determine whether or not altering the amount of water (solvent) would affect the pH of the solution. Tell students that Trial 6 was designed to aid in determining whether or not changing the amount of solvent (water) affected the pH of baking soda.
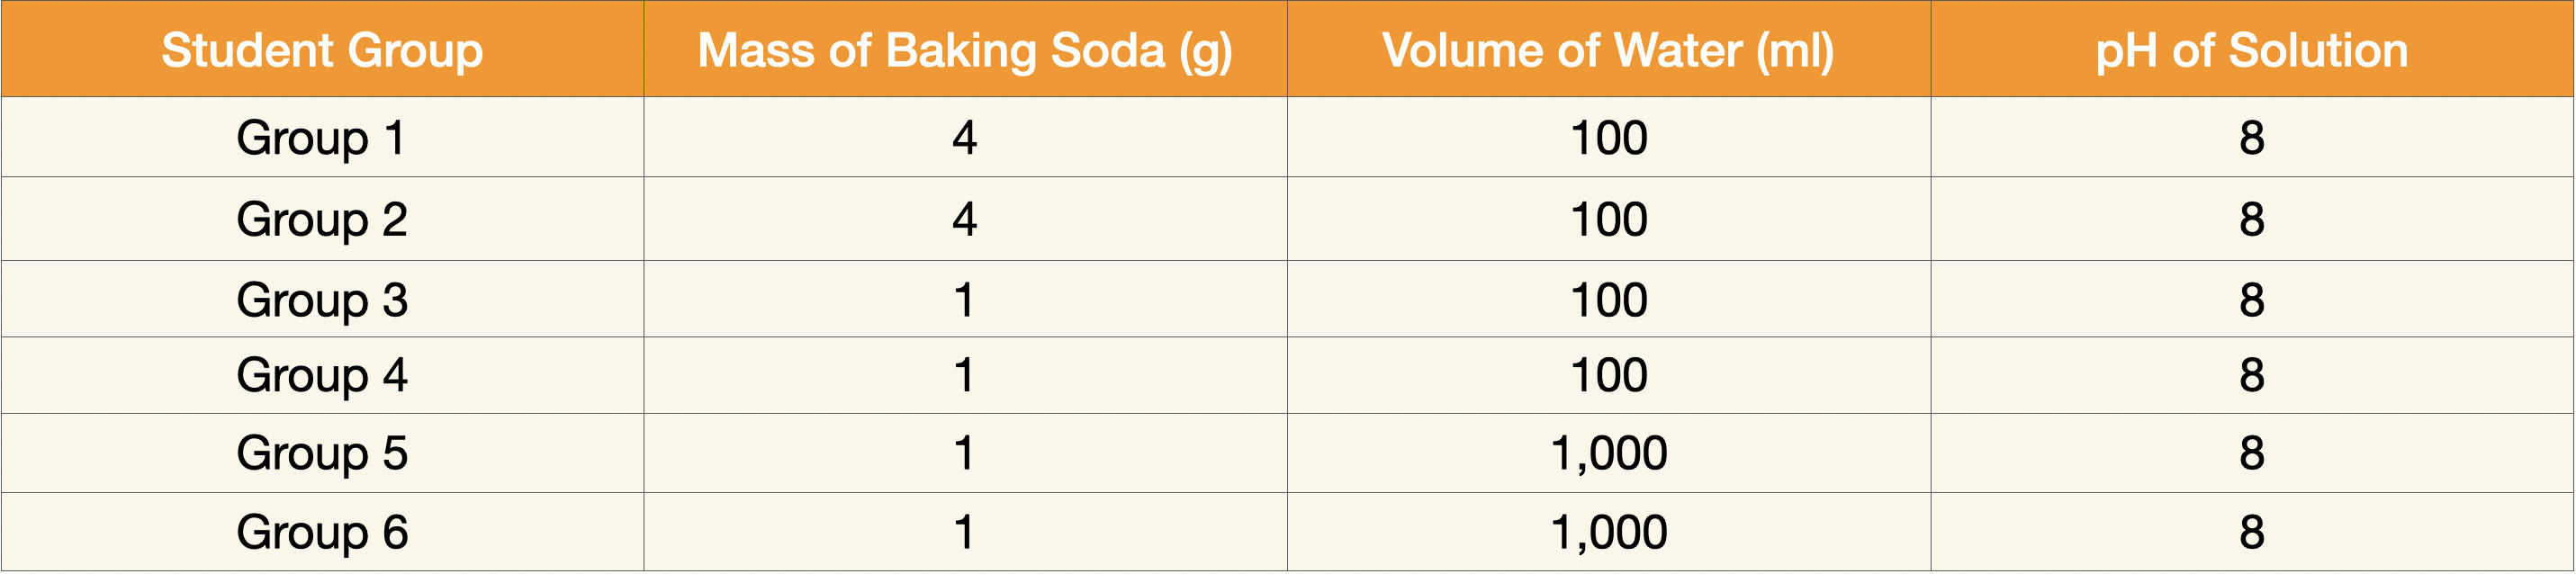
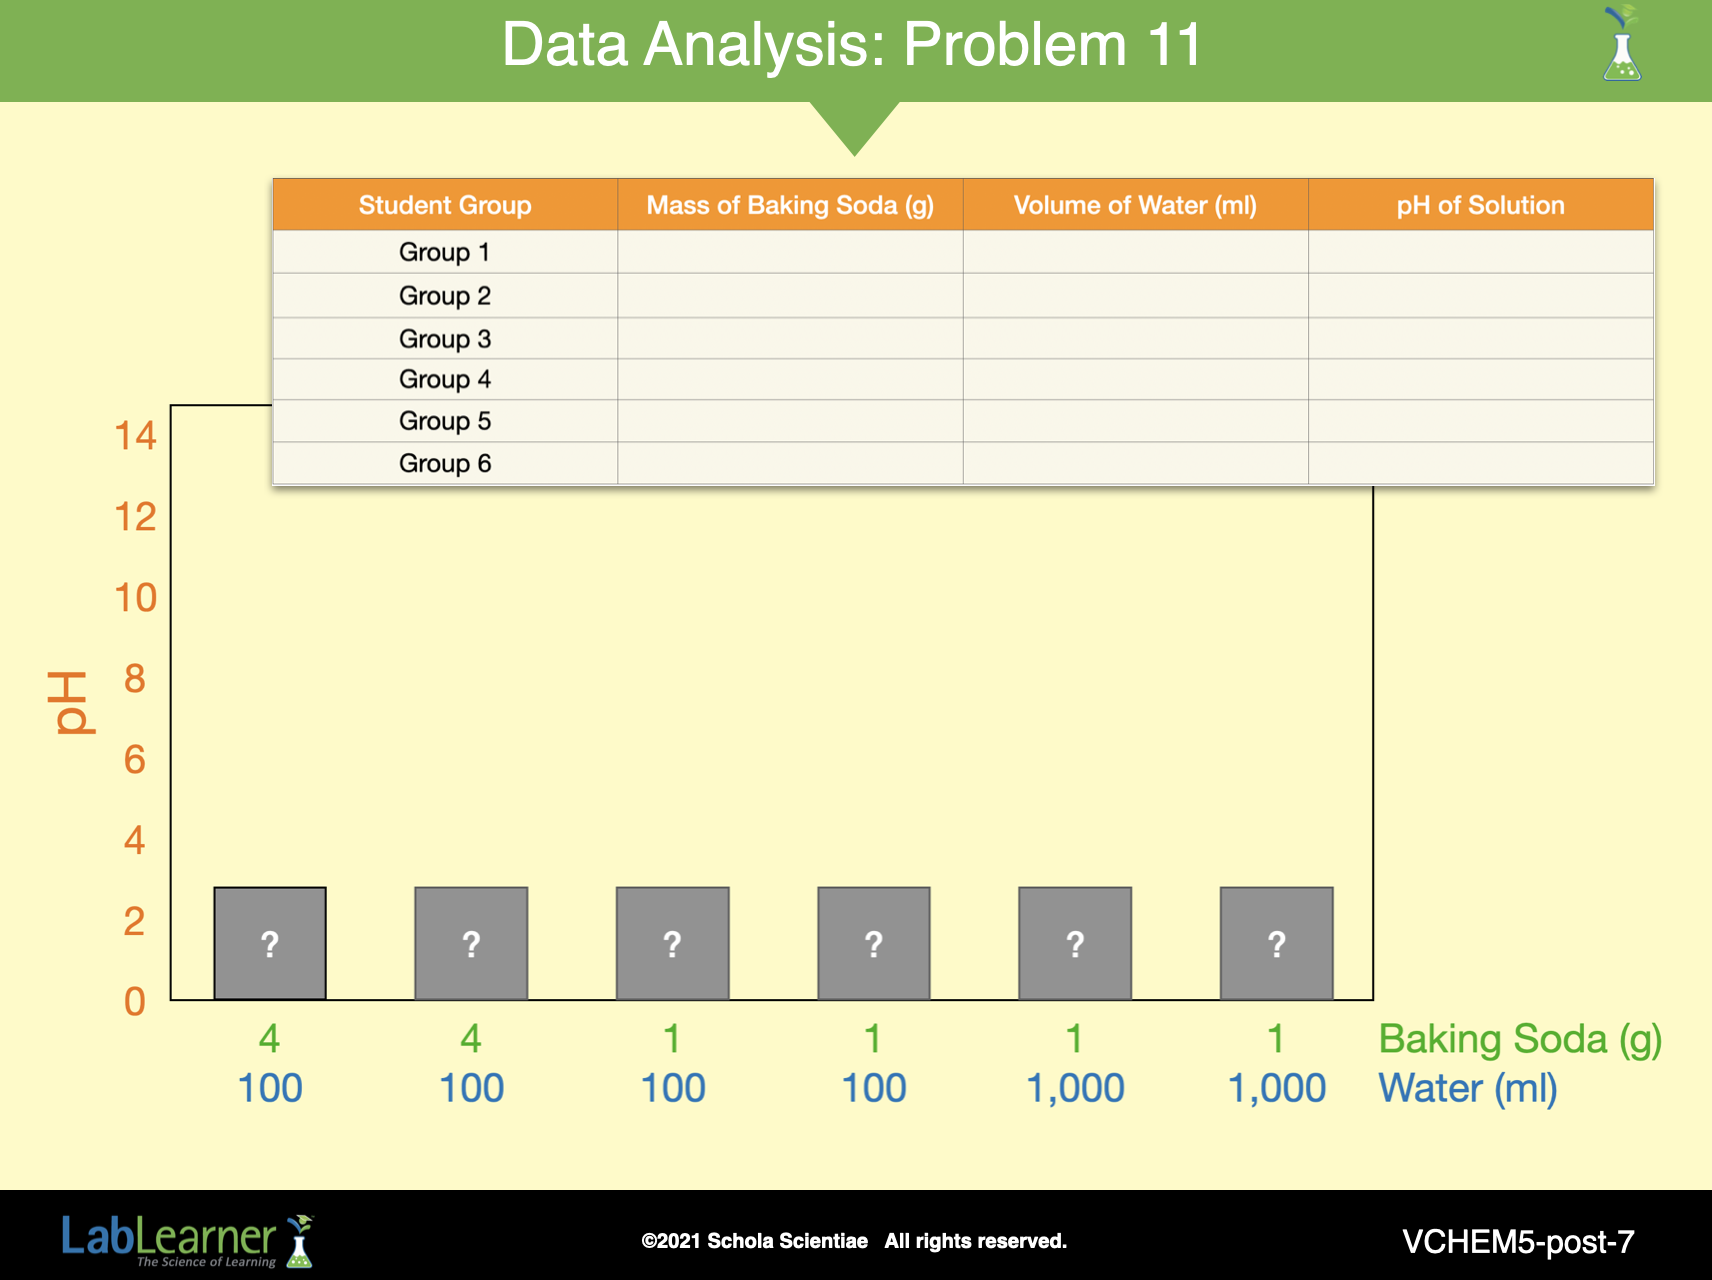
Tell students that each group created a different baking soda and water solution. Allow students to work as a class to complete the data table in Problem 11 in their Student Data Record in order to combine their data. Sample data for the teacher is shown below:
Ask students: A table presents data in one way. Can you think of another way to organize and present this data? Guide students to the idea that a graph could be used to show how increasing the amount of water and decreasing the amount of baking soda in a solution may affect the pH of the solution.
______________________________________________
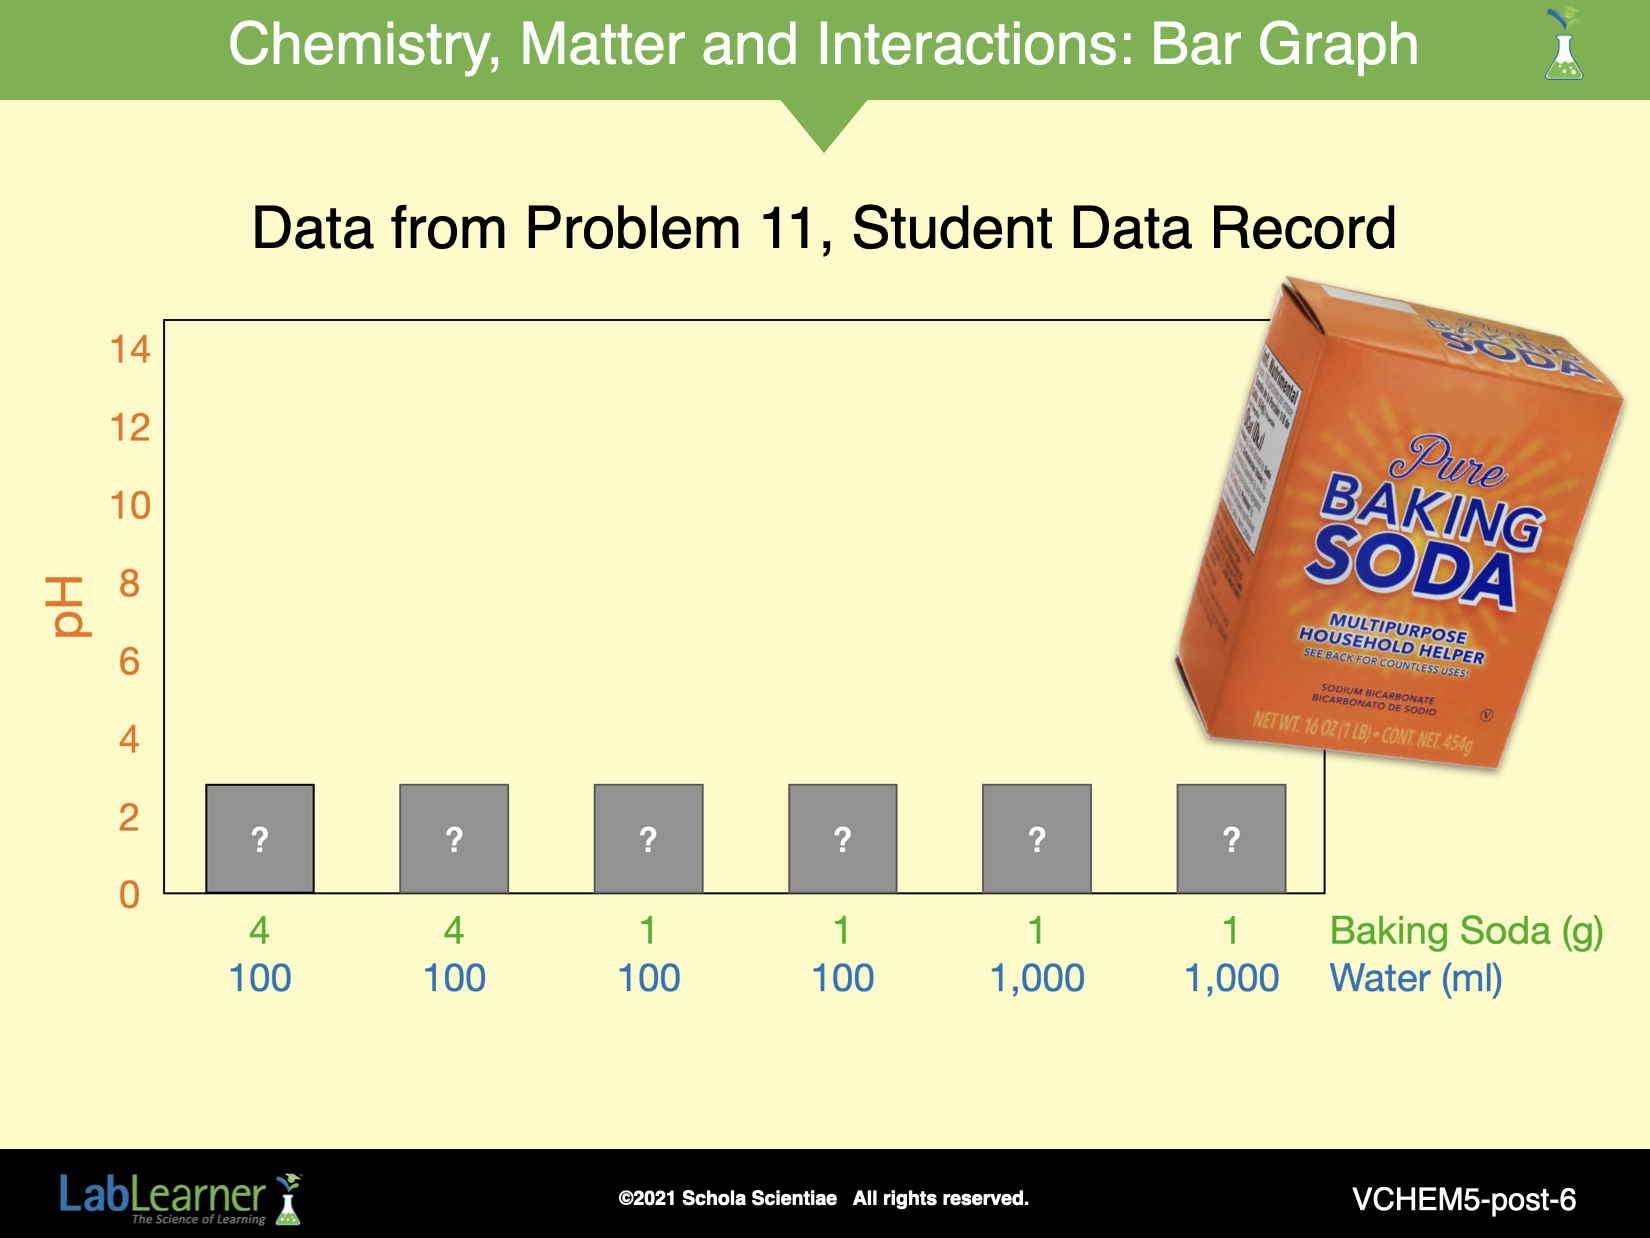
SLIDE VCHEM5-post-6
As a class, create a bar graph on the board. Creation and completion of a bar graph is a tool from the Procedural Toolbox that students will likely have used previously. As you are creating the bar graph, walk through the steps with the class:
a. Draw an x-axis and a y-axis.
b. Evaluate your data and determine which variable will be plotted along the x-axis and which will be along the y-axis.
c. In experiments, there is a variable changed by the person doing the experiment and a variable that is measured by the person doing the experiment. Typically, scientists place the variable they control on the x-axis.
Ask students: What did you control in this trial? Guide students to the understanding that they controlled how much baking soda and water they used to create a solution. Therefore, this information is plotted along the x-axis.
d. Instruct each group to send one student to the board to record the amount of baking soda and water in their solution. The composition of each group’s solution should be recorded on the x-axis.
e. Typically, scientists place the variable they measure on the y-axis.
Ask students: What did you measure in this trial? Encourage students to realize that they measured the pH of the baking soda solution.
f. Determine the beginning and ending numbers on the y-axis. Allow students to set the scale. Because students are measuring pH, they may wish to use the entire pH scale to label the y-axis, 1 to 14. Ask a student volunteer to place the numbers along the y-axis.
g. To complete the graph, ask each group to select one student to come to the front of the classroom and draw the bar that represents the pH of his or her group’s solution.
- Note: Although only three different types of baking soda solutions were created, it is important that each group graphs its own data on the class bar graph. Groups that created the same solutions may have found slight differences in the mass of the baking soda sample. In addition, they may have interpreted the color of the pH paper in a slightly different way than the other group. For these reasons, the bar graph should contain six bars rather than only three.
______________________________________________
SLIDE VCHEM5-post-7
When students have finished completing the bar graph, discuss the completed graph as a class. Use the following questions to aid in the discussion:
Ask students: Which baking soda solution contained the most baking soda per milliliter of water (the most baking soda and the least water)? Student answers may vary based on the mass of their baking soda samples. In the sample graph, the two solutions containing 4 grams of baking soda in 100 ml contained the most baking soda and the least water.
Ask students: Which baking soda solution contained the least baking soda per milliliter of water (the least baking soda and the most water)? Student answers may vary based on the mass of their baking soda samples. In the sample graph, the two solutions containing 1 gram of baking soda in 1000 ml contained the least baking soda and the most water.
Ask students: What do you observe about the pH of all of the baking soda solutions? The pH of a baking soda solution does not vary significantly as the amounts of baking soda and water are altered. A baking soda solution remains basic even when a significant amount of water is used to create the solution.
Ask students: What does this tell us about the properties of baking soda? Baking soda and water interact in a way that does not greatly vary the pH of baking soda. Even when the amount of baking soda is decreased and the amount of water is increased, the pH of the baking soda solutions remains the same.
Ask students: Were you able to determine the pH of baking soda alone? Student answers will vary. Although students were not able to test the pH of baking soda alone, they were able to conclude that baking soda is basic. The pH of the baking soda solutions was 8. Because the pH of water was likely between 6 and 7, students can conclude that it was a property of baking soda that caused the baking soda and water solution to have a pH of 8. Therefore, baking soda must be basic.
______________________________________________
SLIDE VCHEM5-post-8
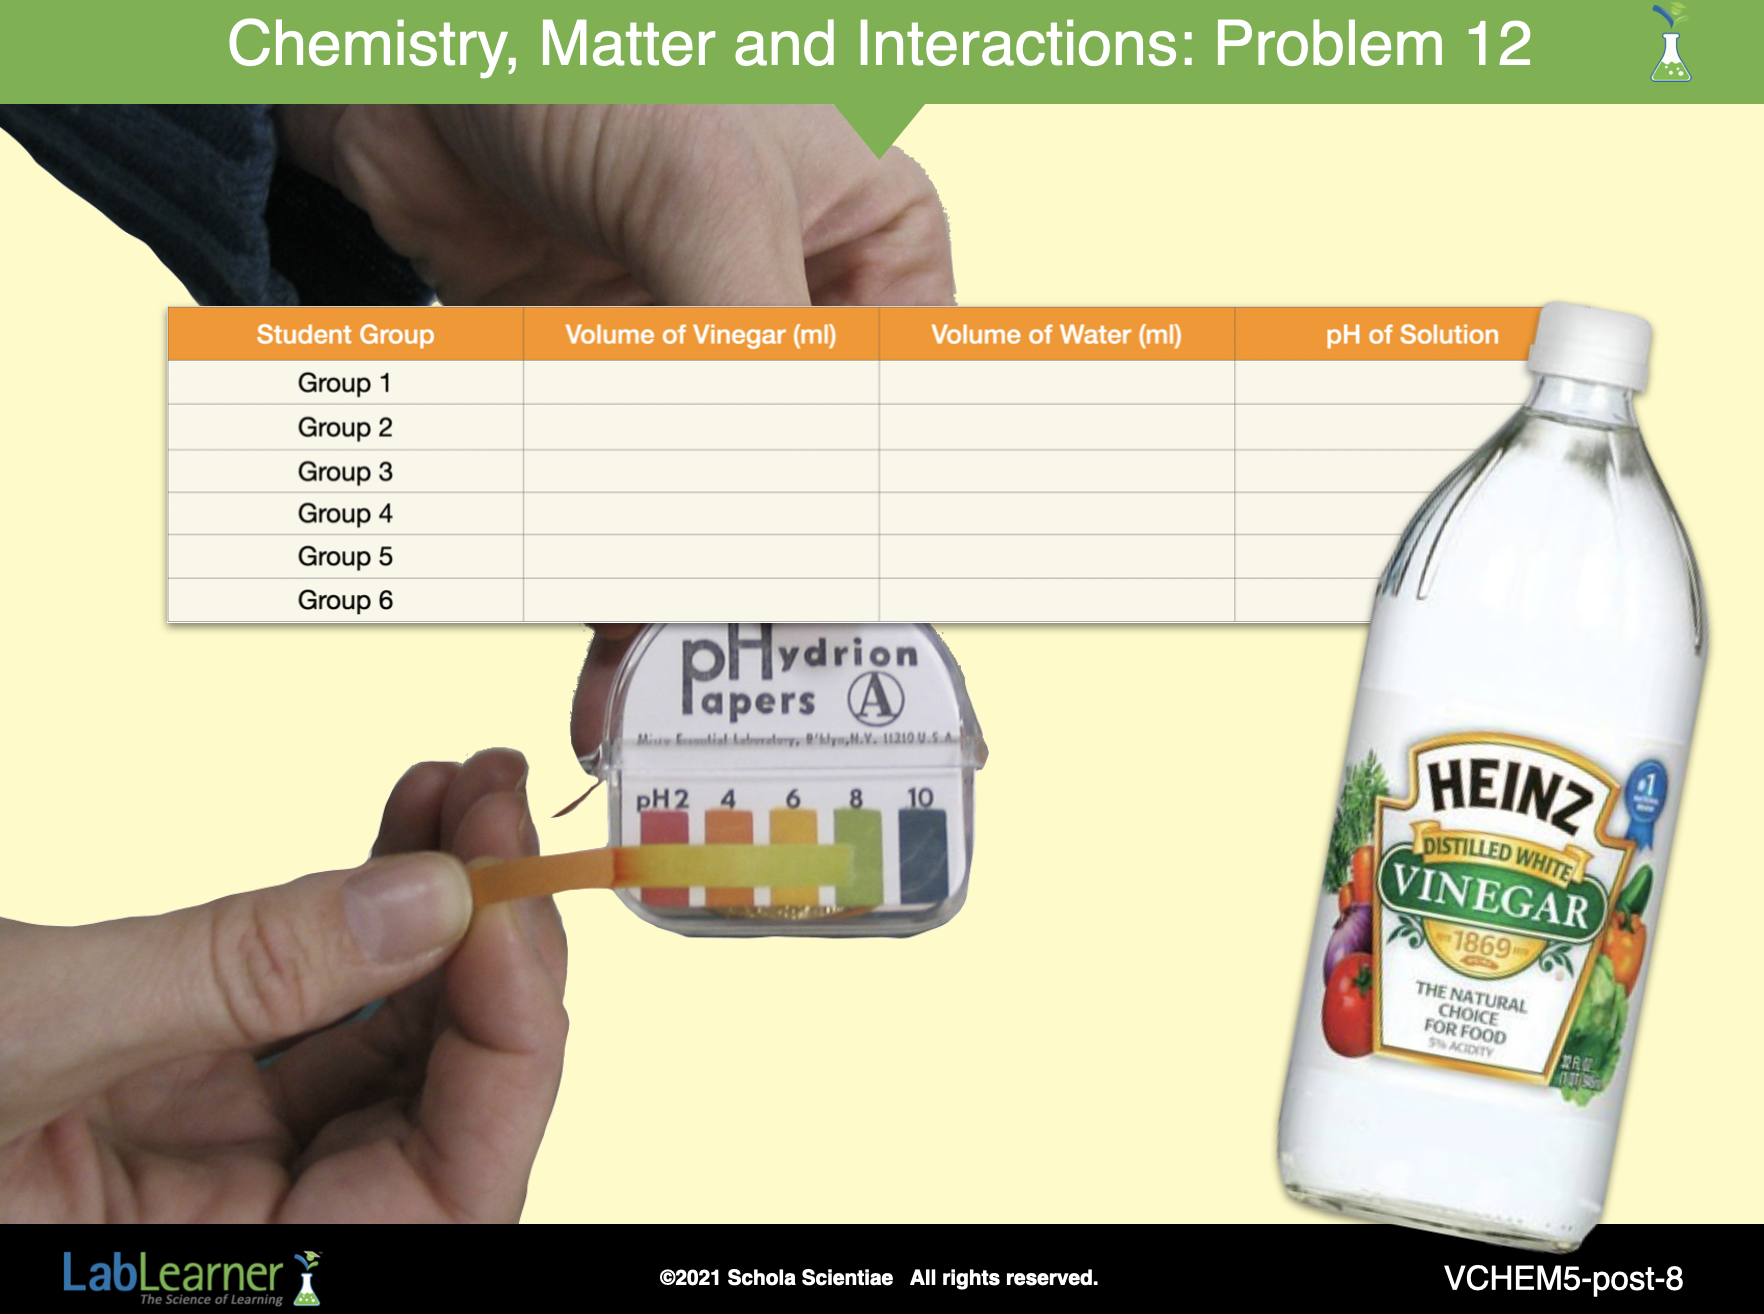
Optional Extension: If students completed Trial 7, instruct them to refer to the data they collected.
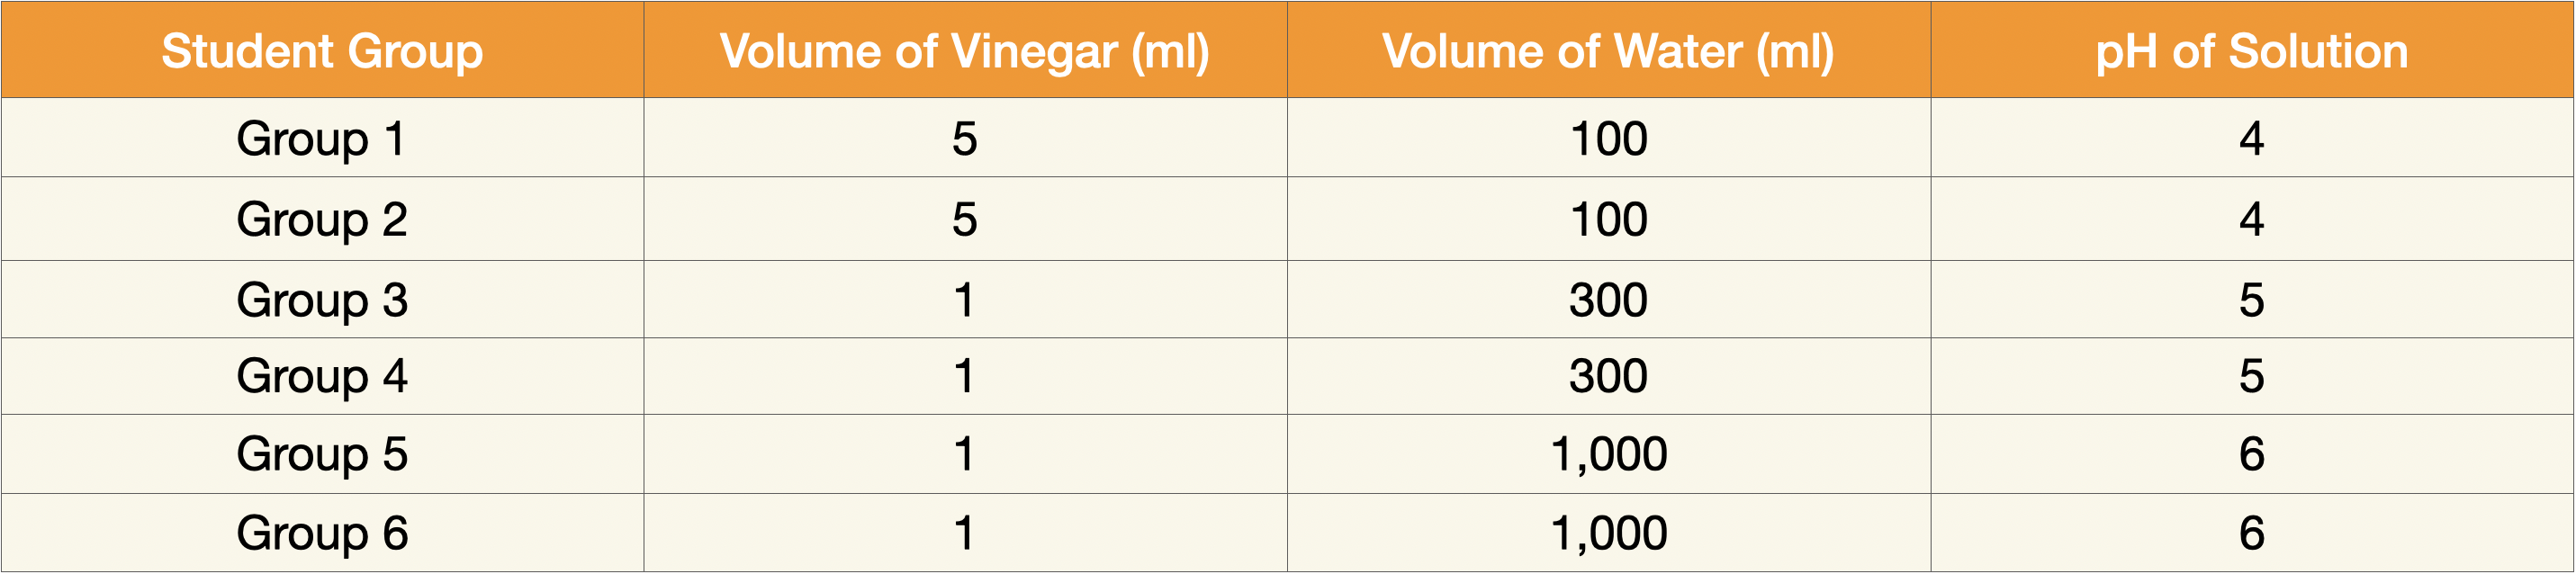
Tell students that during Trial 7, like Trial 6, each group created a solution of varying amounts of solvent (water) and solute (vinegar). Allow students time to work as a class to complete the Data Table in Problem 12. Sample data for the teacher is shown below:
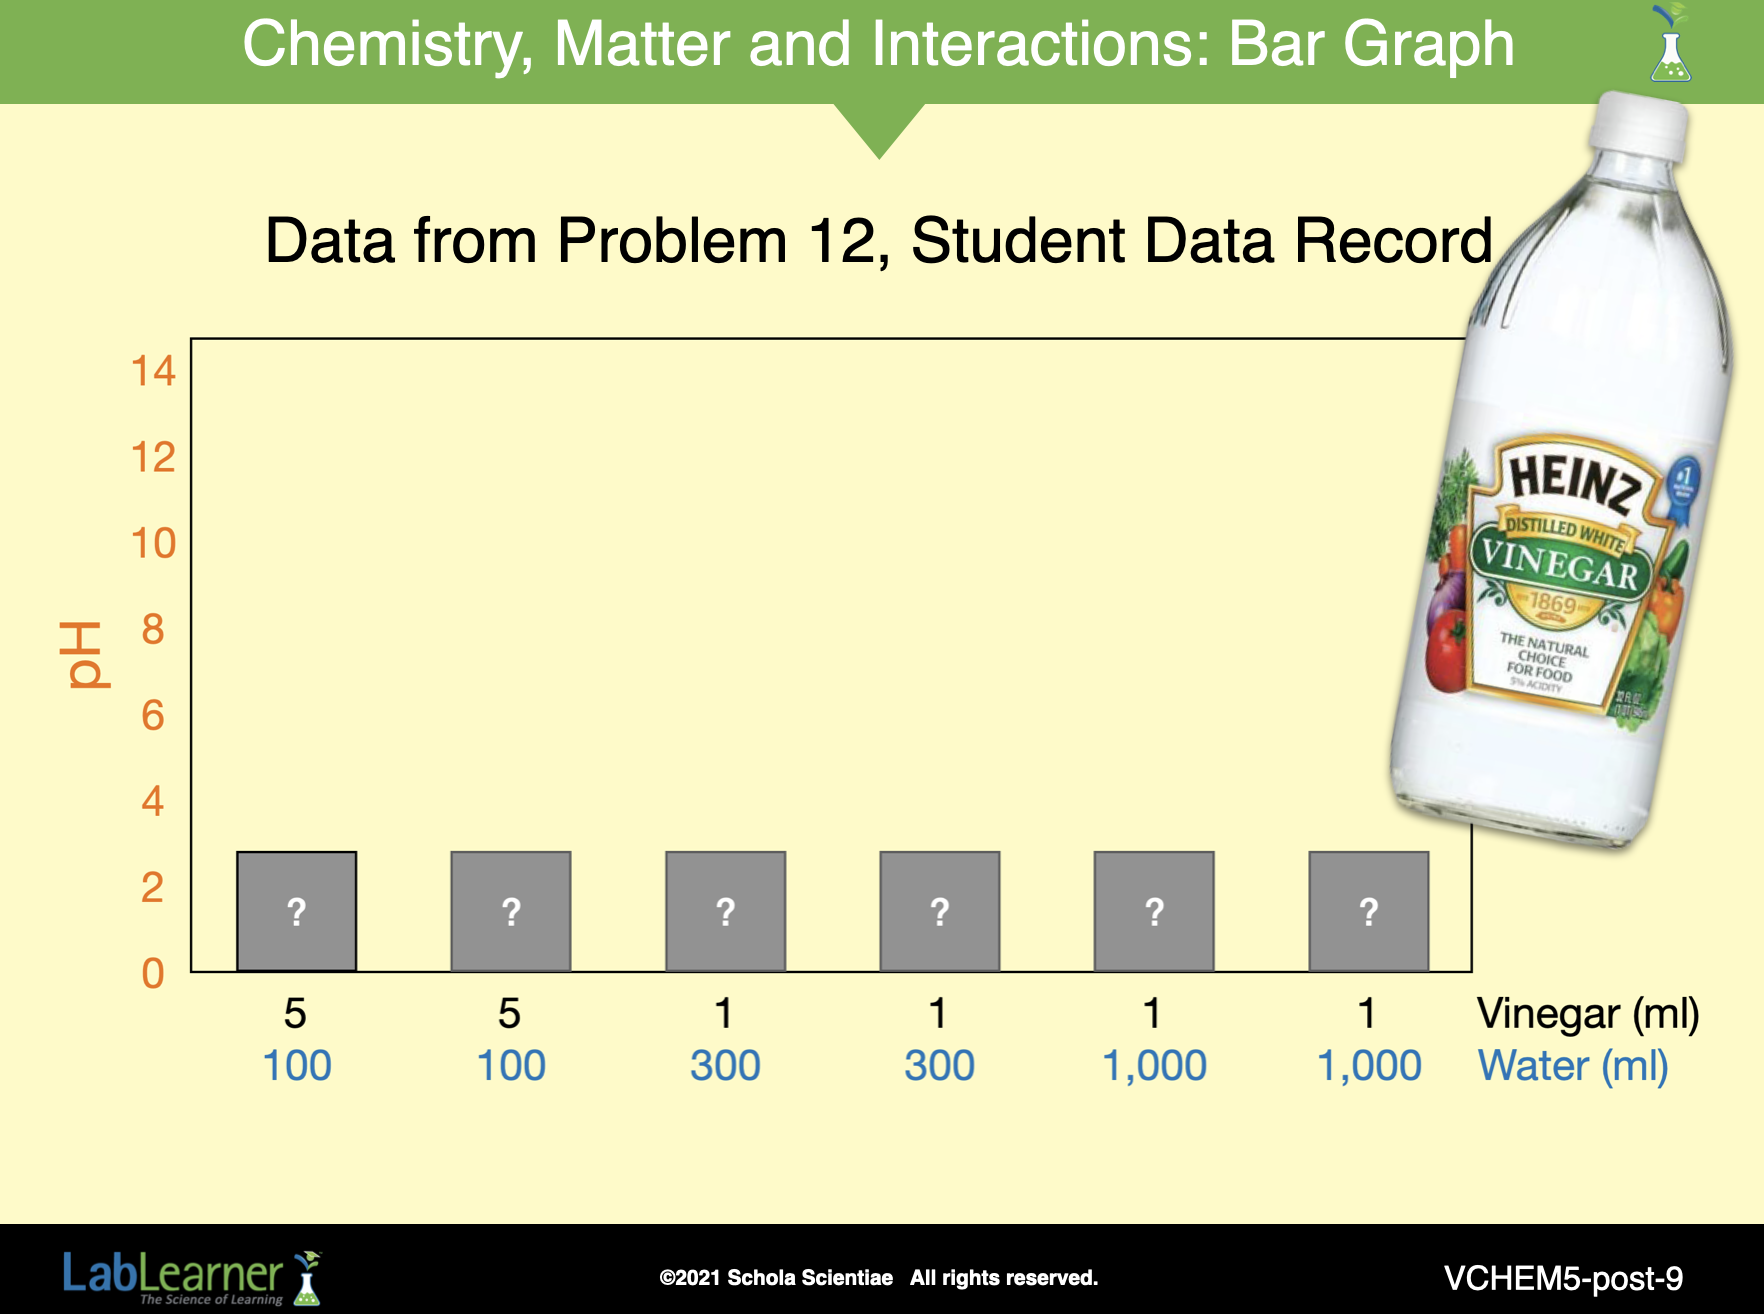
Ask students: Can you think of another way to organize and present this data? Guide students toward creating a bar graph similar to the graph they created for the baking soda solutions.
As a class, create a second bar graph beside the graph of the pH of the baking soda solutions. If needed, review the steps from the baking soda solution graph with the class.
As students are labeling the y-axis, encourage them to place the solutions in order from solutions with the most vinegar and the least water to the solutions with the least vinegar and the most water, or visa versa. By setting up their graph in this manner, students will be better able to analyze their results.
______________________________________________
SLIDE VCHEM5-post-9
When students have finished completing the bar graph, discuss the completed graph as a class. Use the following questions to aid in the discussion.
Ask students: Which vinegar solution contained the most vinegar per milliliter of water (the most vinegar and the least water)? The two solutions containing 5 ml of vinegar in 100 ml contained the most vinegar and the least water.
Ask students: Which vinegar solution contained the least vinegar per milliliter of water (the least vinegar and the most water)? The two solutions containing 1 ml of vinegar in 1000 ml contained the least baking soda and the most water.
Ask students: What do you observe about the pH of the vinegar solutions? Although each vinegar solution was acidic, the pH of the solutions varied based on the amount of vinegar per amount of water. When the vinegar was decreased and the water was increased, the pH increased or moved more toward that of water.
Ask students: What does this tell us about the properties of vinegar? Increasing the amount of water in a vinegar and water solution affects the pH of vinegar. As the volume of water increased and the volume of vinegar decreased, the pH of the solution moved toward the pH of water. This is in contrast to the baking soda and water solution, which did not change greatly as the solution was altered. The properties of vinegar cause it to interact with water in a different way than baking soda and water interact.
______________________________________________
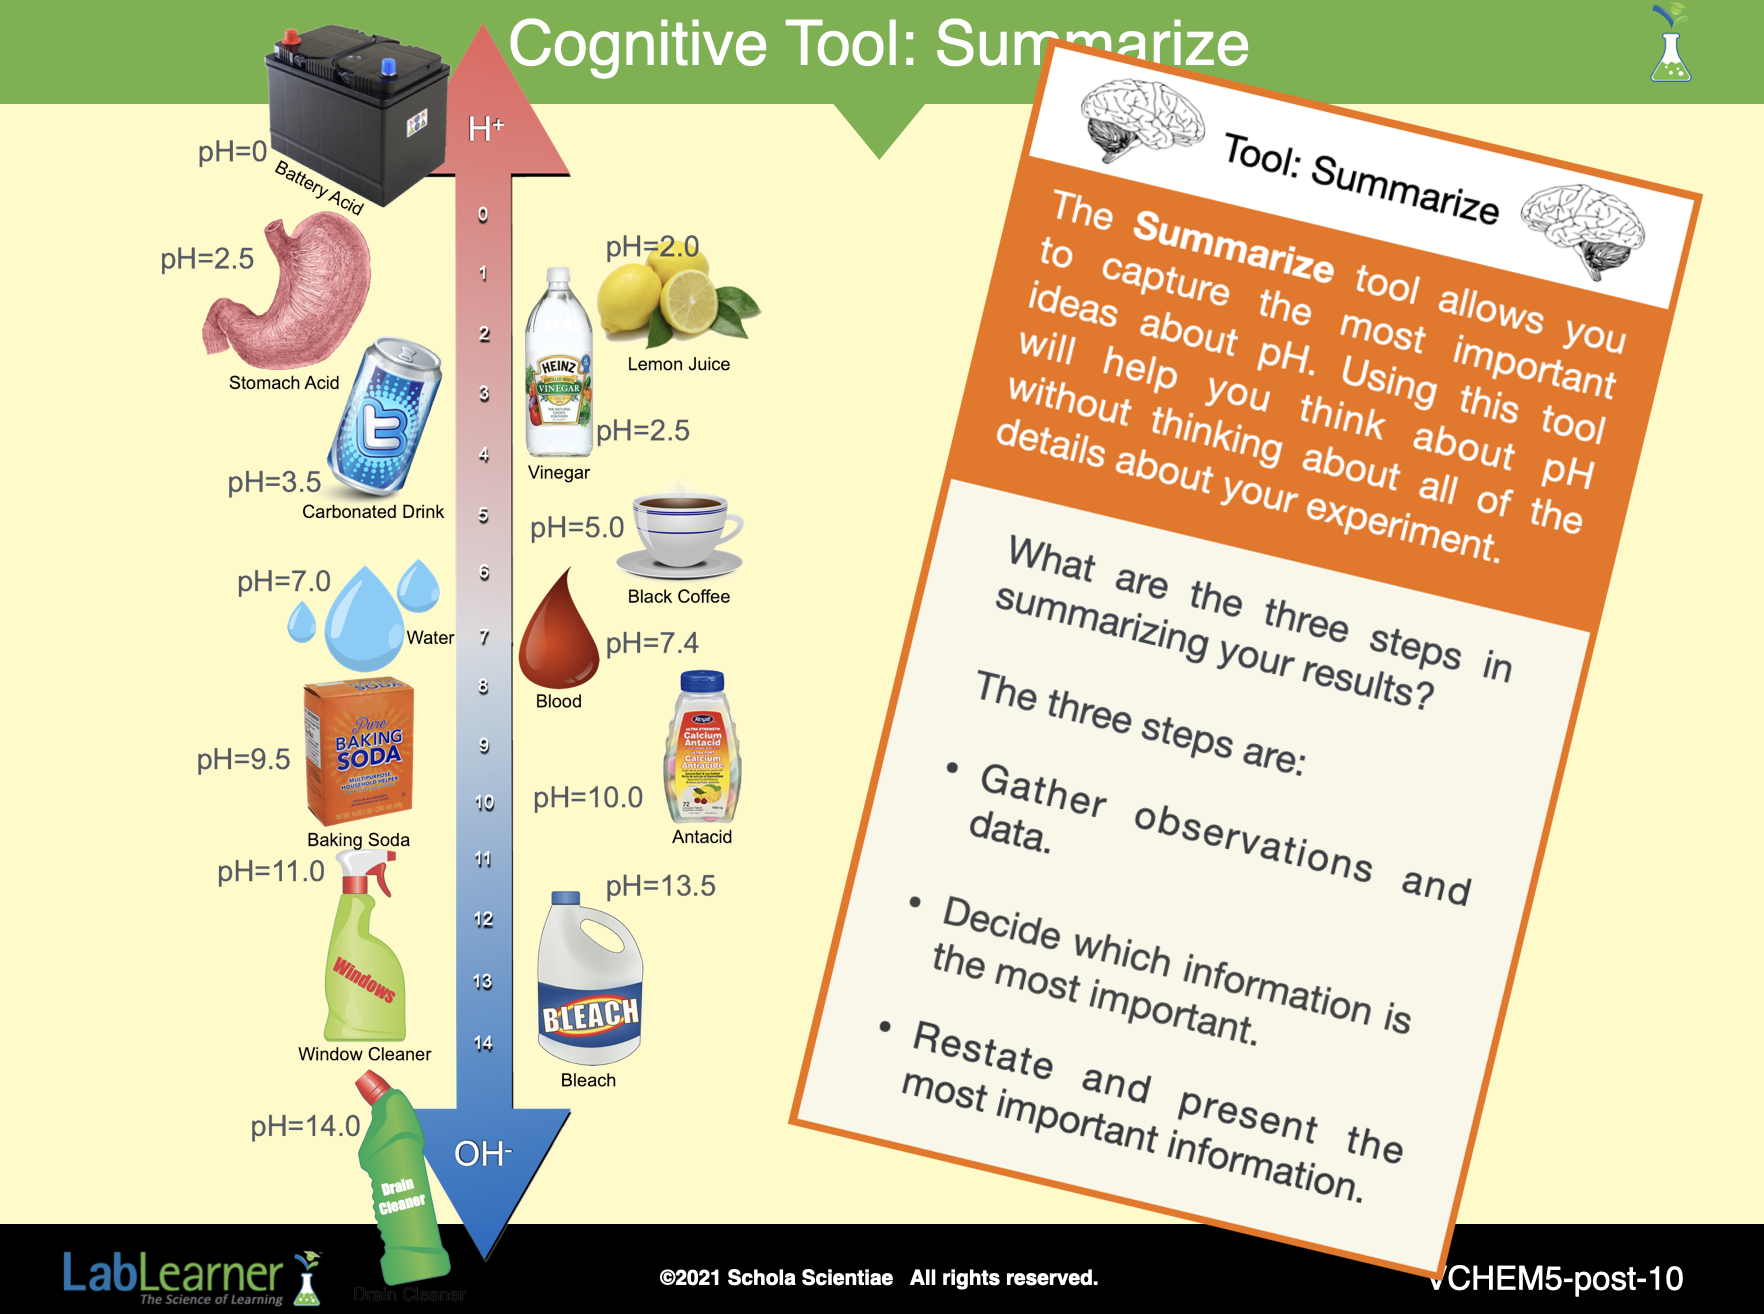
SLIDE VCHEM5-post-10
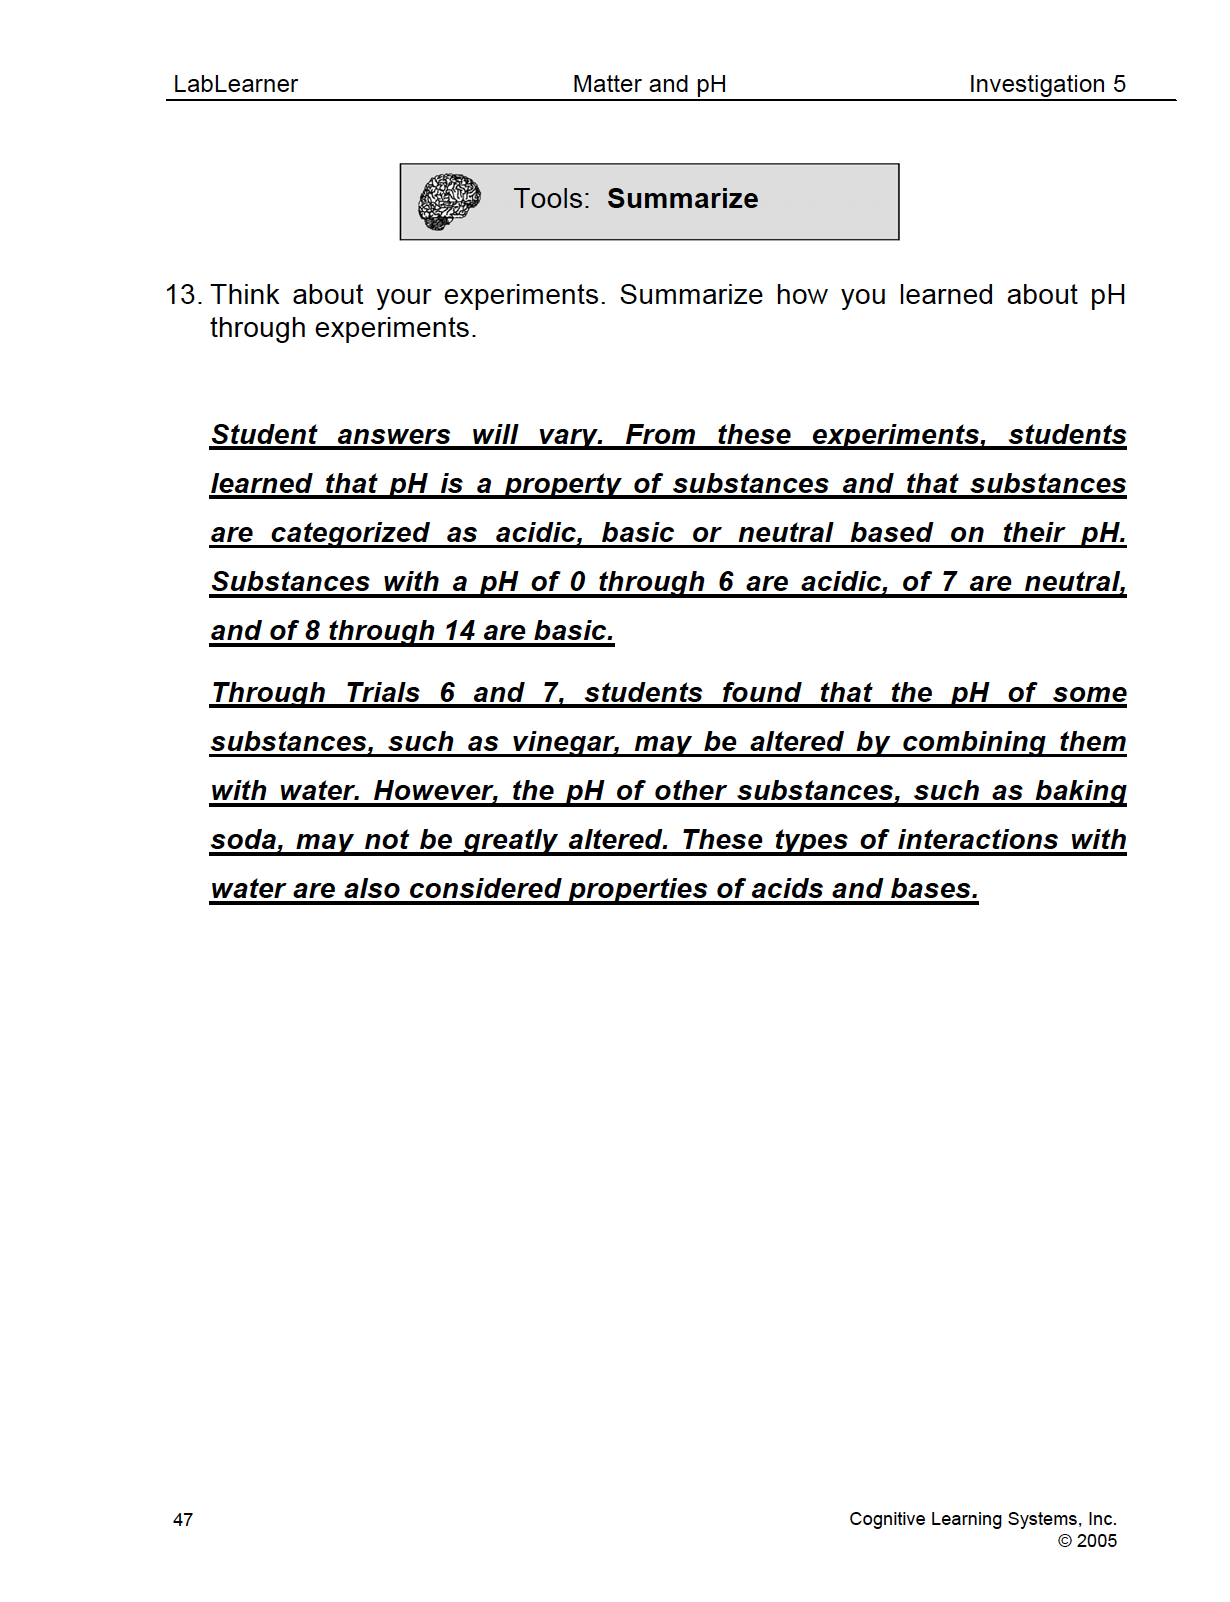
Allow students to work together in their groups to summarize their conclusions concerning pH.
Students should record their summary in Problem 13 in their Student Data Record. Student summaries may include:
- pH is a property of substances.
- Substances are categorized as acidic, basic, or neutral based on their pH. Substances with a pH of 0 through 6 are acidic, 7 are neutral, and 8 through 14 are basic.
- The pH of some substances, such as vinegar, may be altered by combining them with water. However, the pH of other substances, such as baking soda, may not be greatly altered. These types of interactions with water are also considered properties of acids and bases.
______________________________________________
KEYS: POSTLAB