Procedural Toolbox
Completion of a Bar Graph
1. Bar graphs are used to display and organize data. They help you look at more than one piece of data at the same time.
2. First look at the labels or numbers on the bottom of the graph. These tell you what each bar on the graph represents or will represent. On the sample graph, the first bar represents sitting, the second will represent walking, and the third will represent jogging.
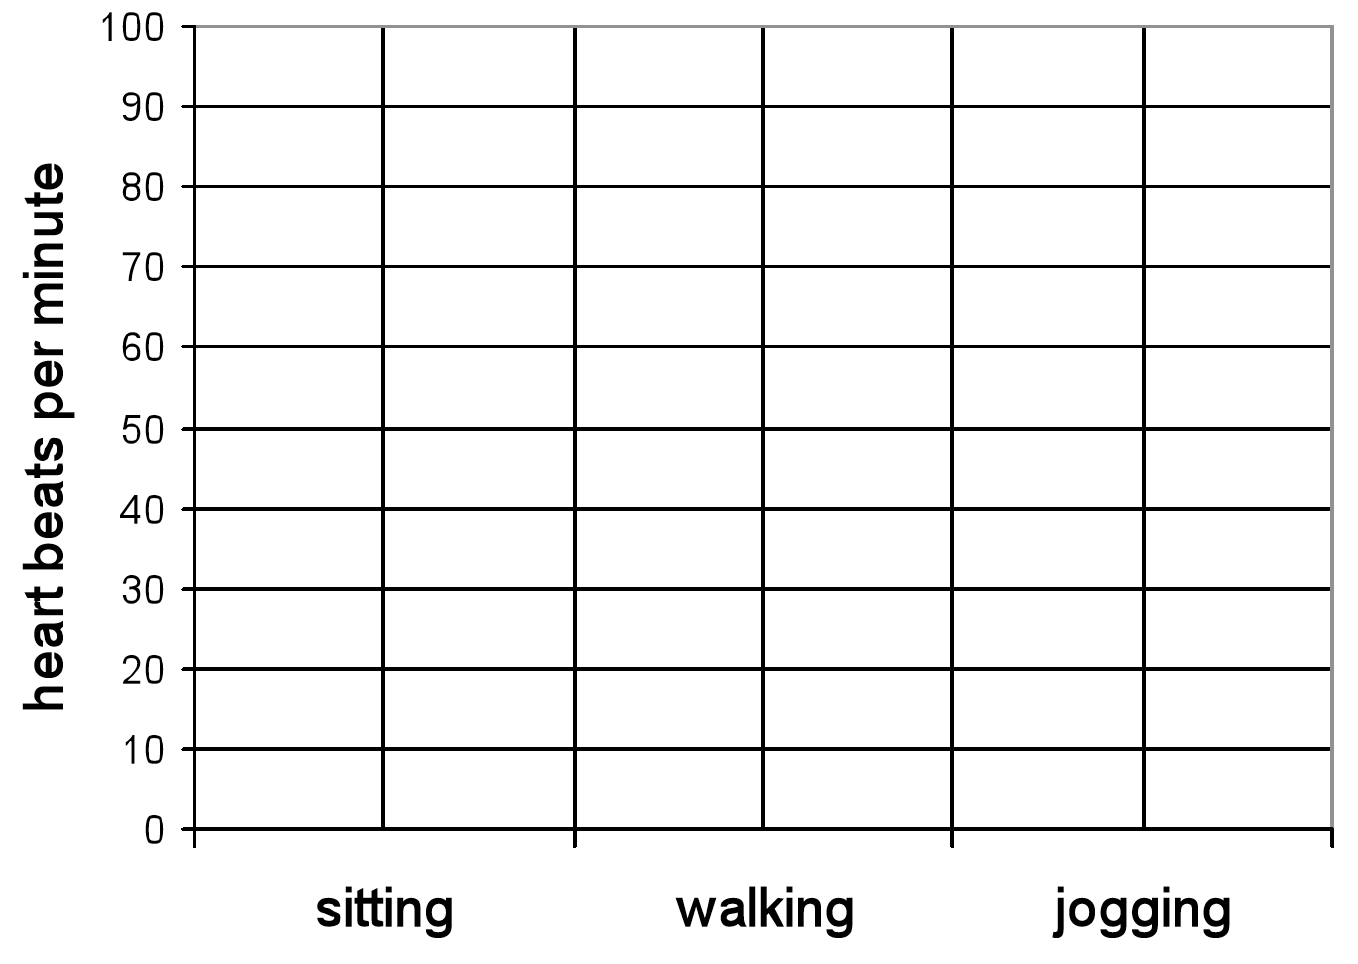
3. Next look at the label or labels running up and down on the side of the graph. The word label tells you what the numbers represent. For example, on the sample graph, the numbers represent the number of heartbeats per minute.
4. The numbers on the side of the graph correspond to the bars on the graph. If you need to draw the bars on the graph, find the number that you want the bar to represent. Follow the line next to that number. Draw a bar that reaches that line.

5. If the bars are already drawn on the graph, use the numbers to find out what each bar represents. Find the top edge of the bar. Follow the top of the bar to the left to find the number that lines up with the bar. By doing this, you find the number value that the bar represents. For example, the first bar on the sample graph below represents 60 heartbeats per minute.
6. By creating and using a bar graph, you can easily compare values. For example, the sample graph shows that the most heartbeats per minute were counted after jogging.