Teacher Portal
Ecosystems
Deep Analysis
Deep Analysis
Ecosystems

Deep Analysis
Use the questions below to go deeper into the scientific concepts and applications of each Investigation. Note that questions highlighted in orange text are also featured in Phase 3.1 (Conclusions) of the Student Guide PDF.
Investigation 1
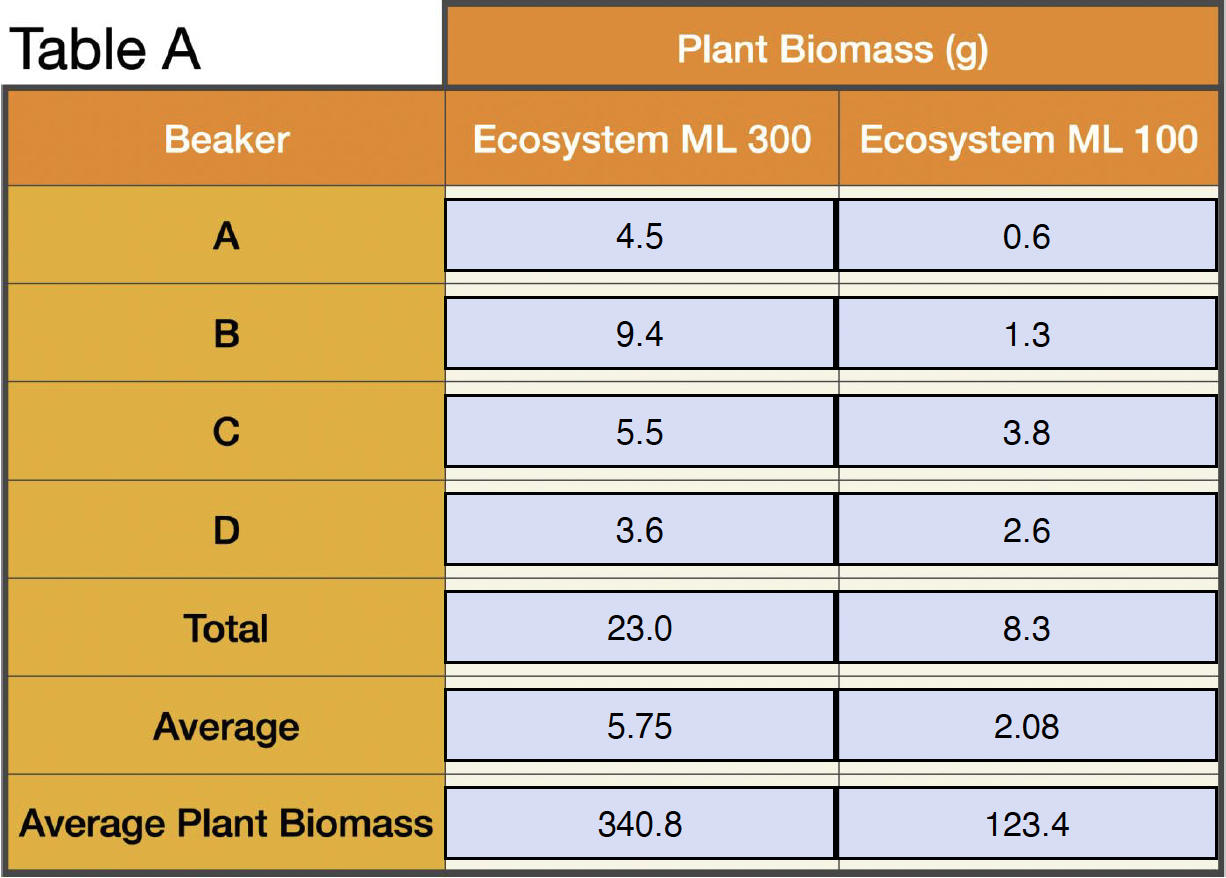
- Create a bar graph to show the relationship between the energy in an ecosystem and the levels of an ecosystem. Use the data from Table A to create the graph.
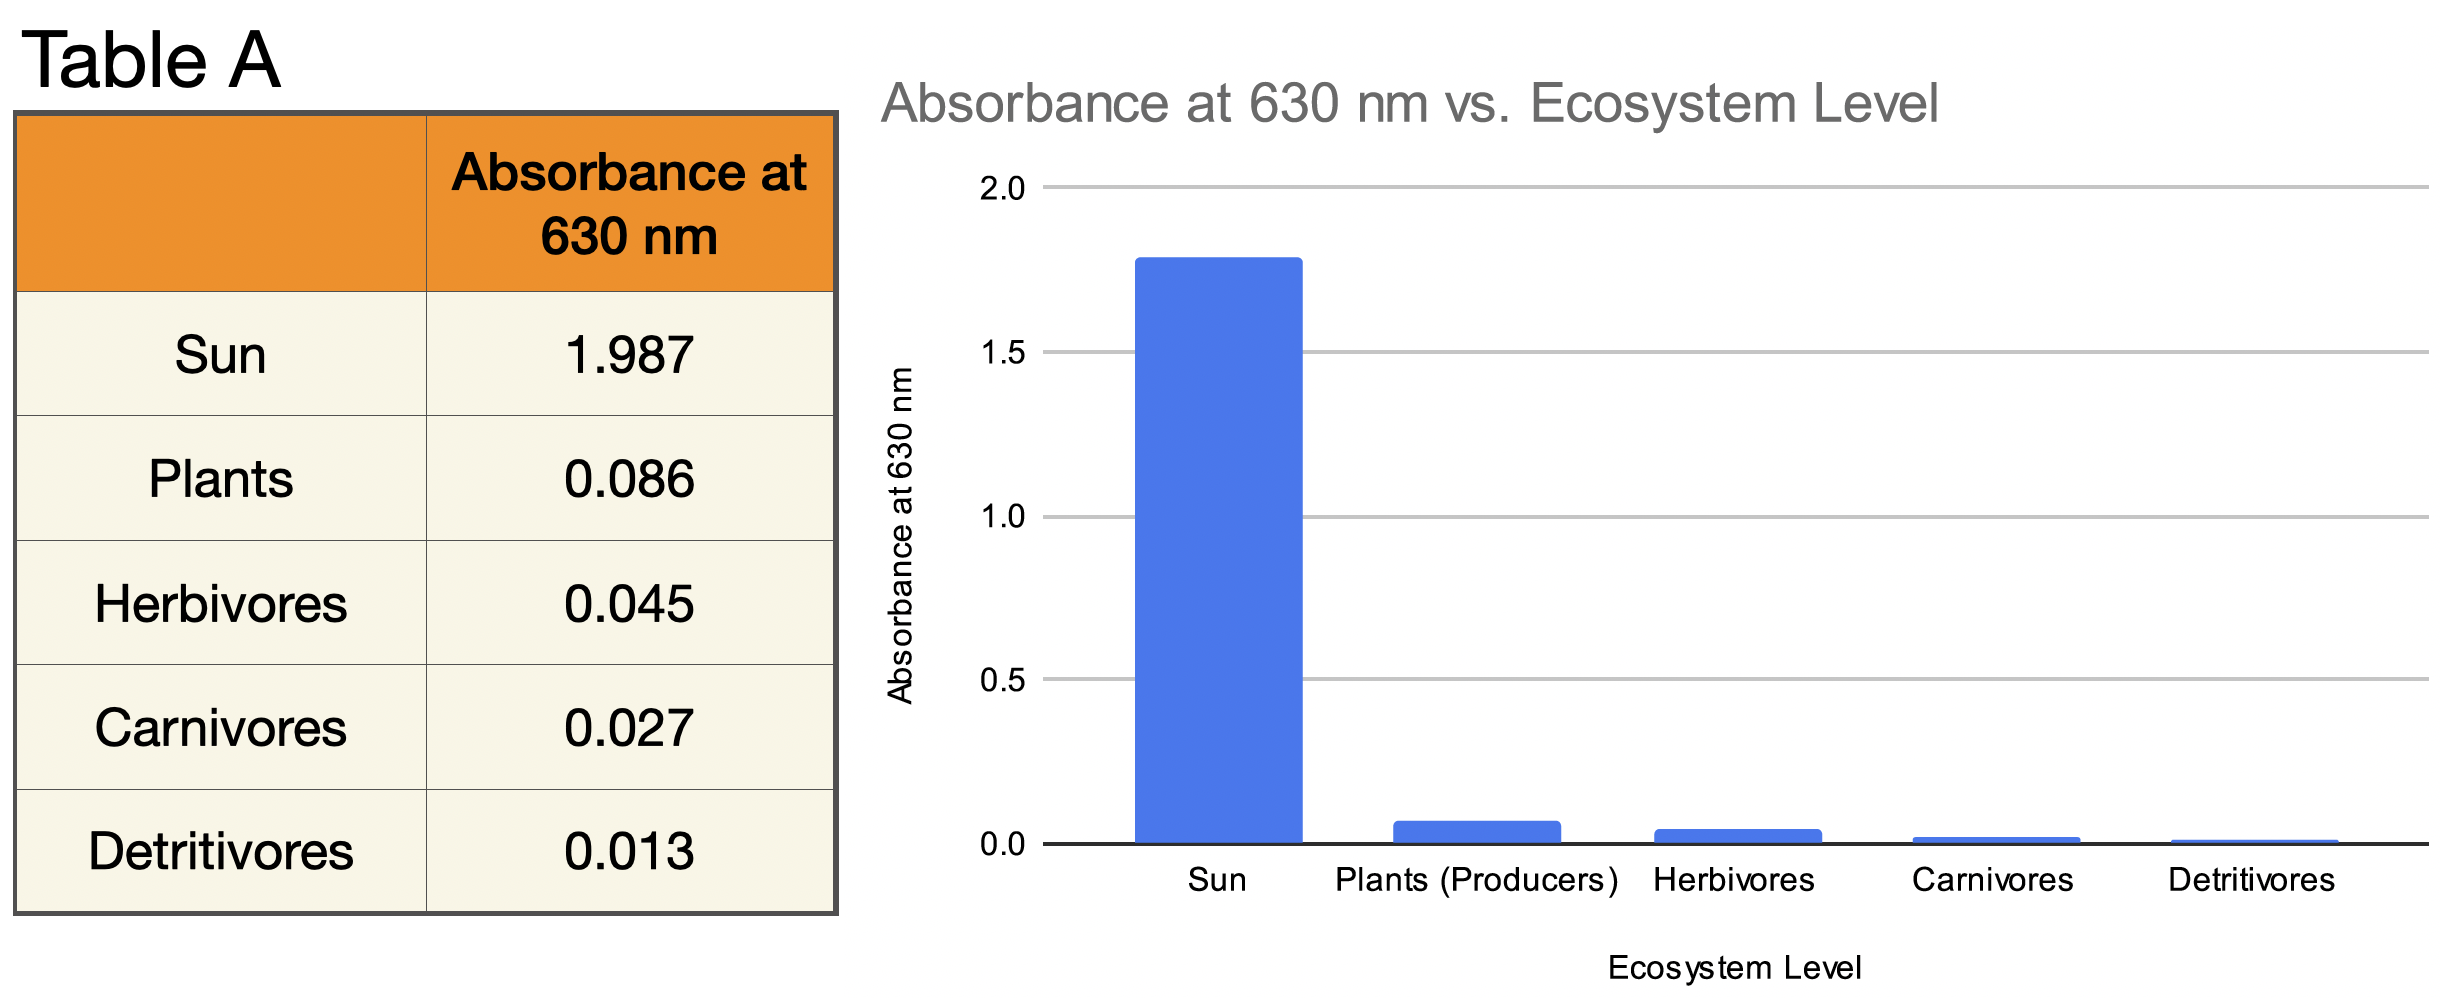
- Which level of the sample ecosystem is considered the bottom level? Which level is considered the top level? In the sample ecosystem, plants are the lowest level and detritivores are the highest level.
- Is all of the energy from the Sun transferred from one level to the next? How did the amount of energy change from one level to the next? Explain your answer using data from the experiment. Not all of the energy from the Sun was transferred to the producers. The amount of energy from the Sun was the highest, with 1.789 units of energy. Energy levels decreased with each new level of the ecosystem or food chain, with detritivores having only 0.014 units of energy. The lowest amount of energy was at the top level of the ecosystem.
- Study your graph. How could the energy relationship between the levels be described in terms of a food chain? Each level is dependent upon the previous level for energy. All consumers obtain energy by consuming organisms from the level below. Plants, however, obtain energy by capturing it from sunlight and storing it as chemical energy through the process of photosynthesis. The energy relationship can be shown in a food chain as follows: Sun – Plants – Herbivores – Carnivores – Detritivores.
- Is energy flow efficient from one level of an ecosystem to the next? Use your data to support your answer. Based on the results of the experiment, energy flow is not efficient from one level of an ecosystem to the next. Each level has a smaller amount of energy than the previous level.
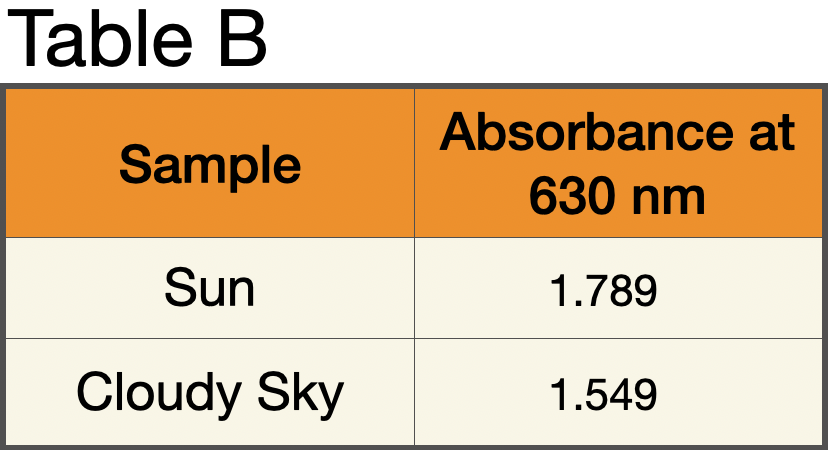
- How did the presence of clouds in the sky affect the amount of energy that reaches the Earth? The presence of clouds in the sky decreased the amount of energy that reaches the Earth from the Sun, causing a decrease from 1.789 to 1.549.
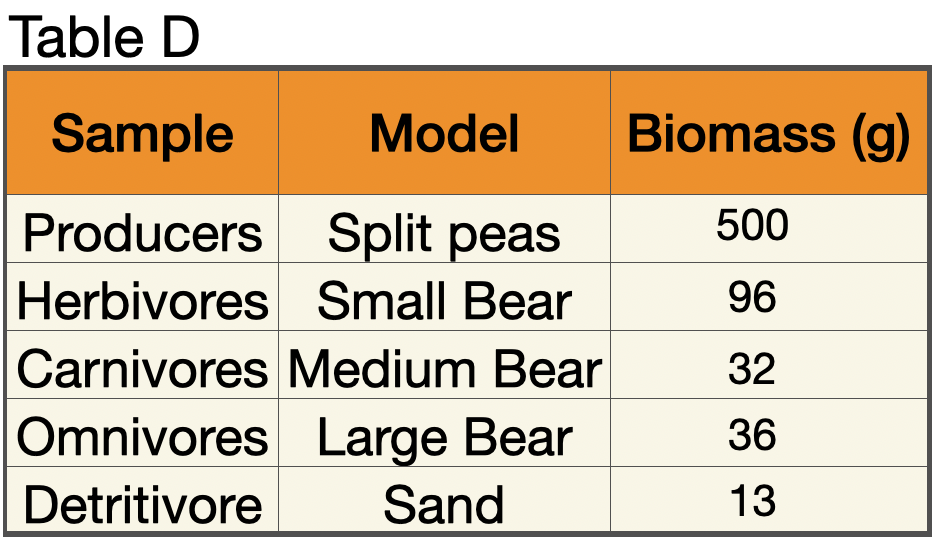
- How did adding omnivores to the ecosystem affect the change in biomass through the ecosystem? Adding omnivores changed the distribution of the biomass in the ecosystem. The addition of omnivores added more feeding pressure on the herbivores, decreasing the number of carnivores that the ecosystem could support
- Knowing what you do about the relationship between energy and biomass in an ecosystem, how would adding omnivores to the ecosystem affect the flow of energy through the ecosystem? Adding omnivores to the ecosystem changed the path of energy flow, but did not alter the overall direction of energy flow. Energy continued to move from the point where light energy was converted to chemical energy to the level of the Detritivores. Energy constantly moved up through the pyramid and did not flow back toward the lower levels.
Investigation 2
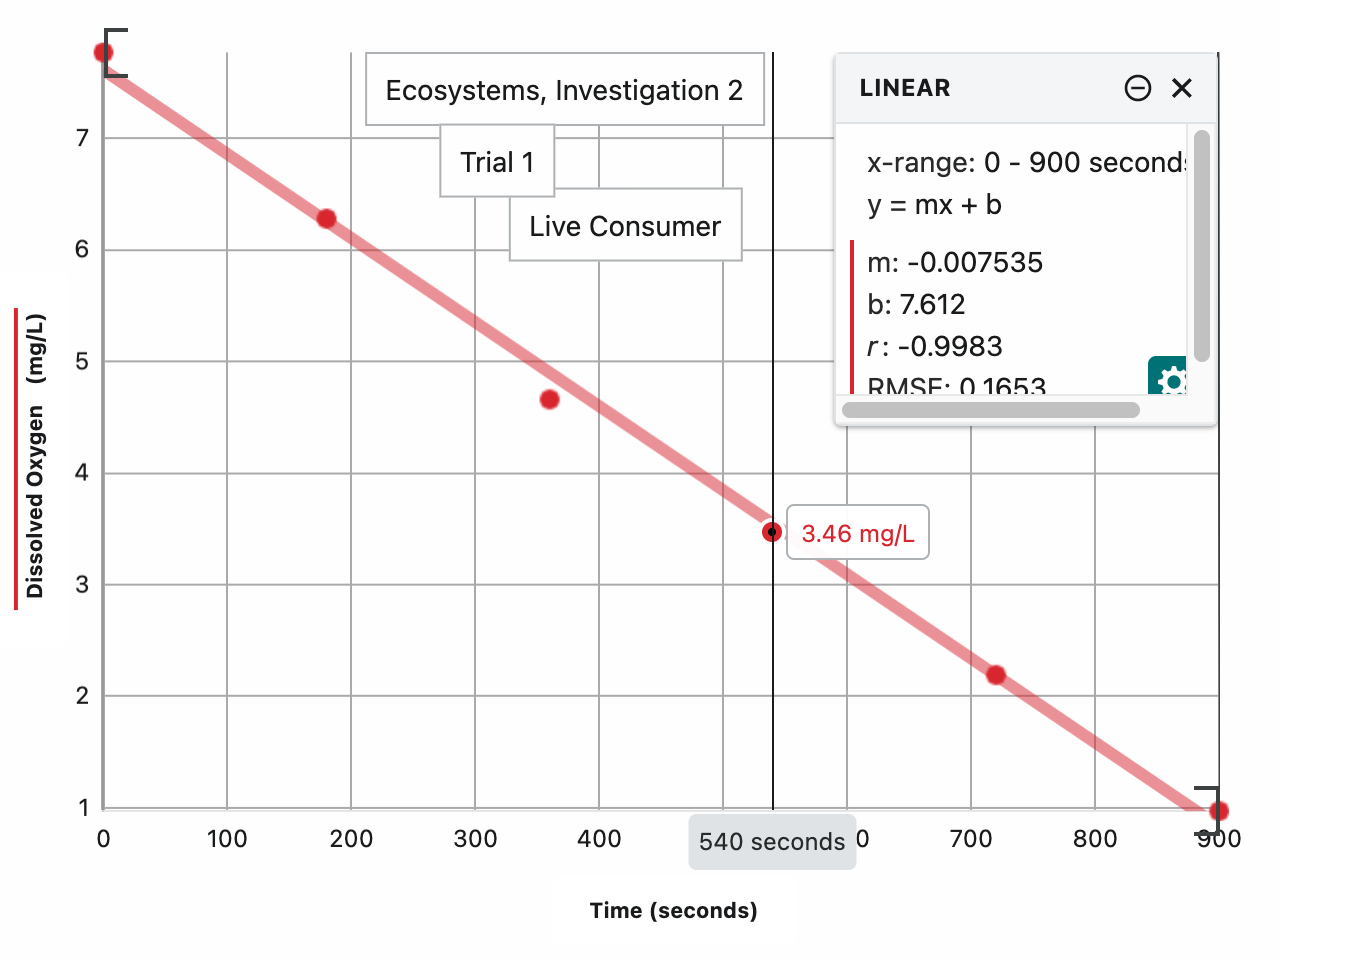
- Create a line graph (using a best-fit line) that shows the amount of oxygen used by the “Live Consumer” over time. Remember to start the graph by plotting the amount of oxygen that was in the beaker before the “Live Consumer” was added. Use the data from Tables A and B to create your graph.
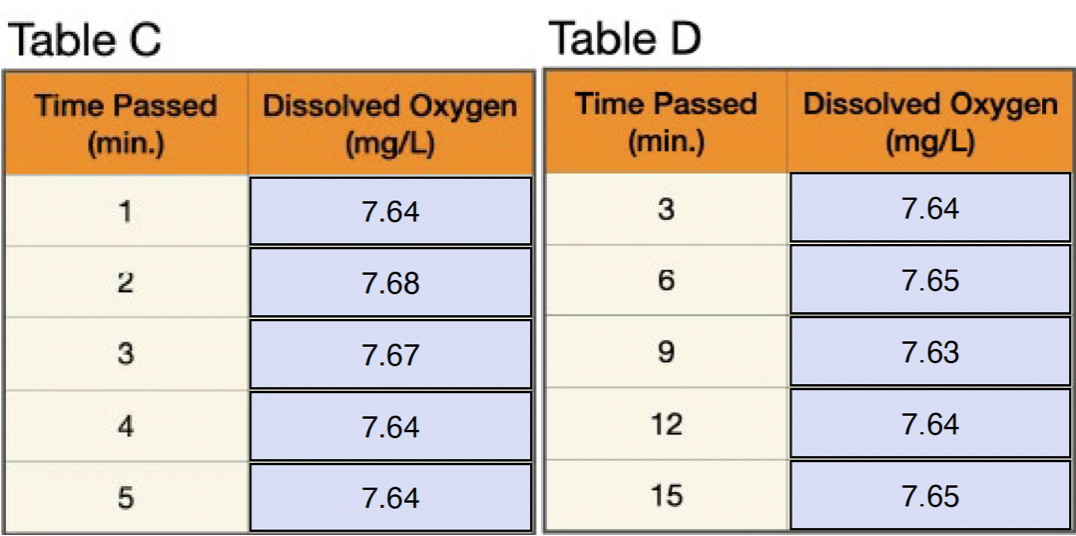
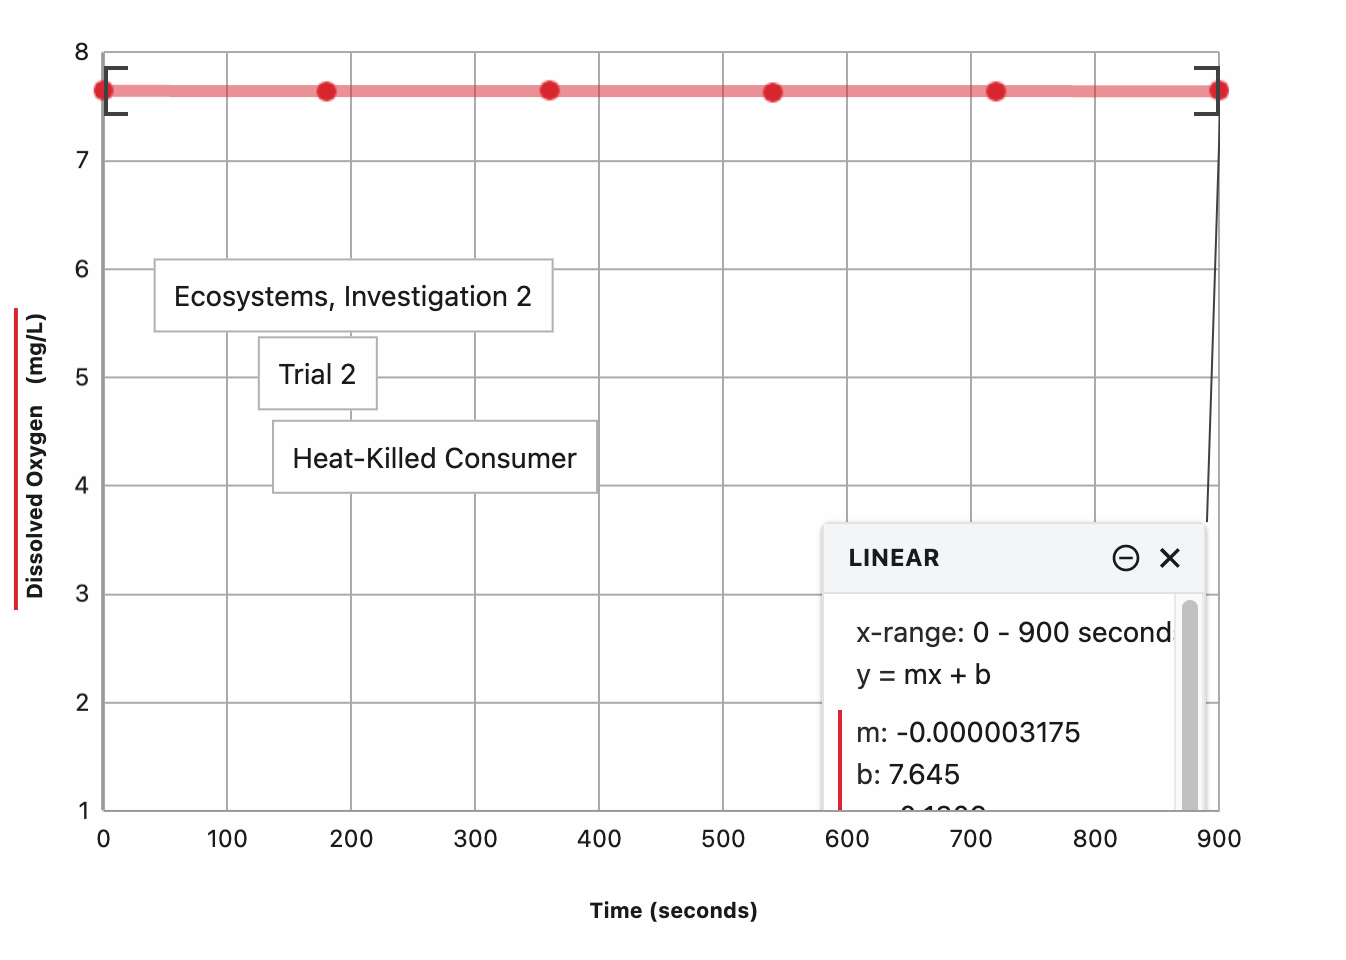
- Create a line graph (using a best-fit line) showing the amount of oxygen used by the “Dead Herbivore”. Remember to start the graph by plotting the amount of oxygen in the beaker before the “Dead Herbivore” was added. Use the data from Tables C and D to create your graph.
Note: Students may observe that the oxygen level initially decreases when the dead yeast is added to the beaker and infer that this decrease is due to oxygen consumption by the yeast. However, the initial decrease in oxygen level is due to the increase in the volume of the solution, which dilutes the oxygen concentration. The oxygen level does not decrease due to cellular respiration by the yeast, as the oxygen level does not change during the remainder of the model.
- Look at the graph of the “Live Consumer.” What happened to the oxygen level over time? Oxygen levels decreased over time.
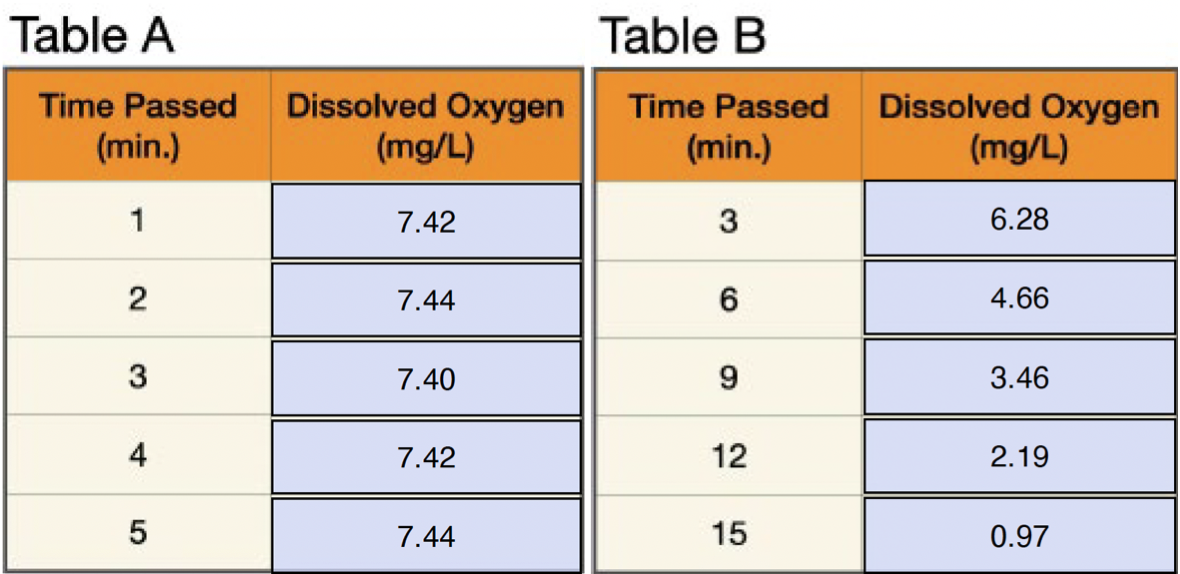
- Remember, the more oxygen that is used up, the more energy that an animal uses to live. Did the “Live Consumer” use energy to live? Explain your answer. The “Live Consumer” used energy to live because the oxygen level in the sugar solution decreased from 7.44 mg/L to 0.97 mg/L after the “Live Consumer” was added to the water. The oxygen levels before the addition of the “Live Consumer” did not change, indicating that the disappearance of oxygen after the addition was due to the use of energy by the “Live Consumer.”
- Look at the graph of the “Heat-Killed Consumer”. What happened to the oxygen level over time? Oxygen levels stayed the same.
- The more oxygen that is used up, the more energy that a consumer uses to live. Did the “Heat-Killed Consumer” use energy to live? Explain your answer. The “Heat-Killed Consumer” did not use any energy to live. The oxygen level remained steady at around 7.44 mg/L after the addition of the “Heat-Killed Consumer.” This indicates that the “Heat-Killed Consumer” was not using oxygen and, therefore, was not using energy.
- Describe the difference in the amount of oxygen that was used by the “Live Consumer” and the “Heat-Killed Consumer.” The live consumer used more and more oxygen as it continued to live. After 3 minutes the dissolved oxygen was 4.6 mg/L but after 12 minutes it was at 0.97 mg/L. The heat-killed consumer did not use any oxygen, as the data showed a steady rate of 7.64 mg/L.
- How does the data from the “Heat-Killed Consumer” show that cellular respiration is the reason for the decrease in the amount of energy available for transfer from the producers (plants) to the next level of the ecosystem? Both Trials contained sugar, yeast, and dissolved oxygen at the beginning of each experiment. The single difference between the two Trials was that in Trial 2, the yeast was dead. As the experiments progressed, the oxygen content of the solution decreased in the “Live Consumer” sample but did not decrease in the “Heat-Treated Consumer” sample. The only difference between the two Trials was that the yeast was undergoing cellular respiration in the Trial in which the oxygen level decreased. Therefore, the reason for the decrease in the amount of oxygen in the “Live Consumer” sample must be the use of oxygen, and thus energy, for cellular respiration.
 Investigation 3
- Ask students if Ecosystem ML100 had fewer levels than Ecosystem ML300. Student answers may vary. Some groups may have demonstrated that Ecosystem ML100 could only support two levels of Carnivores, while Ecosystem ML300 could support three levels. However, other groups may have found that both ecosystems supported the same number of levels.
- Ask groups whose ecosystems had the same number of levels how their ecosystems differed. In cases where both ecosystems had the same number of levels of carnivores, Ecosystem ML100 should be able to support fewer animals in each level
 due to the lower amount of plant biomass. The plant biomass would have supported fewer herbivores, which in turn would havesupported fewer Carnivores A, and thus fewer Carnivores B and C.
- Ask students why they think some groups found that Ecosystem ML100 supported fewer levels of carnivores than Ecosystem ML300 while other groups did not, given the fact that all groups had equal volumes of beans for each ecosystem. The differences observed between groups was a function of the
 average amount of biomass obtained from each ecosystem at the start of each model. There most likely was a large variation in sample size within each group’s ecosystems, as well as a large variation in sample sizes between groups. Therefore, the total amount of biomass would have varied between groups. This variation is an example of sampling error.
Note: Remind students that even though within their models they could have eliminated this variation by simply determining the total mass of beans for each ecosystem, their results illustrate one of the problems encountered by ecologists when studying ecosystems in real life.
- Ask students how they could have reduced the variation between groups for total biomass in order to obtain more consistent results when calculating animal numbers. Increasing the number of plant biomass samples taken within each ecosystem would have decreased the sampling error and increased the chance that all groups would have obtained the same results.
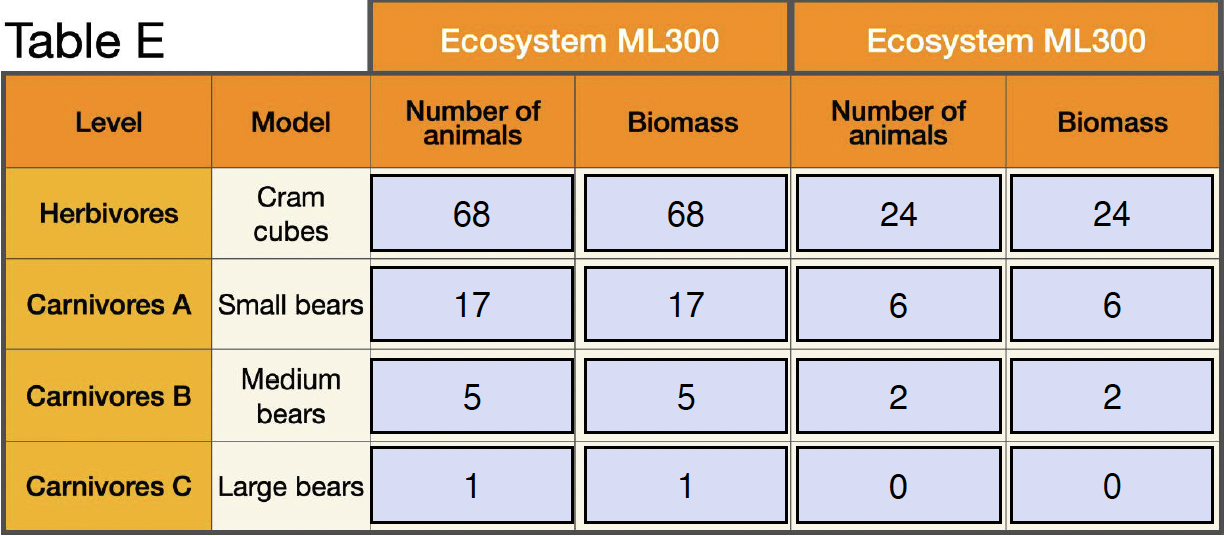
- Compare the two models. How does Ecosystem ML100 differ from Ecosystem ML300? Ecosystem ML100 had a smaller amount of plant biomass than Ecosystem ML300. This ecosystem also had fewer numbers of herbivores, Carnivore A animals, and Carnivore B animals than Ecosystem ML300, and did not have any Carnivore C animals. In addition there was less biomass at each level of the ecosystem in Ecosystem ML 100 than Ecosystem ML 300.
- Compare the amount of plant biomass in each ecosystem. What does the difference in biomass tell you about the amount of energy present in each ecosystem? Student answers may vary. The amount of biomass in an ecosystem determines the amount of energy present in an ecosystem because the energy is contained in the biomass. Therefore, the amount of energy present in Ecosystem ML300 is greater than the amount of energy present in Ecosystem ML100.
- Why was Ecosystem ML300 able to support more levels than Ecosystem ML100? Student answers may vary. Ecosystem ML300 had a greater plant biomass than Ecosystem ML100. The greater plant biomass in Ecosystem ML300 suggests that Ecosystem ML300 underwent more photosynthesis than Ecosystem ML100, allowing plants to create more biomass and thus store greater amounts of energy. The greater amount of biomass and stored energy in Ecosystem ML300’s plant level supported 68 herbivores, which supported 17 Carnivores A. The Carnivores A level had enough biomass to support 5 Carnivores B, supplying enough biomass to support 1 Carnivore C. In contrast, Ecosystem ML100 had enough plant biomass to support only 24 herbivores. The biomass in 24 herbivores supported 6 Carnivores A, which in turn supported 2 Carnivores B. There was not enough Carnivore B biomass to support any Carnivores C. Therefore, students should conclude that the number of levels in an ecosystem is dependent upon the amount of photosynthesis that occurs in the plant level.