Go Direct Light and Color Sensor

Collecting Light and Color Data
1. You will see the screen below when launching the Graphical Analysis™ app. All of the Go Direct sensors used by LabLearner, except the Go Direct SpectroVis Plus spectrophotometer, can be controlled through this interface.
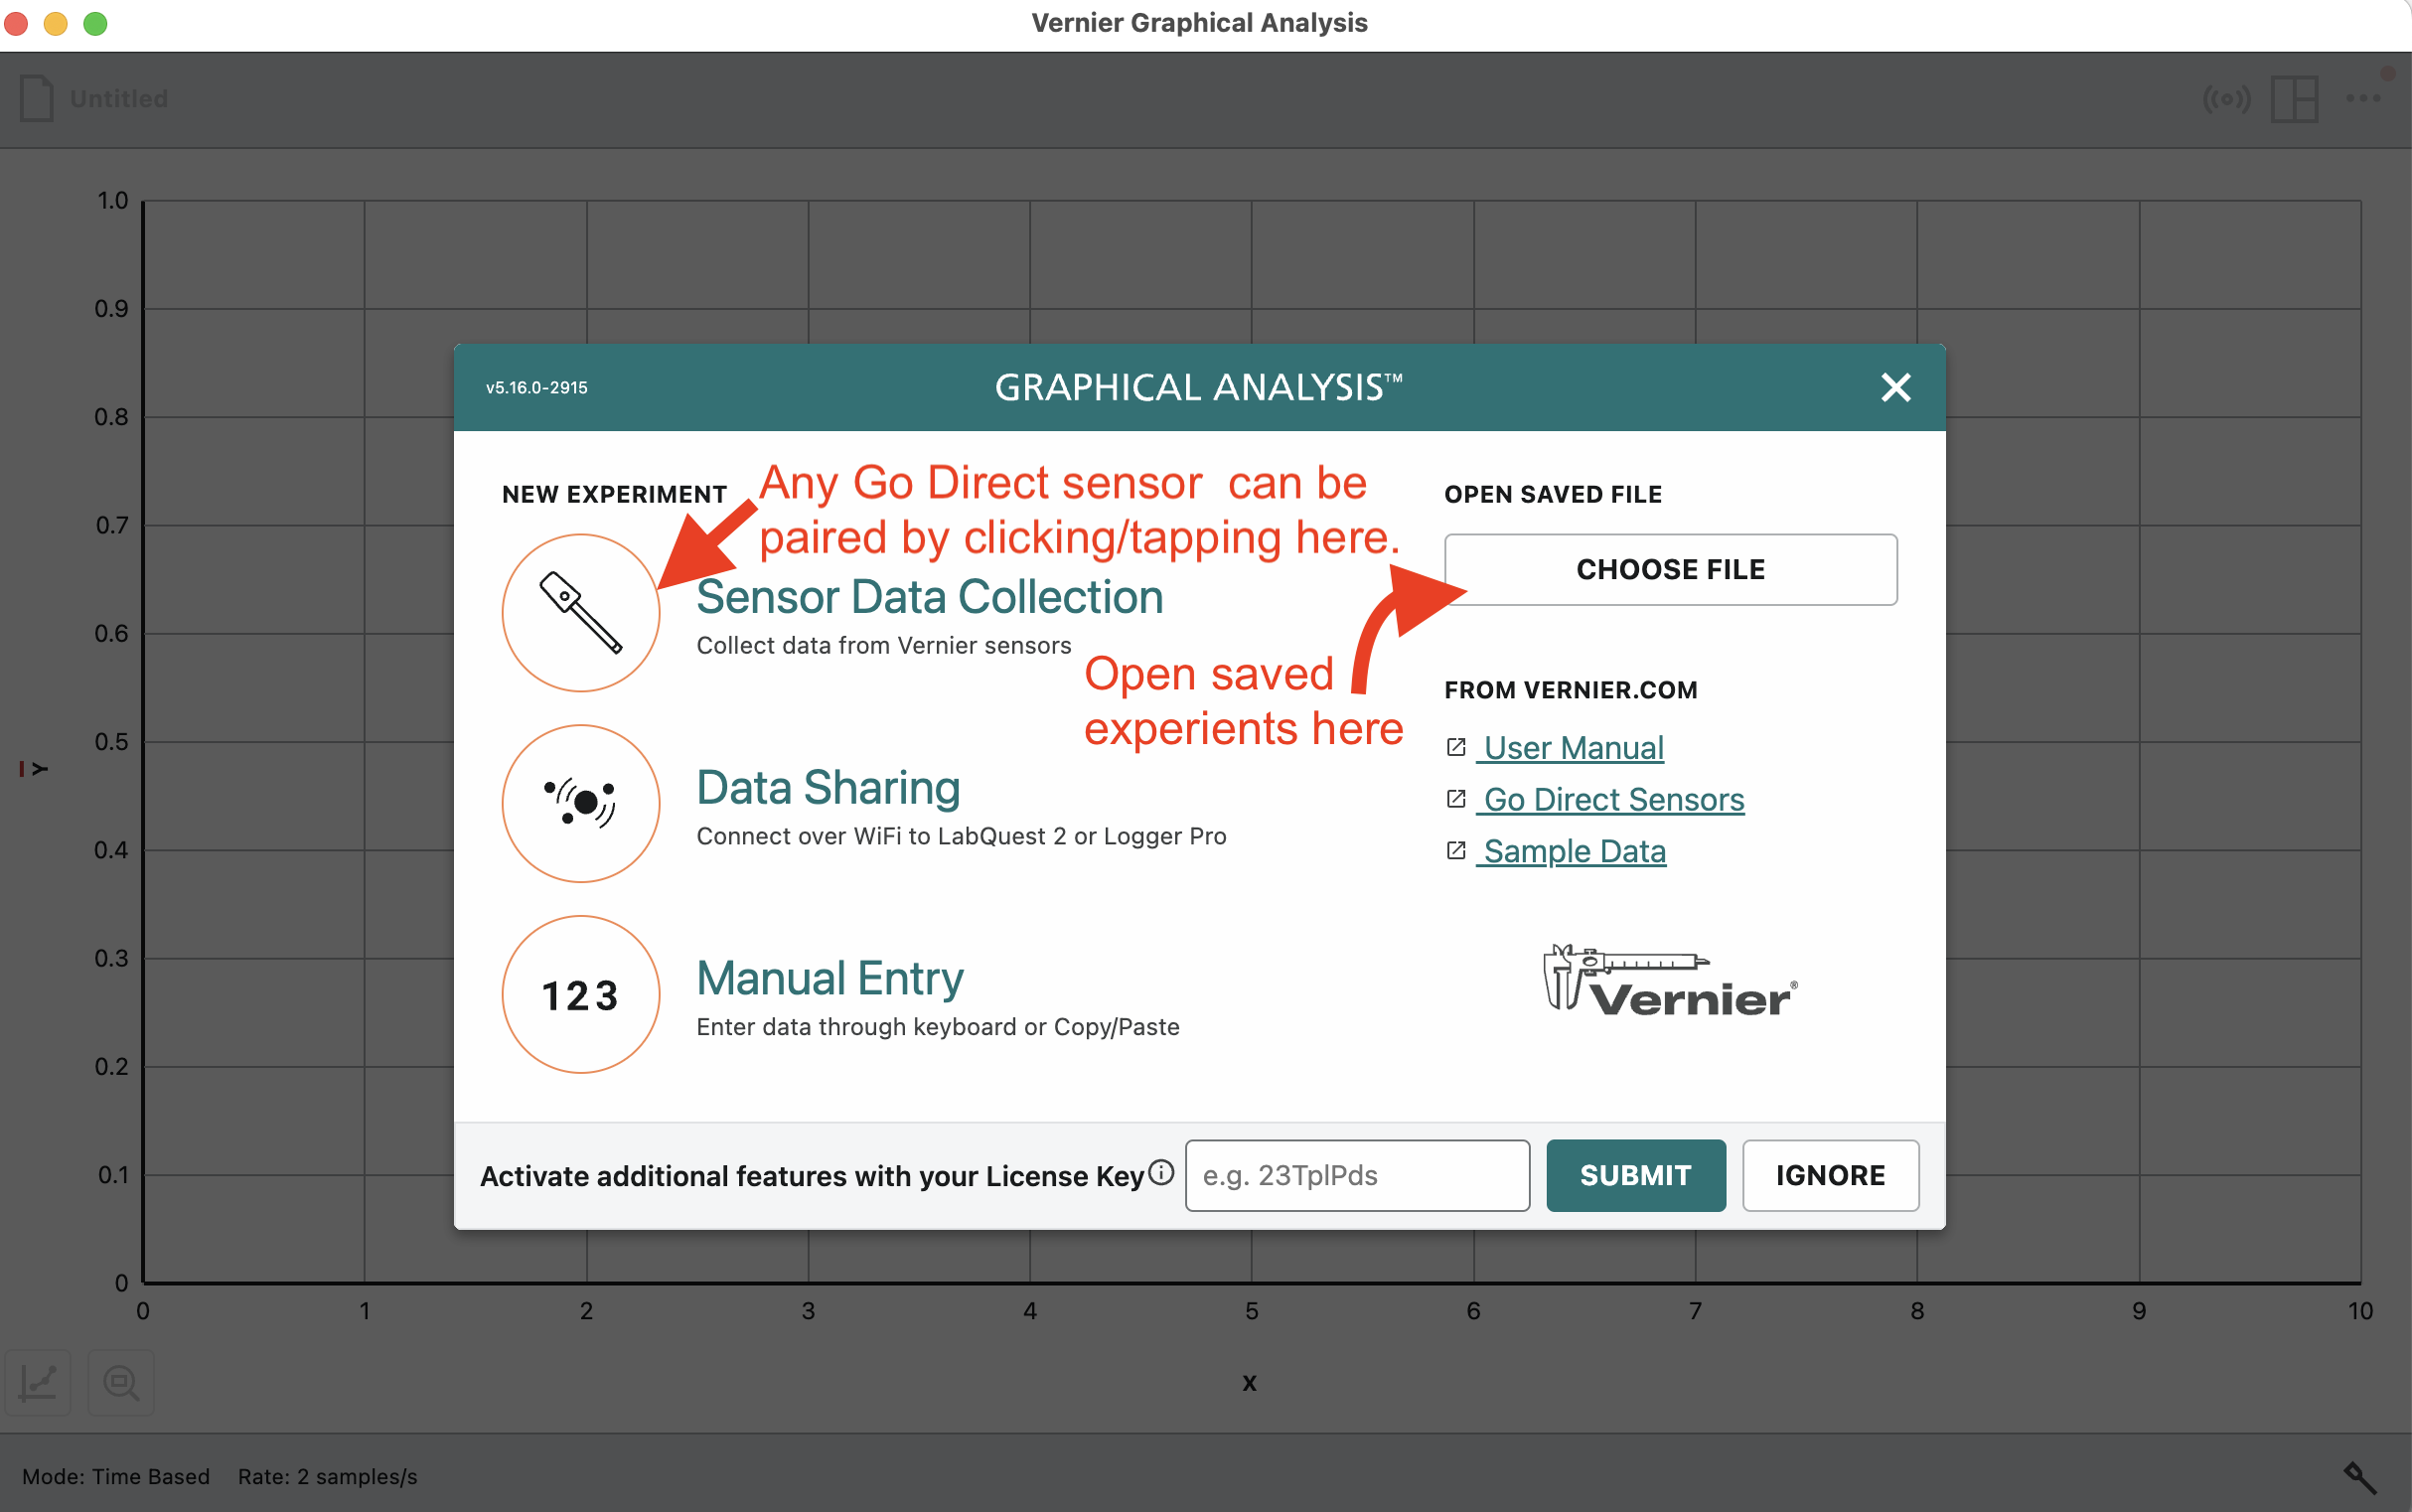
2. If you return to a previously saved experiment, you can re-launch it by clicking or tapping the CHOOSE FILE button. Once the saved file is loaded, you may continue collecting data and/or analyzing the data from the saved experiment.
3. Each Go Direct sensor has different settings. However, they are all paired similarly with the Graphical Analysis app.
4. Press and hold the power button on the light sensor until you see a blinking red light.
5. Click/tap the Sensor Data Collection button on the Graphical Analysis interface. You will see this window:
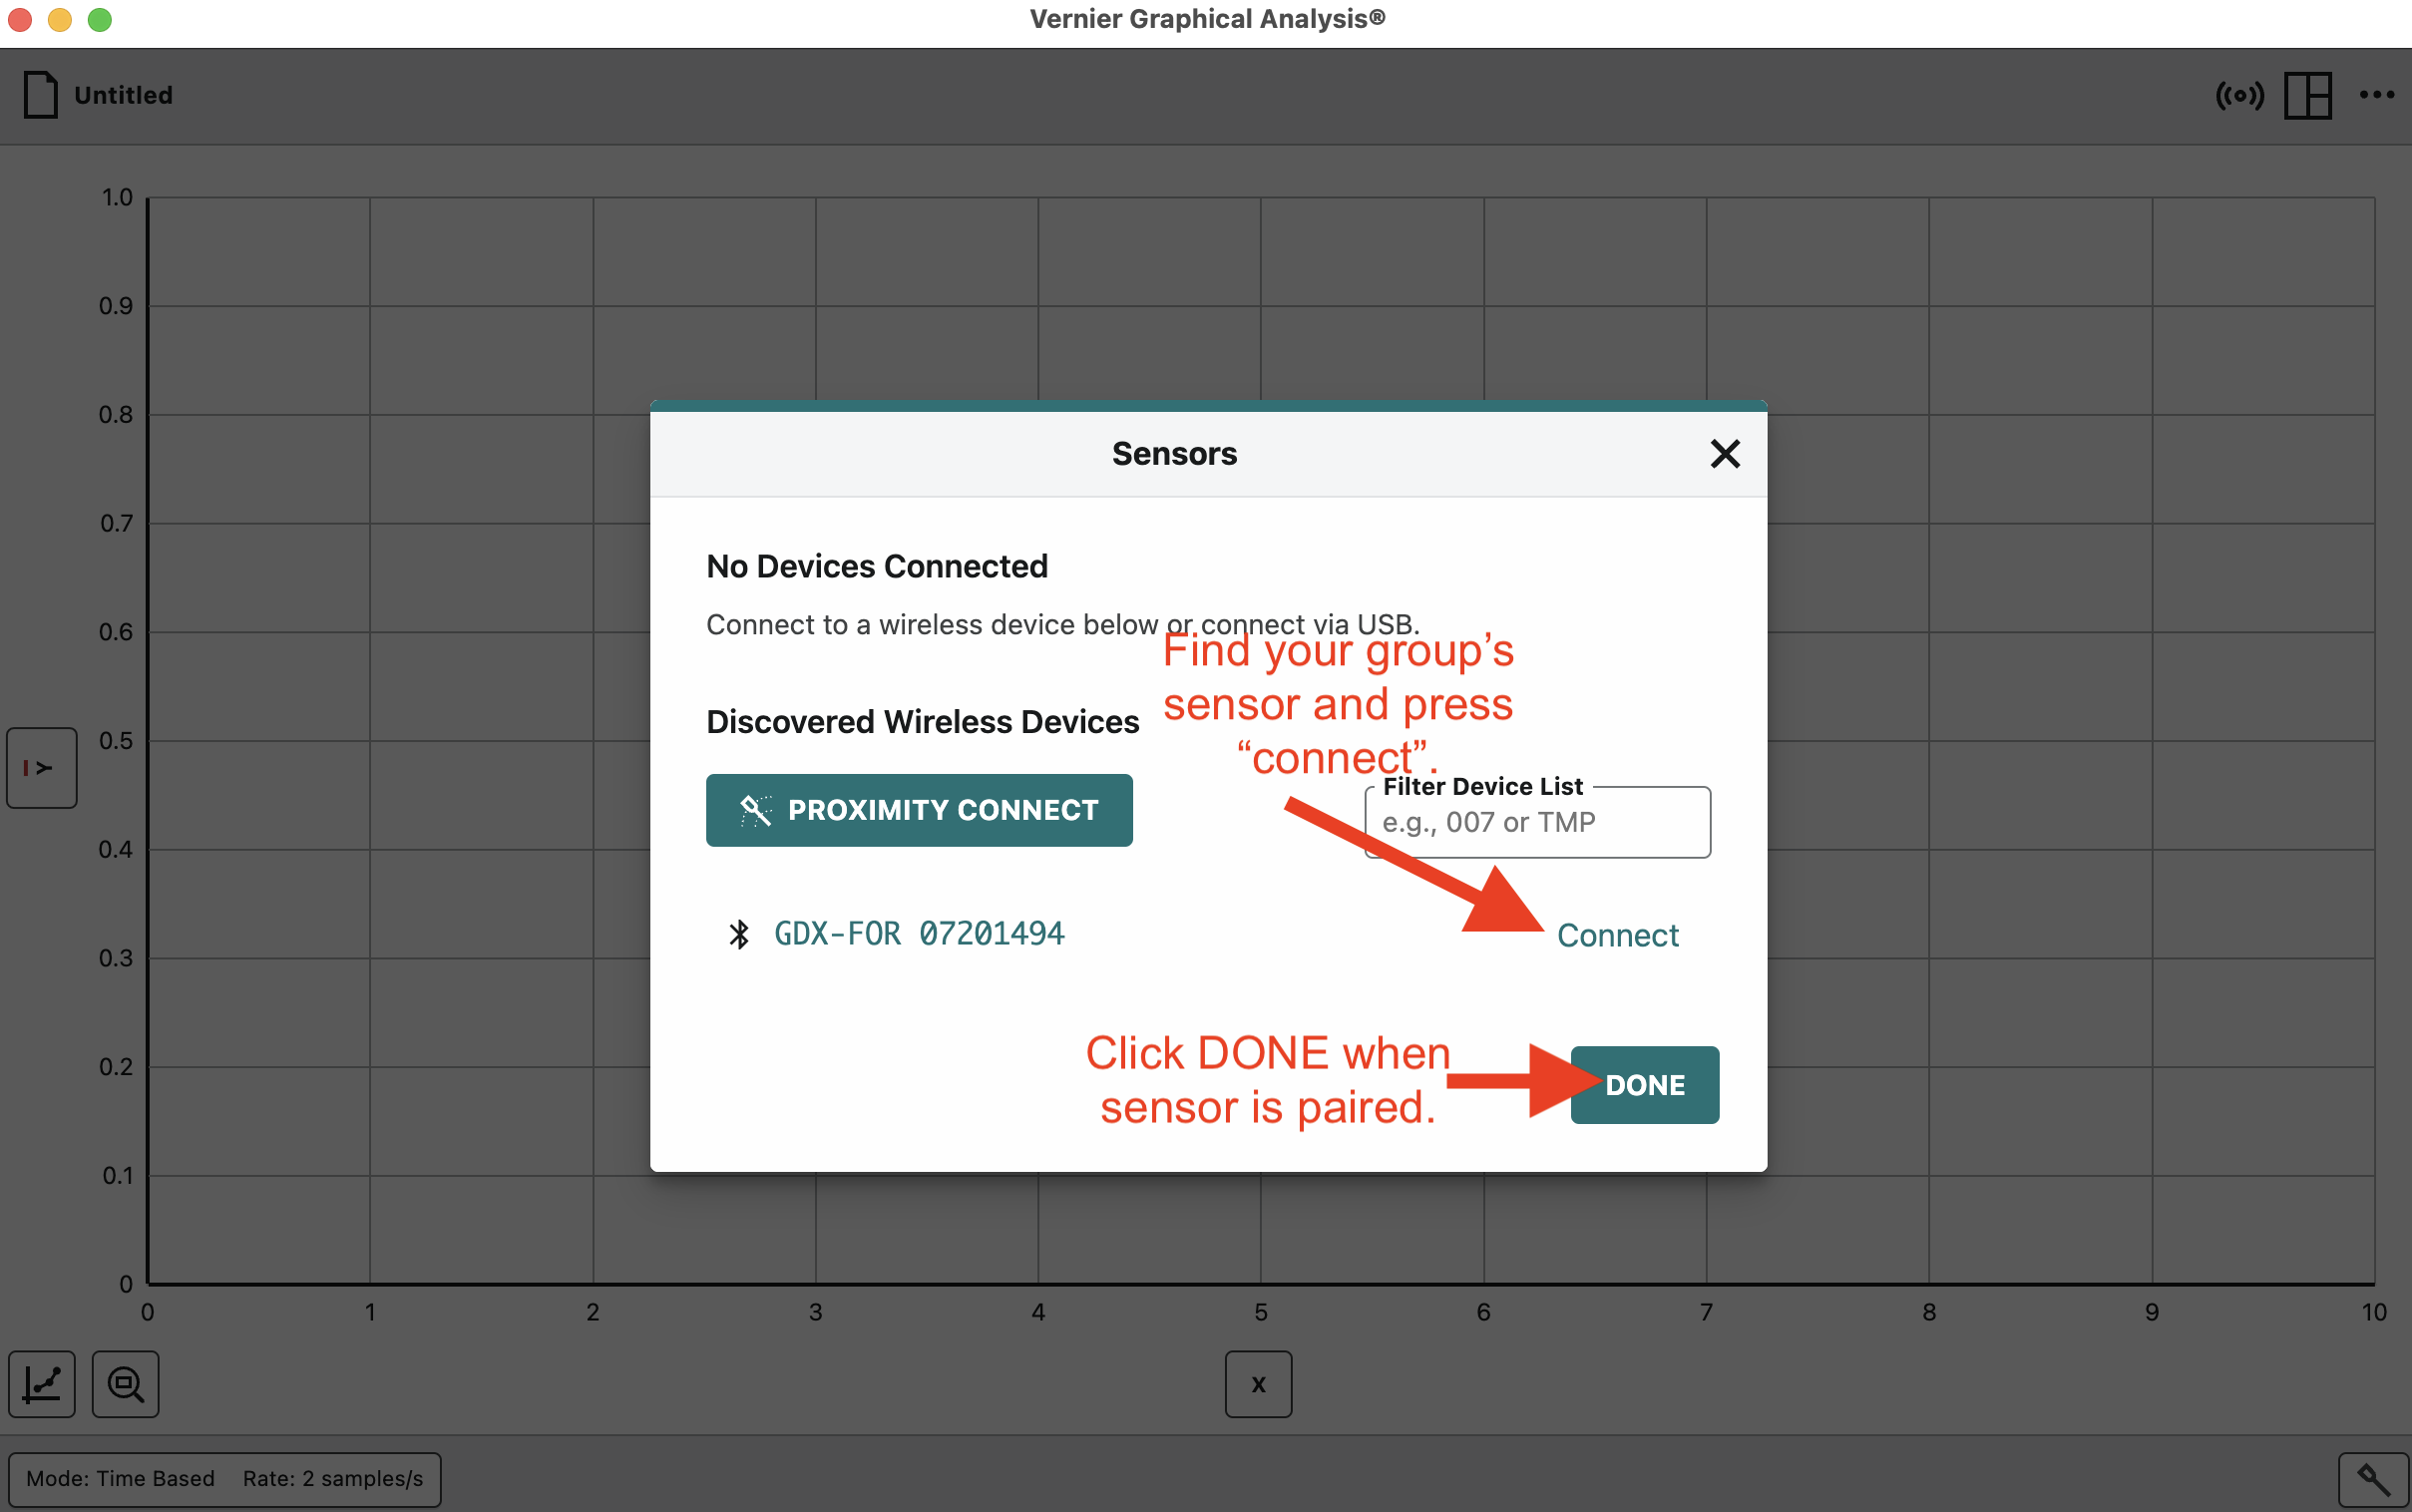
 6. There may be many sensors detected from other groups in the lab. Be sure to check the ID on your sensor and find it on the list.
7. When paired, your sensor will switch from flashing red to flashing green.
8. Once paired, click/tap DONE.
9. Once paired with the sensor, the following window will appear, and you are ready to start your data collection.

10. Click or tap COLLECT to begin collecting data.
11. As data is collected, you will see it appear in the data table to the right and its graphical representation on the left-hand graph.

12. Clicking or tapping STOP will discontinue data collection.
13. Once you have stopped collecting data, you may do several things by clicking the upper left button and selecting from the dropdown menu, as shown below.

14. Once you have finished data collection, hold down on the power button on your Go Direct sensor until the light goes out. Return the sensor to its proper storage location.