Teacher Portal:
Exploring Density
Investigation 3 – PreLab
 PRINT IT
Use your browser to download a printable PDF as help during the slide presentation and to make additional notes. In your browser, go to File > Print and then choose to save as PDF.
MINDSET
This Investigation is designed to:
- allow students to predict the relative densities of different liquids based on observations.
- demonstrate that different liquids possess constant but differing densities.
- graphically demonstrate the relationship between density and the mass and volume of different liquids.
- reinforce the concept that because the density of a single type of matter is constant, changing the mass or volume does not affect the density.
- provide students with the opportunity to review how to average several values for density.
- provide students with the opportunity to plot a line graph.
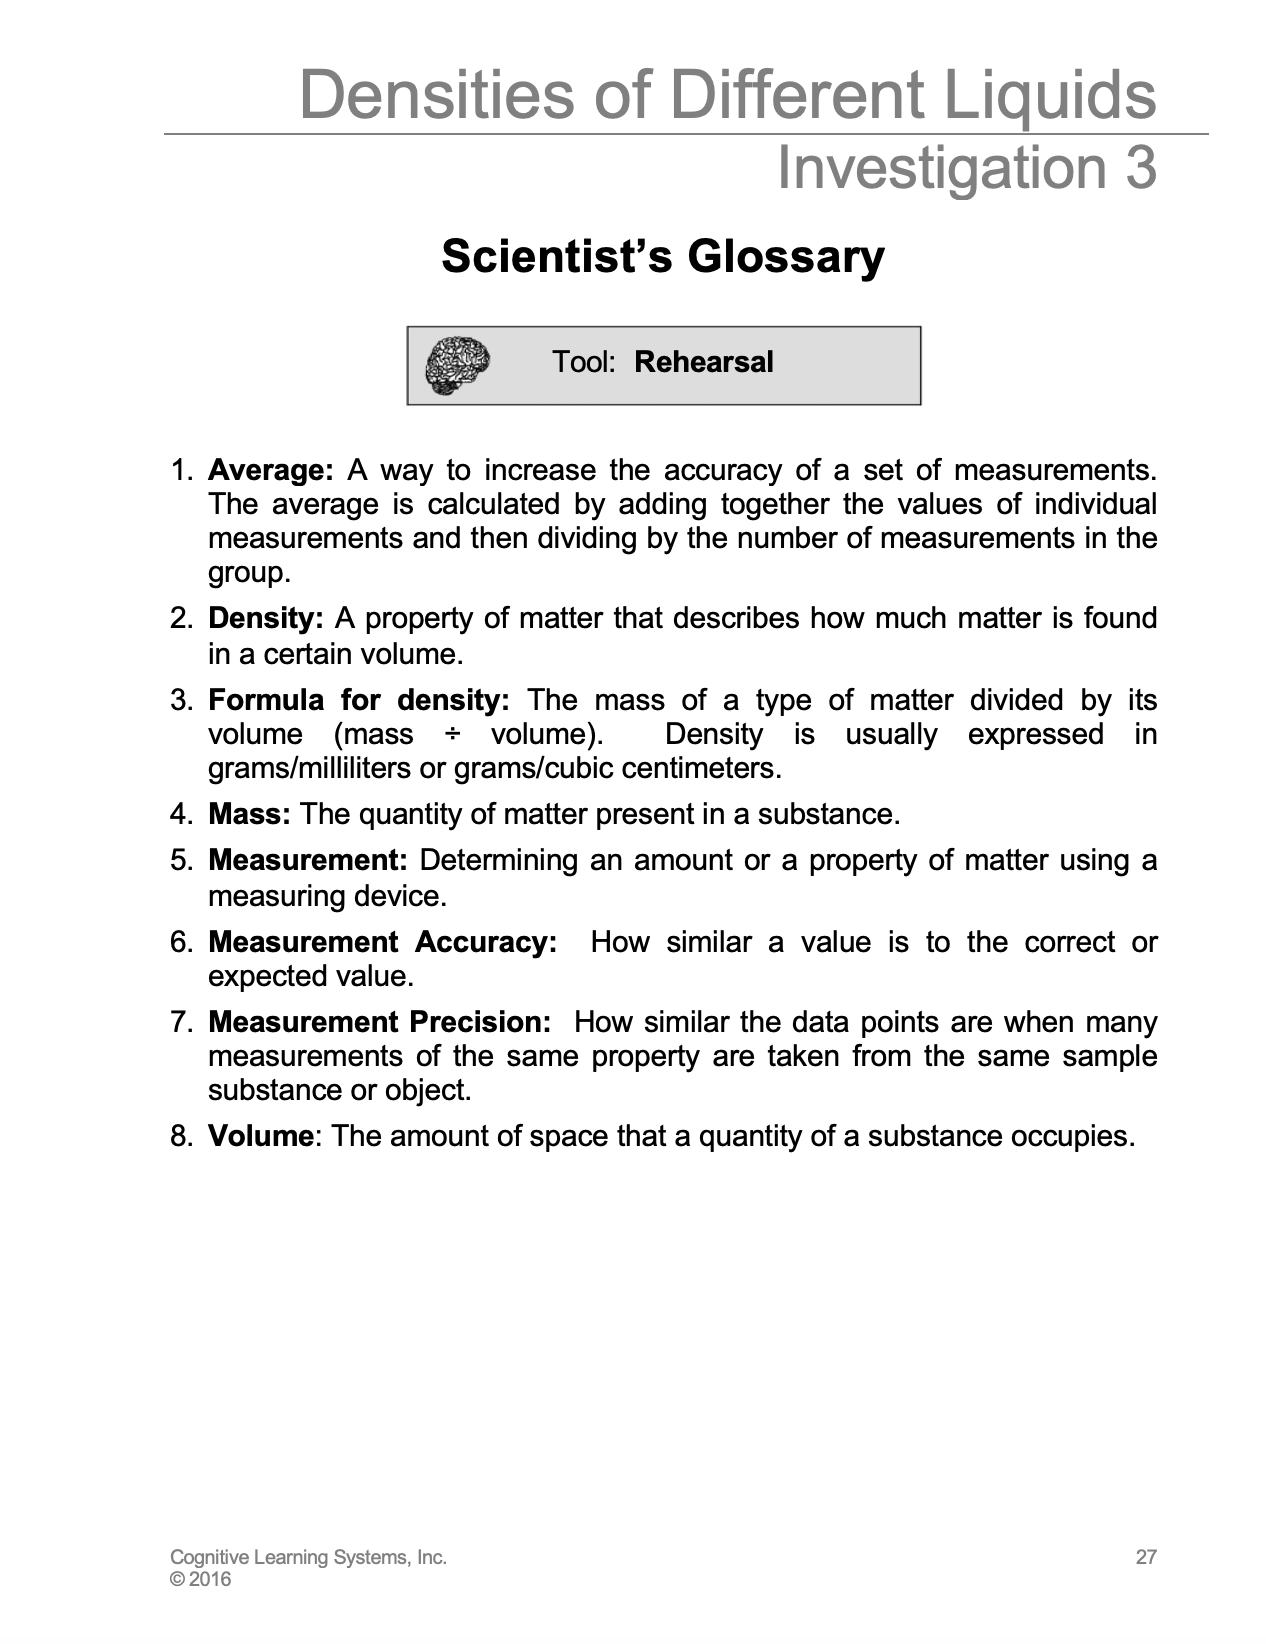
SCIENTIST’S GLOSSARY
1. Average: A way to increase the accuracy and the precision of a set of measurements. The average is calculated by adding together the values of individual measurements and then dividing by the number of measurements in the group.
2. Density: A property of matter that describes how much matter is found in a certain volume.
3. Formula for density: The mass of a type of matter divided by its volume (mass ÷ volume). Density is usually expressed in grams/milliliters or grams/cubic centimeters.
4. Mass: The quantity of matter present in a substance.
5. Measurement: Determining an amount or a property of matter using a measuring device.
6. Measurement Accuracy: The degree to which a measurement is similar to the true value.
7. Measurement Precision: The degree to which different measurements of the same property are similar to one another.
8. Volume: The amount of space that a quantity of a substance occupies.
BE PREPARED
Watch the Investigation 3 Teacher Video and Student Video below to prepare for the PreLab.
SET FOR SUCCESS
- Tell students that they will continue working on the Exploring Density CELL.
- Ask students to share the kinds of things they might learn in these Investigations.
Begin the PreLab Concept Slides to start students on their learning journey. Then watch the Pre-Lab Student Video afterward as a class.
NAVIGATE IT
Once the slide presentation is launched
- use your left and right arrows to advance or go back in the slide presentation, and
- hover your mouse over the left edge of the presentation to get a view of the thumbnails for all the slides so that you can quickly move anywhere in the presentation.
- Click HERE to launch the slide presentation for the CELL.
SHARE IT
SLIDE DEN3-pre-1
This is the third Investigation of the LabLearner CELL Density. In this Investigation, students determine the density of various liquids.
______________________________________________
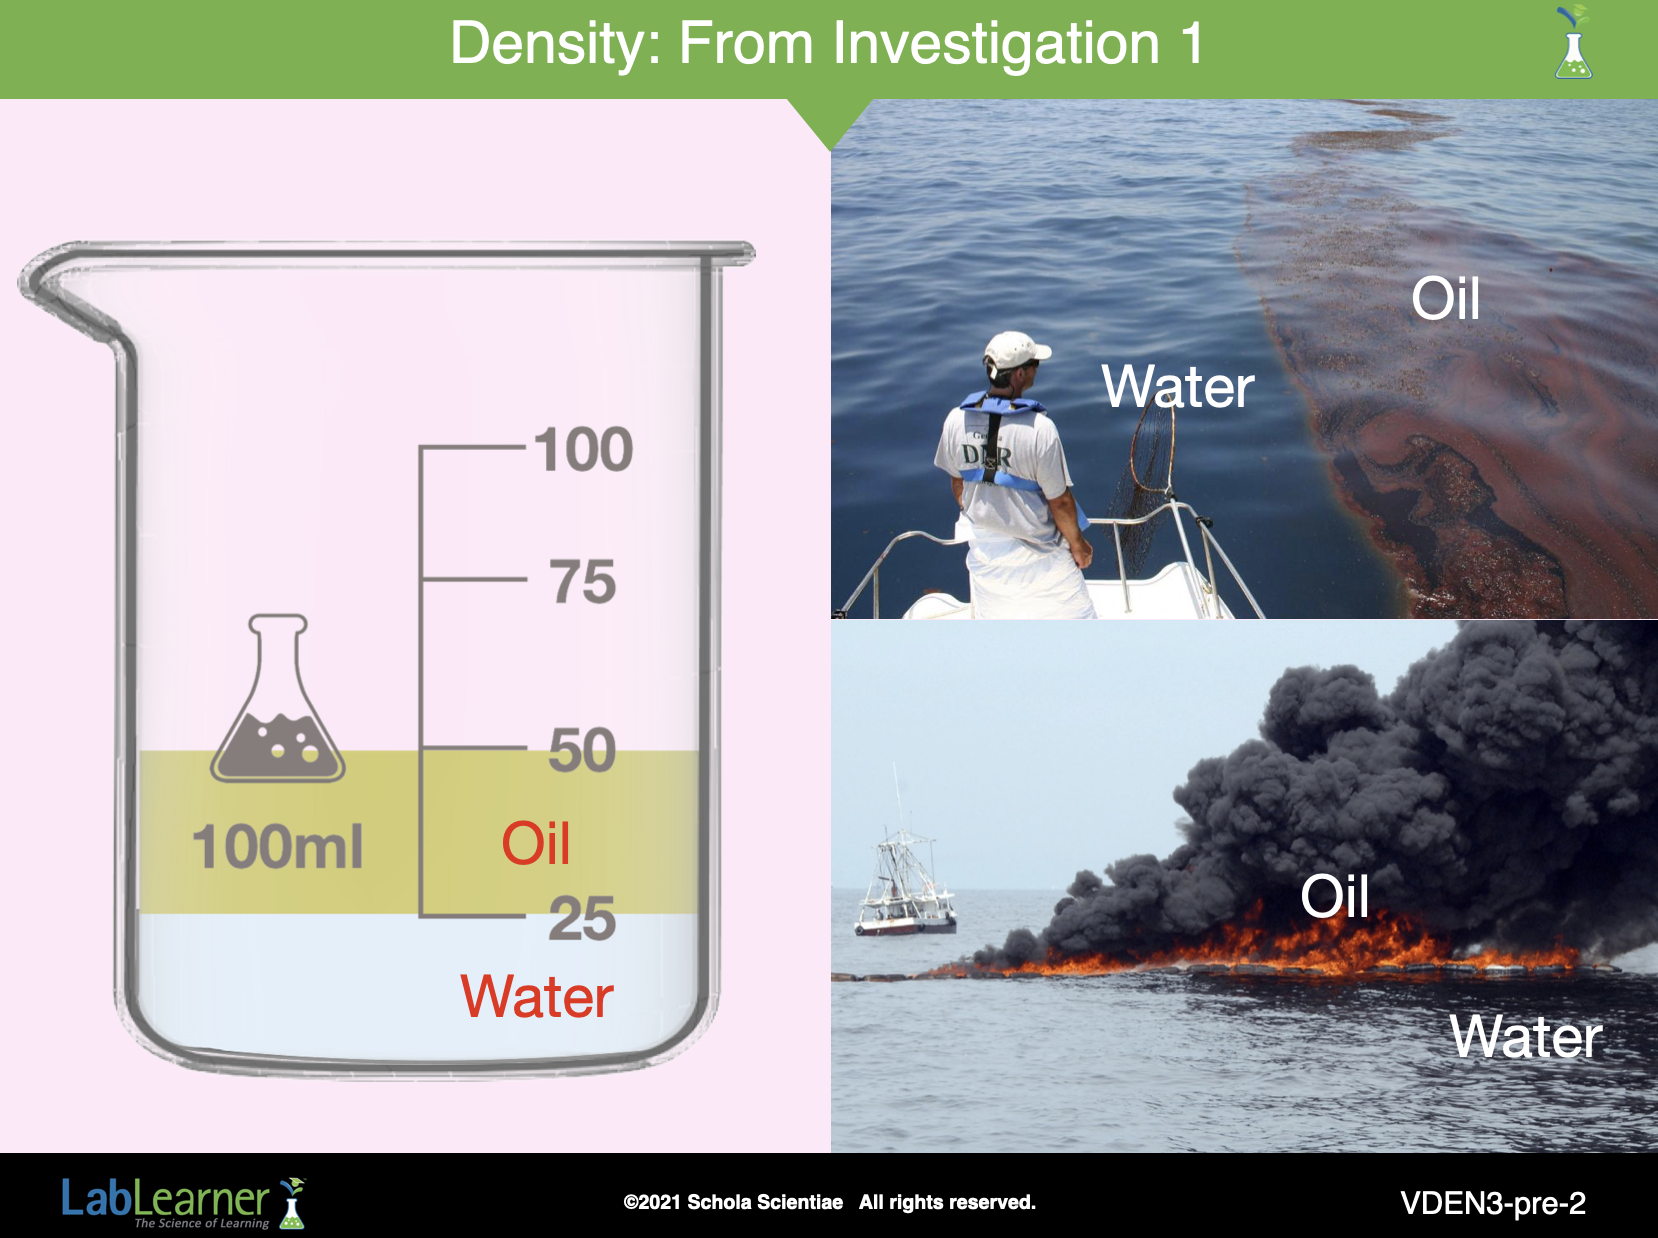
SLIDE DEN3-pre-2
This slide gives a stark example of a case of real-life relevance of density. Just as students demonstrated that vegetable oil floats on water in Investigation One Lab, oil accidentally released from the British Petroleum oil rig in the Gulf of Mexico floats on top of the ocean water. This property of the oil helped responders to collect some of the oil on the surface using “skimmers” and then pump it into storage tanks or, as shown on the right, start it on file so that it burns off. These approaches of course are directed at solving a problem that should not have occurred in the first place. Future technology must be directed at preventing such oil spills from occurring in the first place.
Tell students that as they begin Investigation Three you would like them to Recall what they know about matter and density. The following questions may be useful in prompting students’ recall:
1. Ask students: How would you describe density? Density is a property of matter that describes how much mass can be found in a certain volume.
2. Ask students: Which types of matter have the property of density? All matter – gases, liquids, and solids – have density.
3. Ask students: How can the property of density be calculated? Density is calculated by measuring the mass and the volume of matter and then dividing the mass by the volume.
______________________________________________
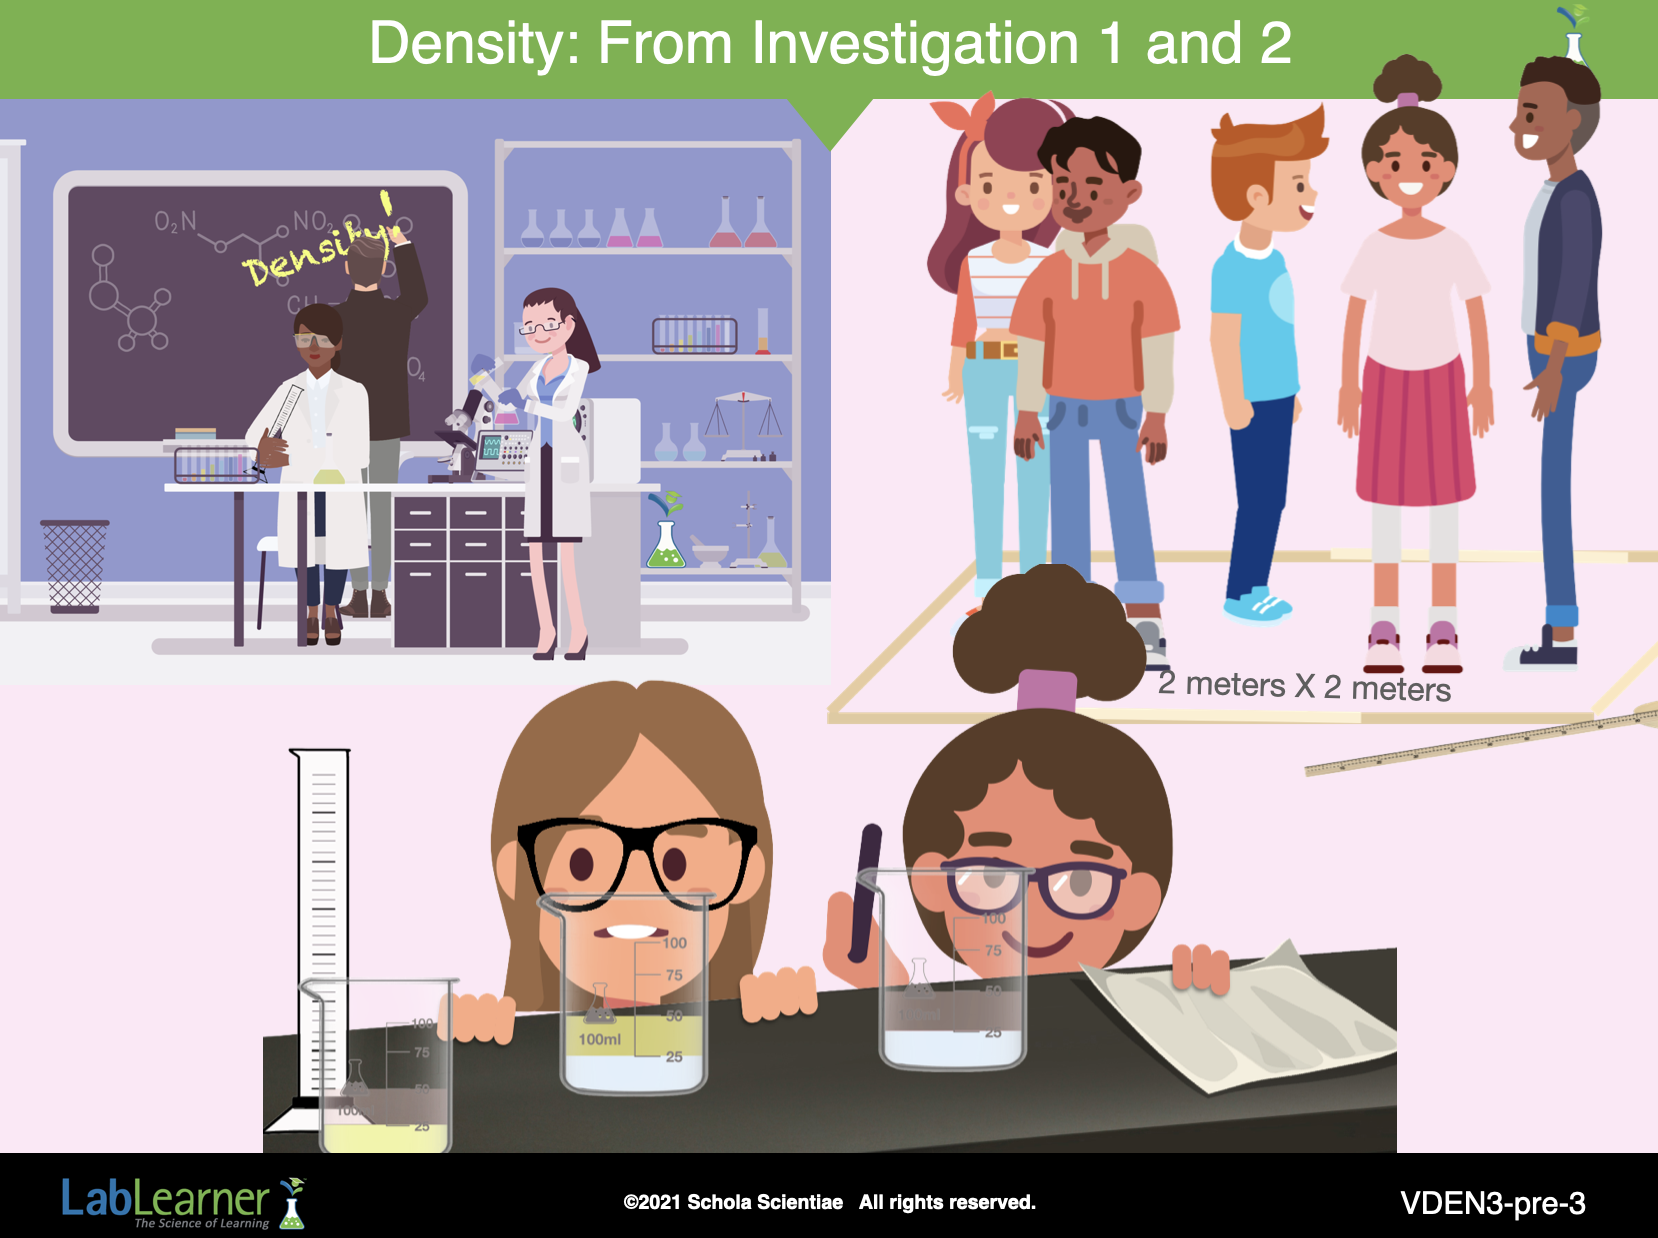
SLIDE DEN3-pre-3
A. Ask students to recall experiments they performed in both Investigations One and Two that dealt with density. In Investigation One, they experimented with rubbing alcohol, vegetable oil, water, ice cubes, and metal cubes. In Investigation Two, they experimented only with water.
1. Ask students: Did you draw any conclusions about the densities of the substances you tested in Investigations One and Two? How were the results from each investigation similar? How were they different? Students should indicate that they were able to draw conclusions about the densities of the substances in both Investigation One and Investigation Two. However, the types of conclusions they were able to draw were different. In Investigation One, students were able to determine if the substances were more or less dense than other substances. However, in Investigation Two, students were able to calculate or give an exact numerical value for the density of water.
2. Ask students: In Investigation Two what two measurements did you use to determine the density of water, a derived property? How did you calculate density from your measurements? Students determined the mass of a sample of water and its corresponding volume. Density is the ratio of the mass of a substance to its volume. By dividing the mass of the substance by its volume, students were able to calculate the density of the samples of water.
3. Ask students: What was the density of water obtained for the smallest sample of water? The largest sample of water? Did each group obtain the exact same value for the density of water for each sample? Students may wish to refer to the table in Problem 6a of their Investigation Two Scientist Data Record to answer this question. Students should indicate that the density of water for all samples of water was essentially the same, approximately 1 g/ml. However, students may indicate that each group did not obtain the exact same value for each sample.
4. Ask students: What were some reasons that each group did not obtain the same value for the density of the samples of water? Students should suggest that differences may have resulted from small differences in the measurements that each group made in measuring the mass or volume of each sample. Small differences may have existed in how students read the volume of water or the mass of the water on the triple beam balance.
5. Ask students: Despite the small differences, were you able to draw conclusions about the density of water? Did the density of water change when the sample volume of the water was changed? Students should indicate that the values they obtained were similar enough for the differences to be considered an experimental error. As a result, they were able to conclude that the density of water is approximately 1 g/ml and that the density of water did not change when the volume of the sample of water changed.
6. Ask students: Why is the density of water a constant? Students should indicate that as the volume changes, the mass also changes by the same magnitude.
______________________________________________
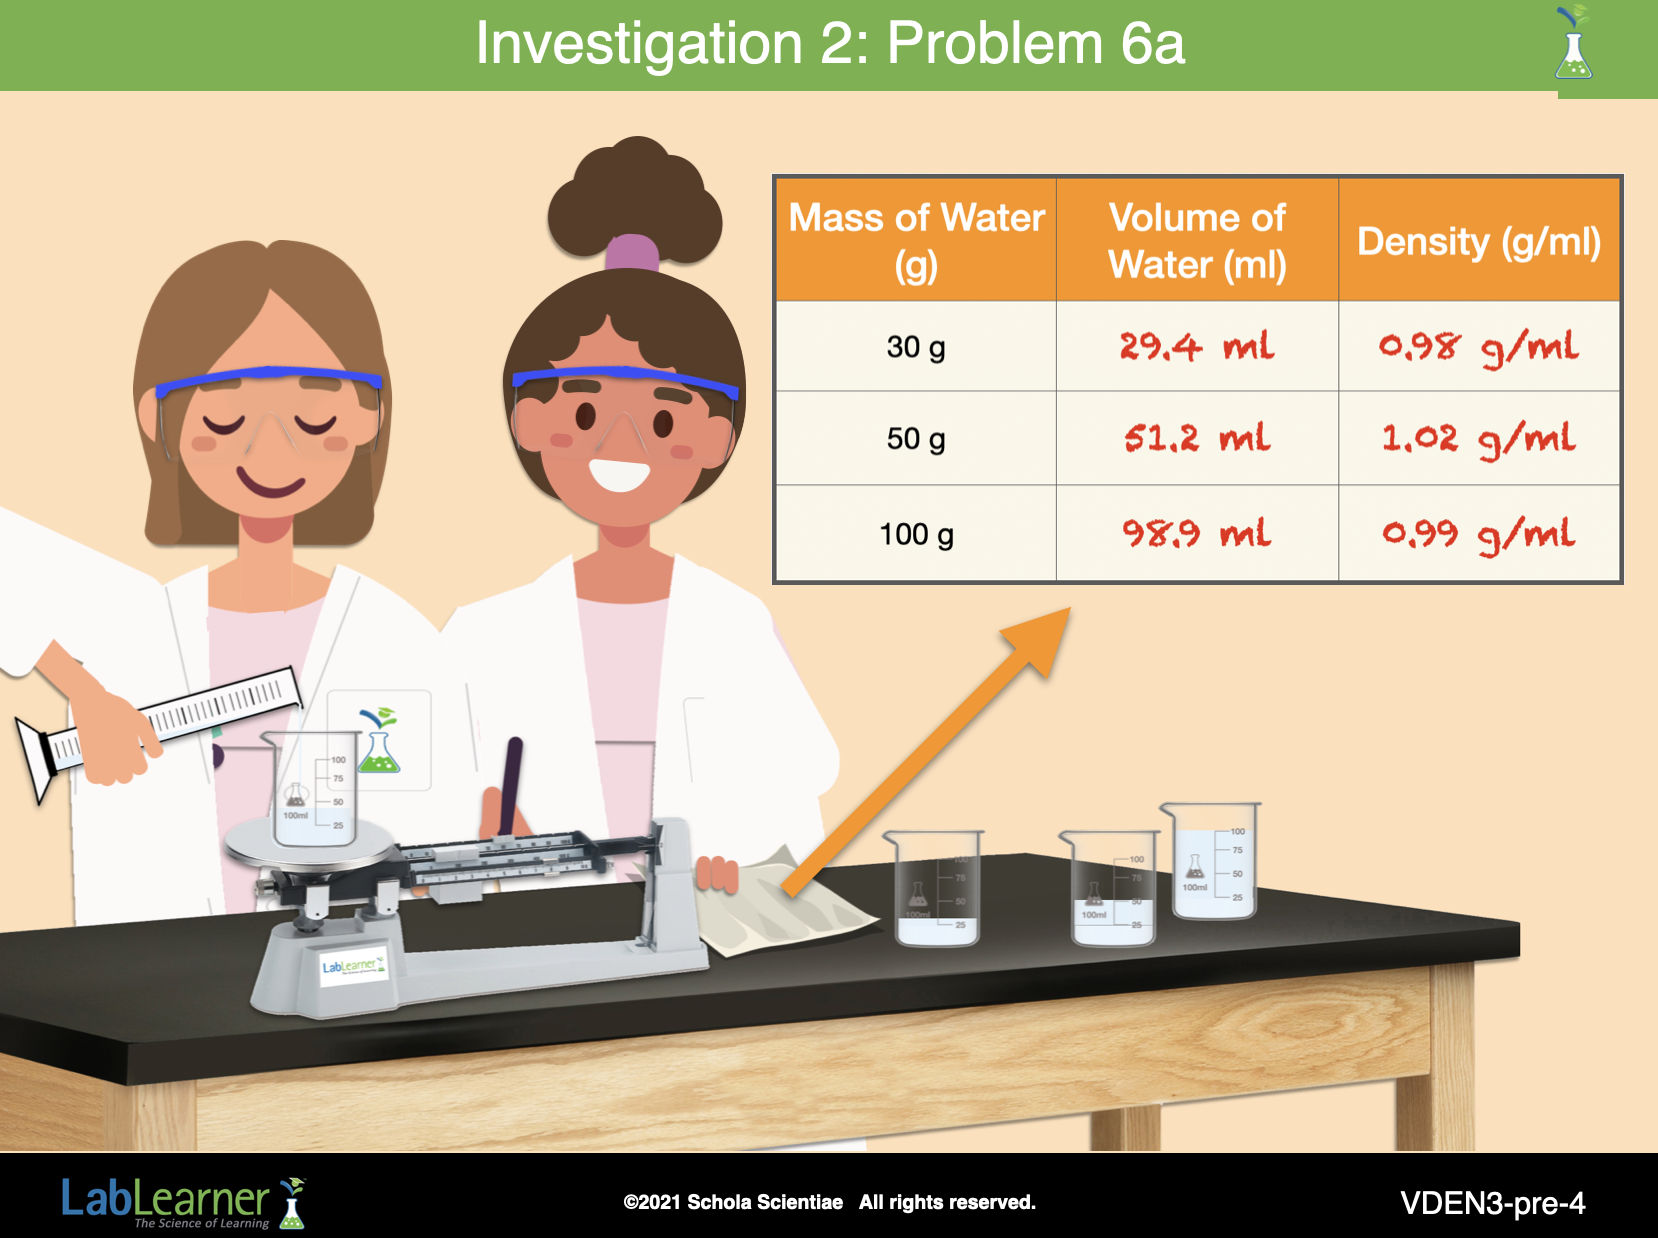
SLIDE DEN3-pre-4
B. Tell students that when small differences in measurements occur, scientists often correct for them in some way.
1. Explain to students that one way to correct for such differences is to average the calculated values. This gives an estimate of measurement precision.
2. Ask students to locate and read the definition of measurement precision in their Scientist’s Glossary.
“Measurement Precision: The degree to which different measurements of the same property are similar to one another.”
3. Explain to students that an average is calculated by adding together the values of individual measurements and then dividing by the number of measurements in the group.
_______________________
4. Divide students into five cooperative groups.
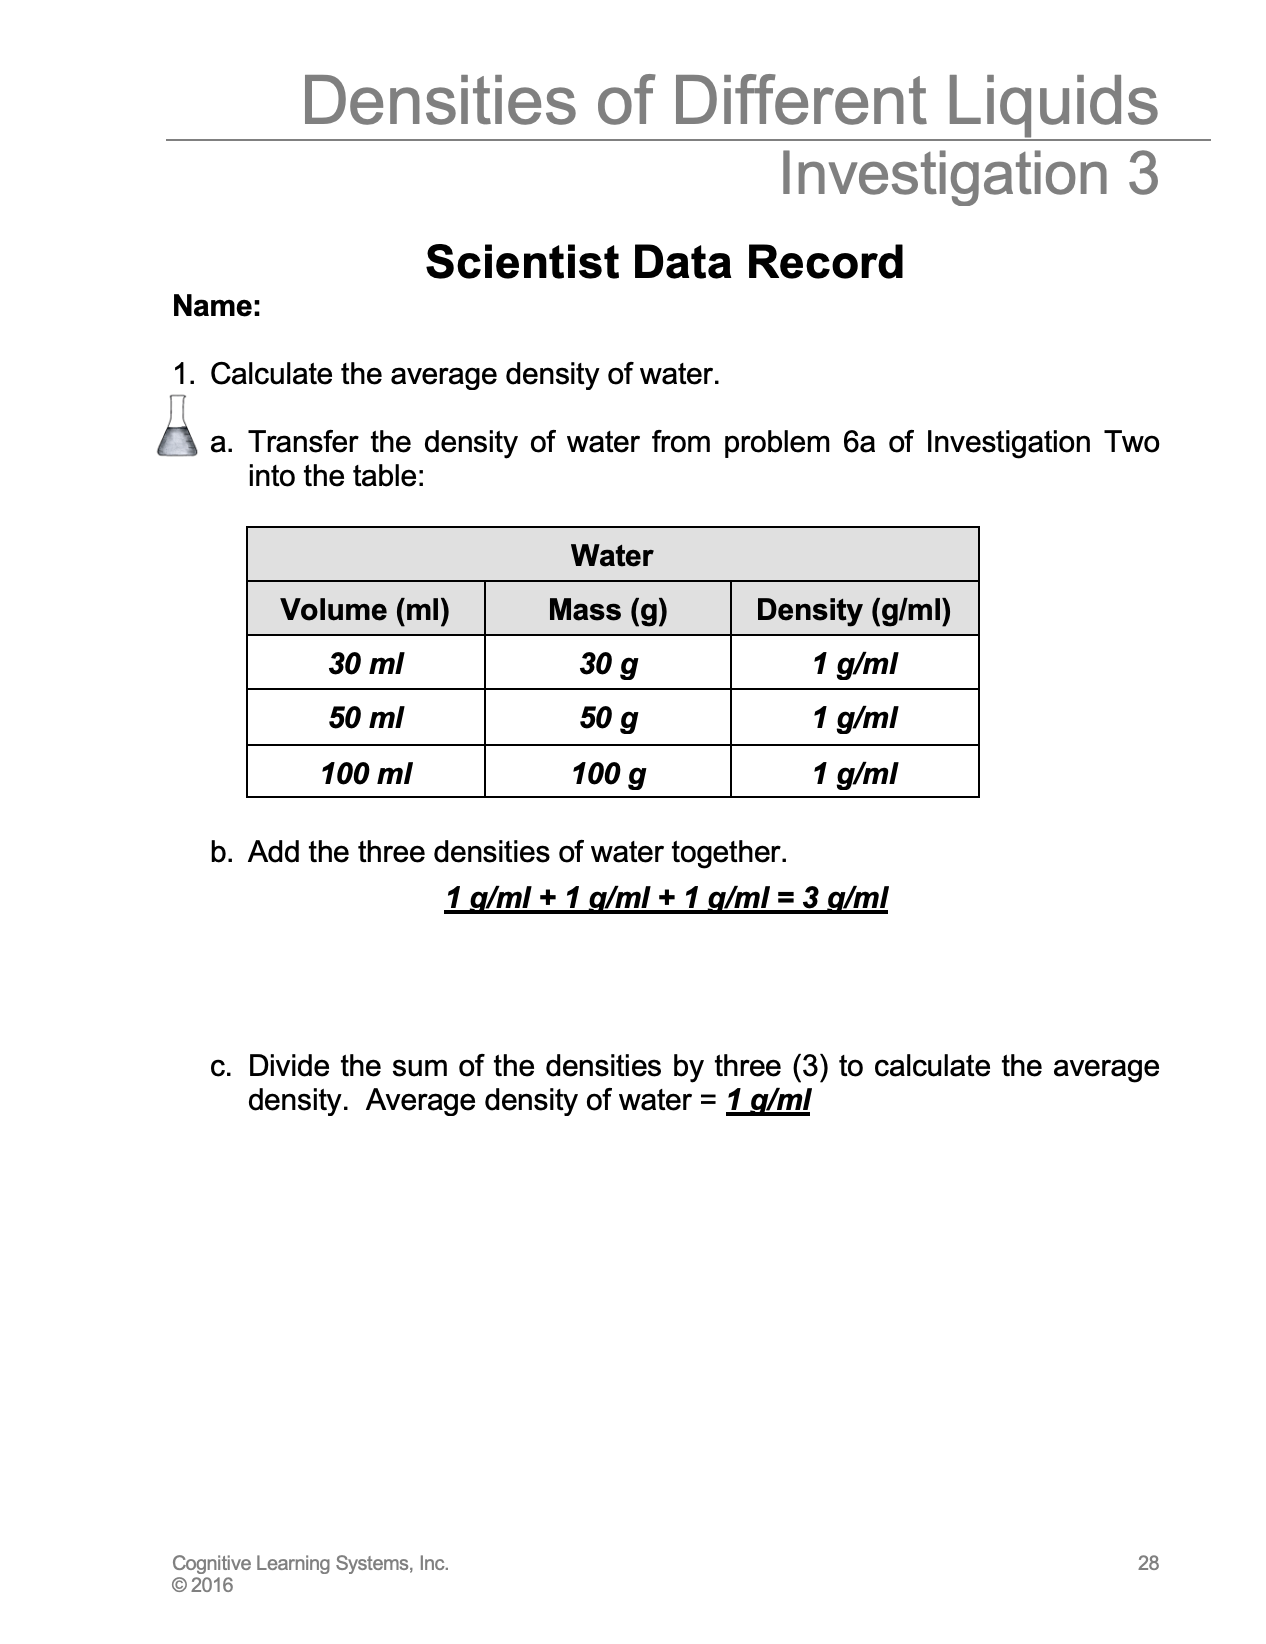
5. Ask students to refer to the Data Table in Problem 6a of their Student Data Record from Investigation Two. Instruct each student group to transfer the values for the density of 30 ml, 50 ml, and 100 ml samples of water in the Data Table in Problem 1a of their Student Data Record of Investigation Three.
a. Direct each group to calculate the average density for water. If students are having difficulty, use the following steps to help them calculate the average density.
• First, students should add together the three densities calculated in Investigation Two.
• Next, divide that sum by three.
• Encourage students to record the average in problem 1c of their Scientist Data Record.
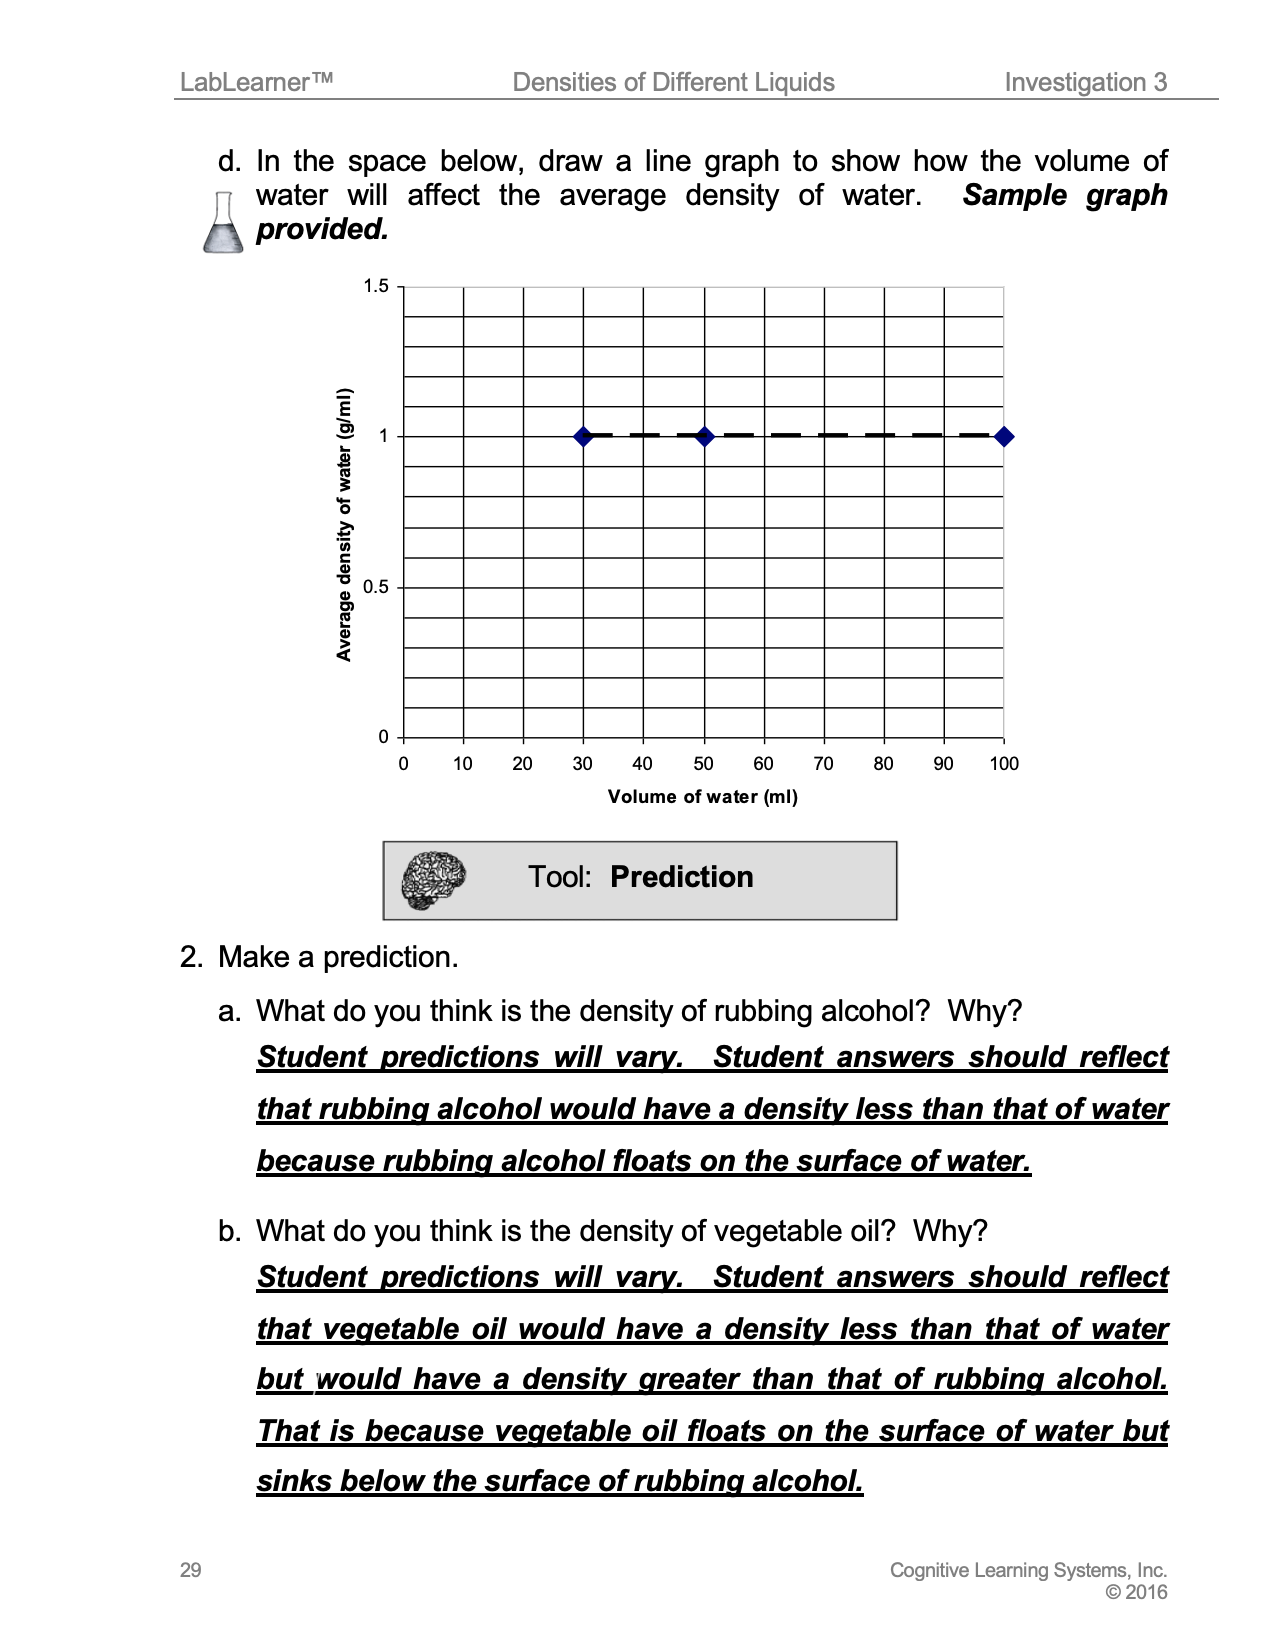
b. Explain that after each group determines the average density for each sample of water, they should create a line graph in the blank space in Problem 1d. Students should plot the volume of the water samples on the x-axis and the average density of each sample on the y-axis.
c. After students have completed their graphs, ask one group to share their graph by plotting the data on the board.
6. Ask students: Is the line graph that you just created more or less horizontal than the line graphs that you drew in Problems 7 and 9 from Investigation Two in your Student Data Records? The line graph should be more horizontal than any individual student group’s line graph.
7. Ask students: Why do you think the line you graphed using the average densities is more horizontal than that using your own group’s original data? Explain to students that by averaging the densities, small inaccuracies in their data were corrected.
______________________________________________
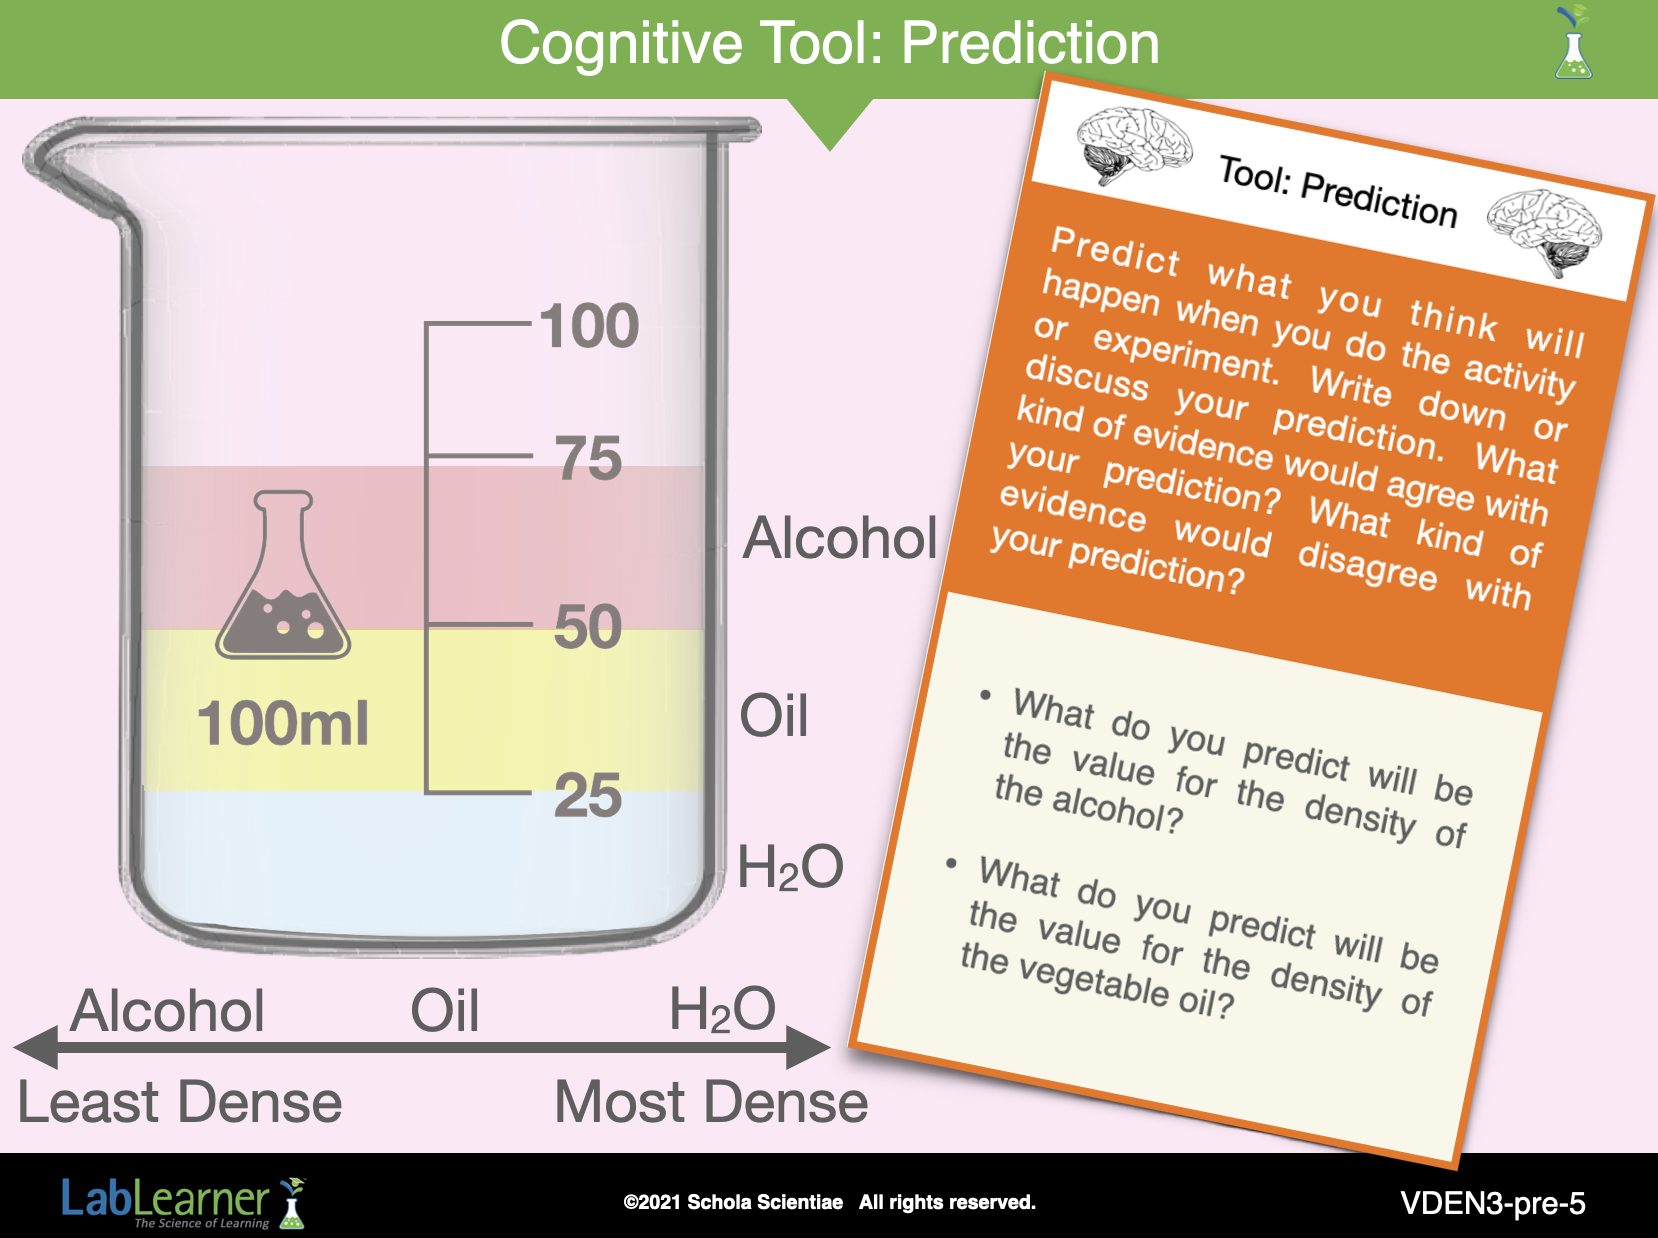
SLIDE DEN3-pre-5
C. Explain to students that in Investigation Three, they will calculate the densities of two additional liquids: vegetable oil and rubbing alcohol (isopropyl alcohol). When it is time to analyze their data, they will determine an average density for each sample using the class data.
1. Remind students that they worked with vegetable oil, rubbing alcohol, and water in Investigation One.
2. Ask students: Do you remember which liquids had the greatest density? The lowest density? Water had the greatest density and rubbing alcohol had the lowest density. The vegetable oil had a density in between that of water and rubbing alcohol.
3. Ask students: How could you tell that one liquid was more dense than another liquid? Students should indicate that the liquid that was more dense sunk to the bottom of the beaker. The less dense liquid formed a layer above the more dense liquid.
Tool: Prediction
Remind students that the density of water is 1 g/ml.
Ask students: What do you predict would be the values for the density of rubbing alcohol? Vegetable oil? Why? Student predictions will vary.
Encourage students to record their predictions and the reasons for their predictions in Problems 2a and 2b of their Student Data Record.
______________________________________________
SLIDE DEN3-pre-6
D. Explain to students that in Lab, they will investigate different volumes of rubbing alcohol and vegetable oil in order to answer the following questions:
• Will different volumes of rubbing alcohol have different densities?
• Will different volumes of vegetable oil have different densities?
Student Video
Watch the Investigation 3 Student Video after the Share It presentation to prepare for the PreLab.
KEYS