Teacher Portal:
Investigating Heat
Investigation 1 – PostLab
 PRINT IT
Use your browser to download a printable PDF as help during the slide presentation and to make additional notes. In your browser, go to File > Print and then choose to save as PDF.
NAVIGATE IT
Once the slide presentation is launched
- use your left and right arrows to advance or go back in the slide presentation, and
- hover your mouse over the left edge of the presentation to get a view of the thumbnails for all the slides so that you can quickly move anywhere in the presentation.
- Click HERE to launch the slide presentation for the CELL.
SHARE IT
SLIDE VHEAT1-post-1
A. Begin analysis of this Investigation by asking students to summarize the experiments they performed in the lab and the purpose of those experiments. The following questions may be posed as a method of prompting student discussion.
Ask students: What was the main question we wanted to answer in this investigation? The question students wanted to answer was: What is the relationship between temperature and the kinetic energy of molecules?
Ask students: How would you summarize the types of experiments you performed in the lab to answer these questions? Students observed a demonstration of a test tube filled with alcohol and capped with a balloon as it was immersed in a beaker of recently boiled water. This demonstration illustrated how molecules of alcohol respond when heated, or in other words when energy is transferred from substances of higher temperatures. Students placed thermometers in beakers of hot, warm, and cold water to determine the temperature of the water in each beaker. Students then added food coloring to each beaker to observe the effect of water temperature on the kinetic energy or movement of the molecules of food coloring and water molecules.
______________________________________________
SLIDE VHEAT1-post-2
B. Continue the discussion by asking students the following questions:
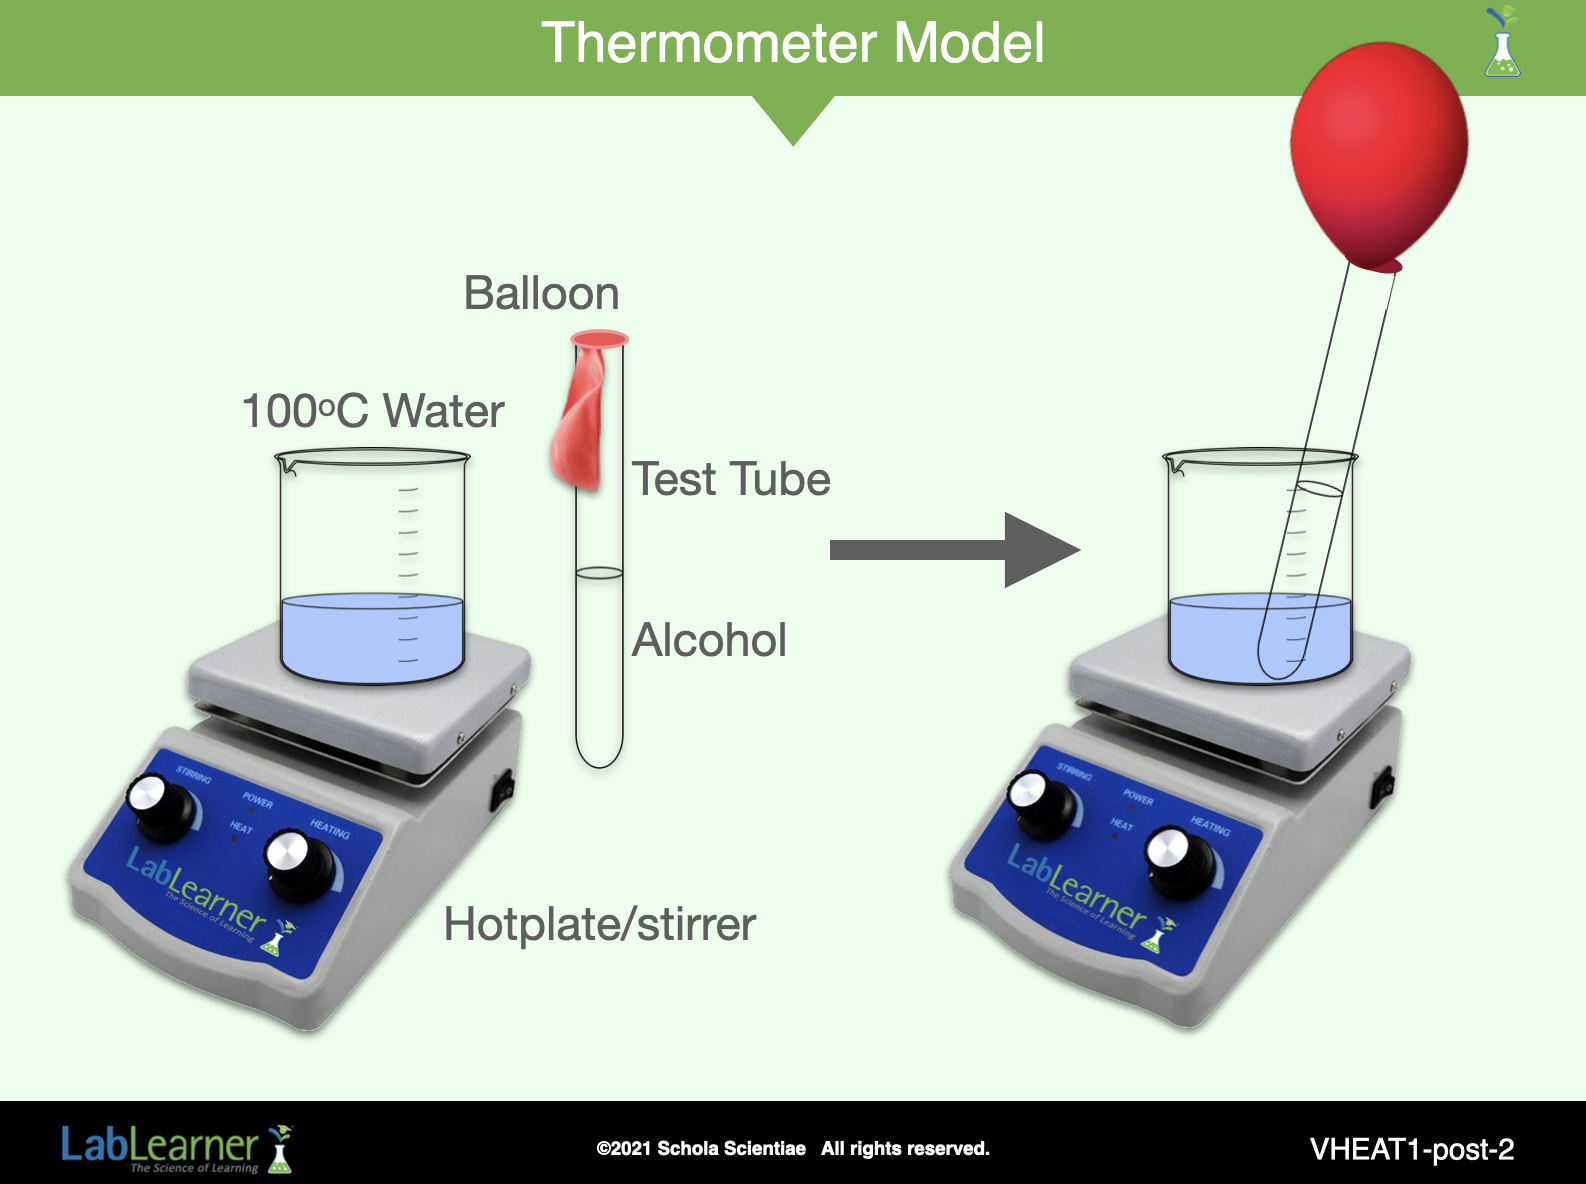
Ask students: What was the purpose of the alcohol/boiling water demonstration? Student answers may vary. The demonstration served as a model of a thermometer to illustrate how a thermometer works. When a thermometer is placed in a heated environment, the molecules of the liquid inside experience an increase in kinetic energy. As a result, they move faster and farther apart, and the alcohol in the bulb expands, forcing more alcohol into the tube. This is reported as an increase in temperature. Placing a thermometer in a colder environment causes the molecules to become less active or to have less kinetic energy. As a result, their motion slows and the distance between them decreases. This causes the alcohol to contract in the bulb. The contraction of the liquid lowers the level of the alcohol in the tube and is reported as a decrease in temperature.
Ask students: How is a thermometer similar to the test tube and balloon model? The alcohol in both systems expands when it is exposed to heat.
Ask students: How does a thermometer differ from the model? Why? Student answers will vary. A thermometer differs from the test/tube balloon model in that the tube and bulb of a thermometer cannot expand. Therefore, the alcohol molecules do not have enough space to expand into a gas and remain a liquid. As a result, the liquid rises up the glass tube. Students should also note that the model did not have a scale on it.
Ask students: What do you think was the purpose of Trials 2 – 5? Why did you measure the temperature of water in three beakers and test the behavior of food coloring in them? Student answers may vary. The purpose of Trials 2 – 5 was to observe the effect of increasing kinetic energy on the movement of water molecules and food coloring molecules. The temperature was measured to determine the speed of the molecules. Molecules move faster when heat, or kinetic energy, is applied to them.
______________________________________________
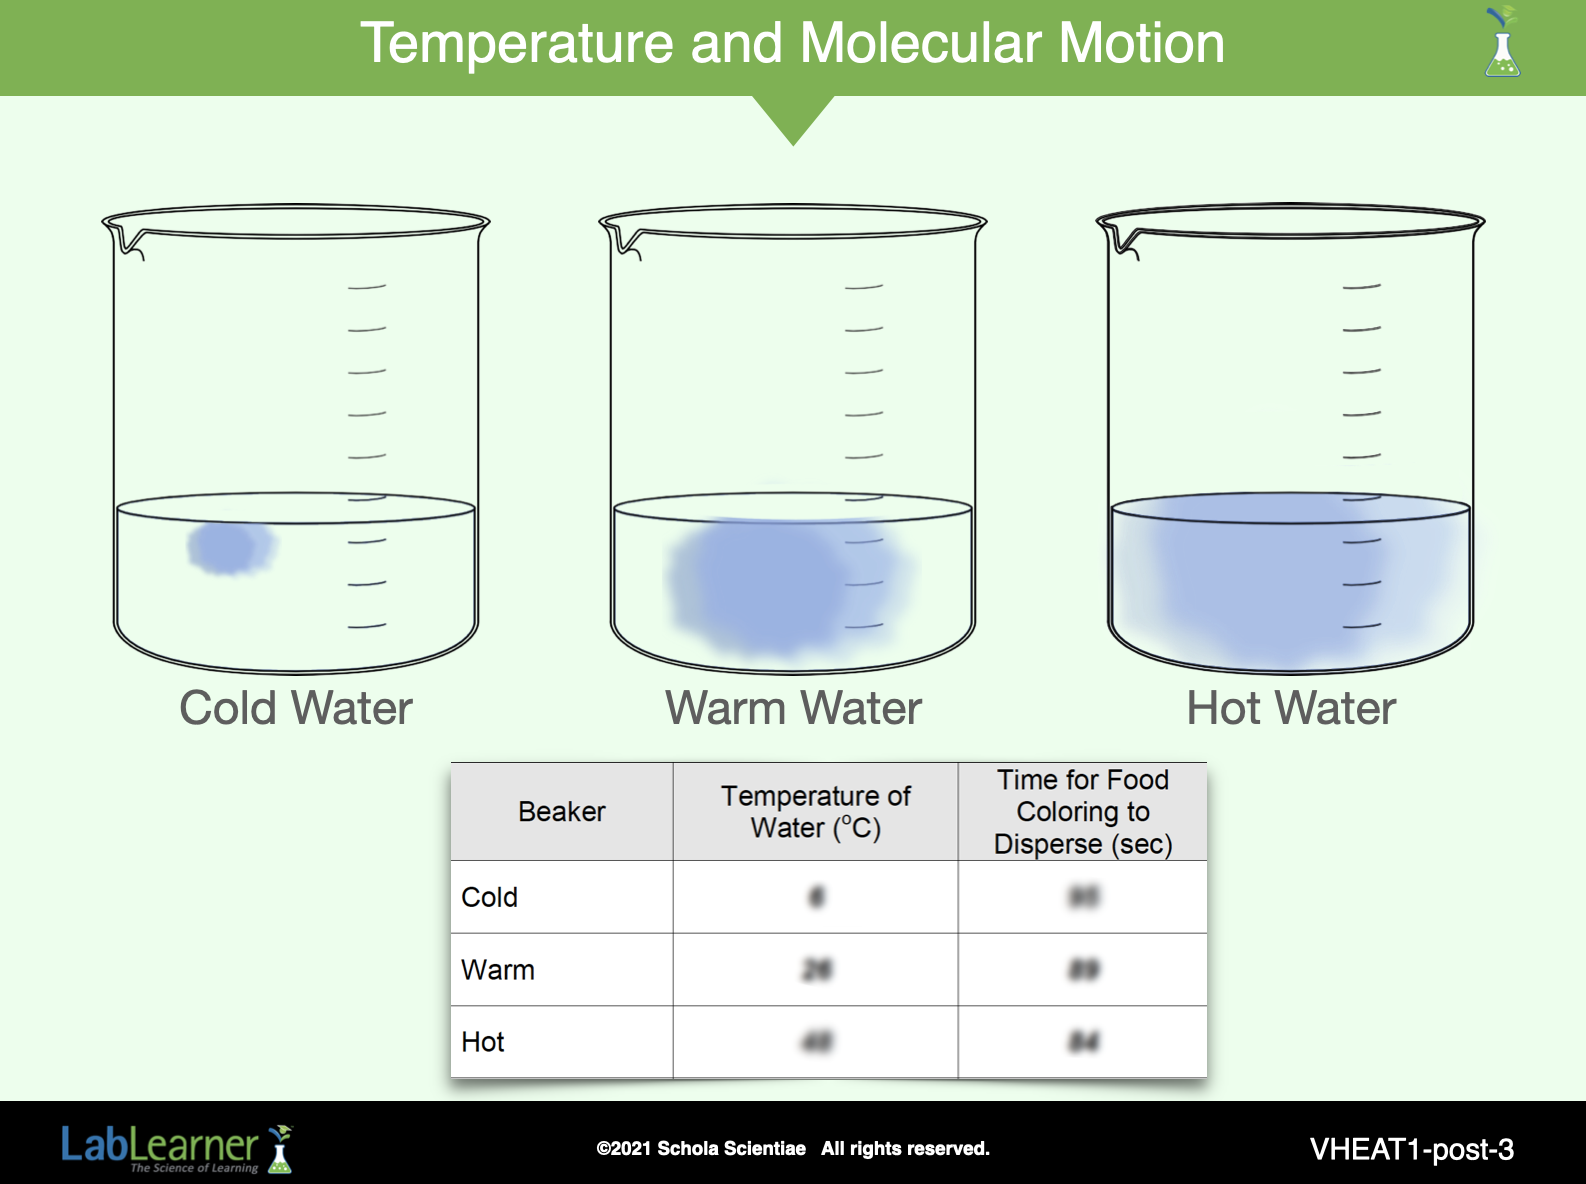
SLIDE VHEAT1-post-3
C. Ask students: How could you organize your data from your experiments so that you can draw conclusions about the relationship of kinetic energy and temperature? Student answers may vary. Students should indicate that a data table is an appropriate method of organizing data for analysis.
1. Direct students to rejoin their cooperative groups from the Lab.
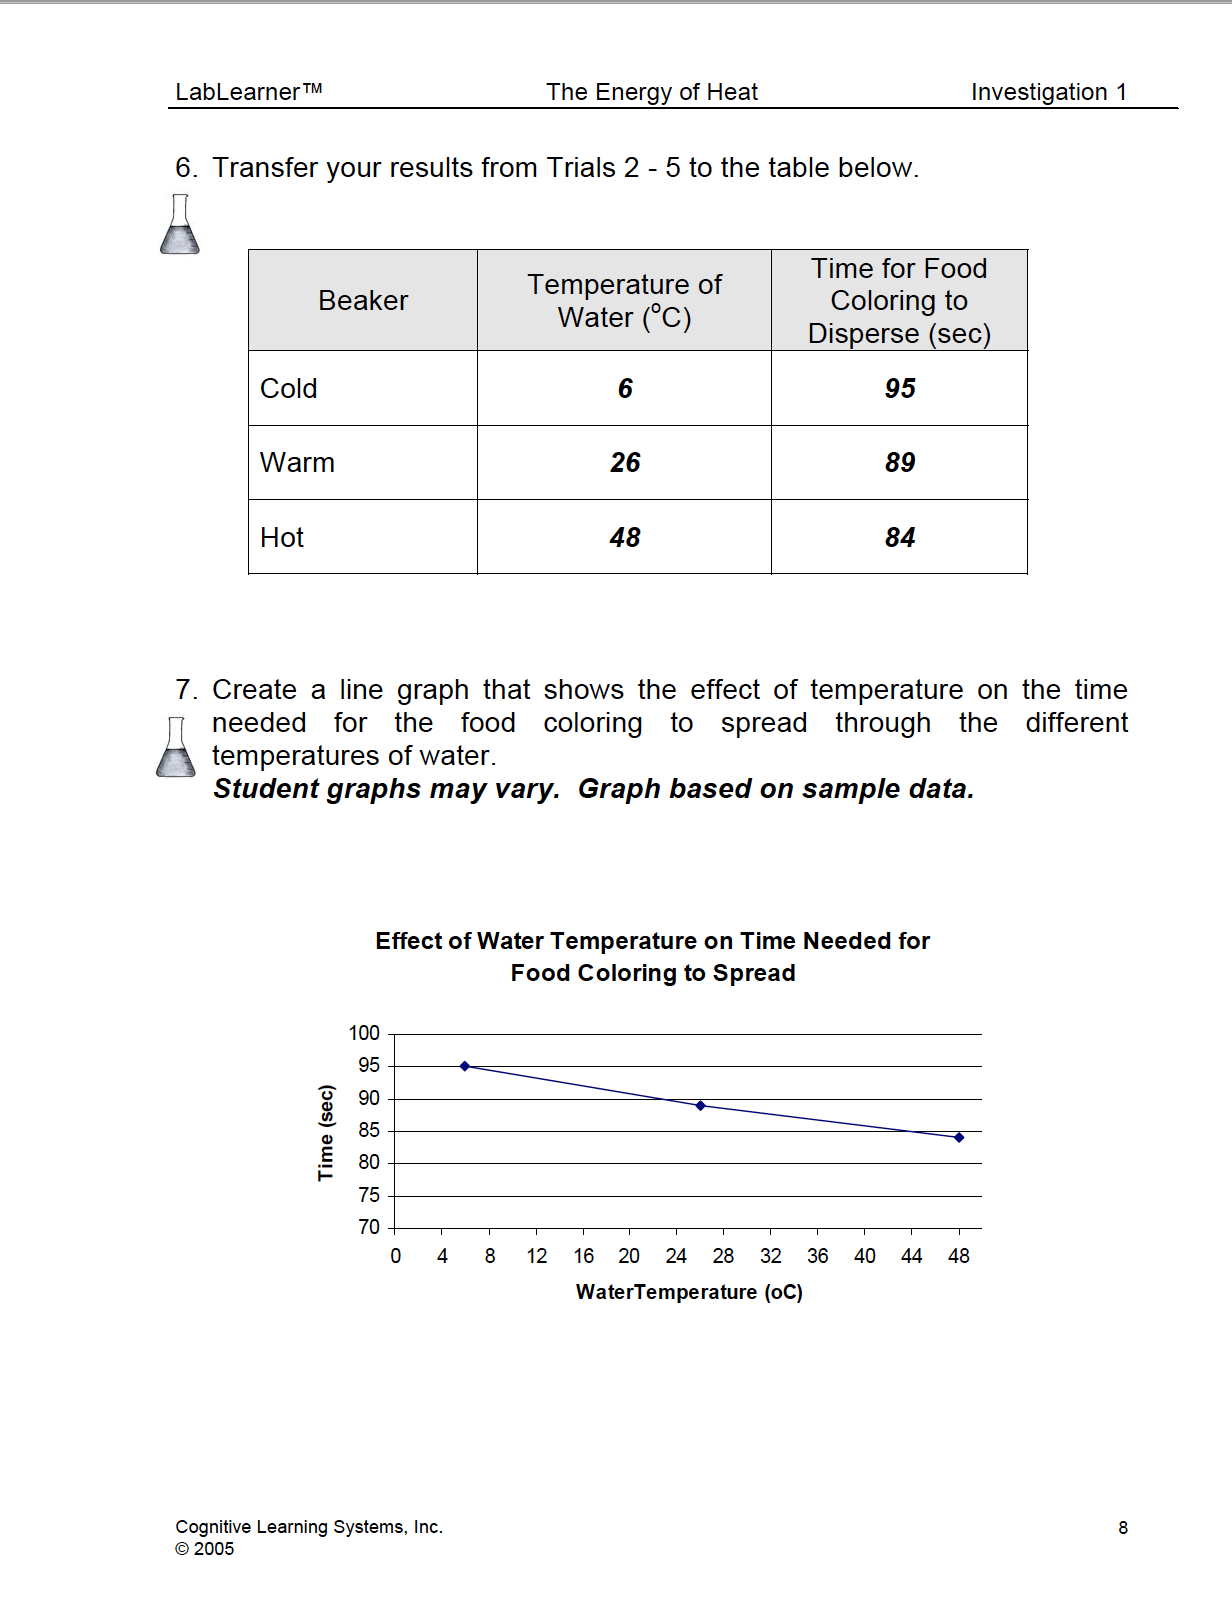
2. Direct students to turn to Problem 5 in their Student Data Record. Direct students to transfer the data from Trials 2 – 5 to the data table.
3. Direct students to study their data tables.
4. Ask students: Do you notice any patterns in your data? How would you explain the pattern? Students should observe that as temperature increased, the time needed for color to disperse decreased. The increase in water temperature increased the kinetic energy of the food coloring and water molecules, causing them to move more quickly and to spread through the beaker more rapidly.
5. Ask students: How would you state your observations in terms of kinetic energy? An increase in temperature is an indication of an increase in the kinetic energy of molecules.
6. Provide an opportunity for students to rehearse the information they recently learned by encouraging them to consider how they could change the role-play activity on the kinetic energy of molecules from the Pre-Lab to demonstrate the results from Lab.
Ask students: How could you change the kinetic energy demonstration from Pre-Lab to illustrate your results from Trials 3 – 5 in the Lab? Student answers will vary. An example of a role-play may include students dividing into three equal groups, each representing one of the beakers. Students may choose to act as food coloring molecules, entering the area of the classroom serving as the beaker and moving at a slow (cold), medium (warm) or fast (hot) pace as they spread out in the space. Students may also wish to set time limits for each group of molecules to move to mimic the time needed for food coloring to disperse in each beaker of water. Although student creativity and variation should be encouraged, students’ ideas should also reflect an accurate understanding of the relationship between kinetic energy and temperature: as temperature increases, the kinetic energy of molecules increases, and molecules move faster and over greater distances.
7. Encourage students to demonstrate their role-play.
______________________________________________
SLIDE VHEAT1-post-4
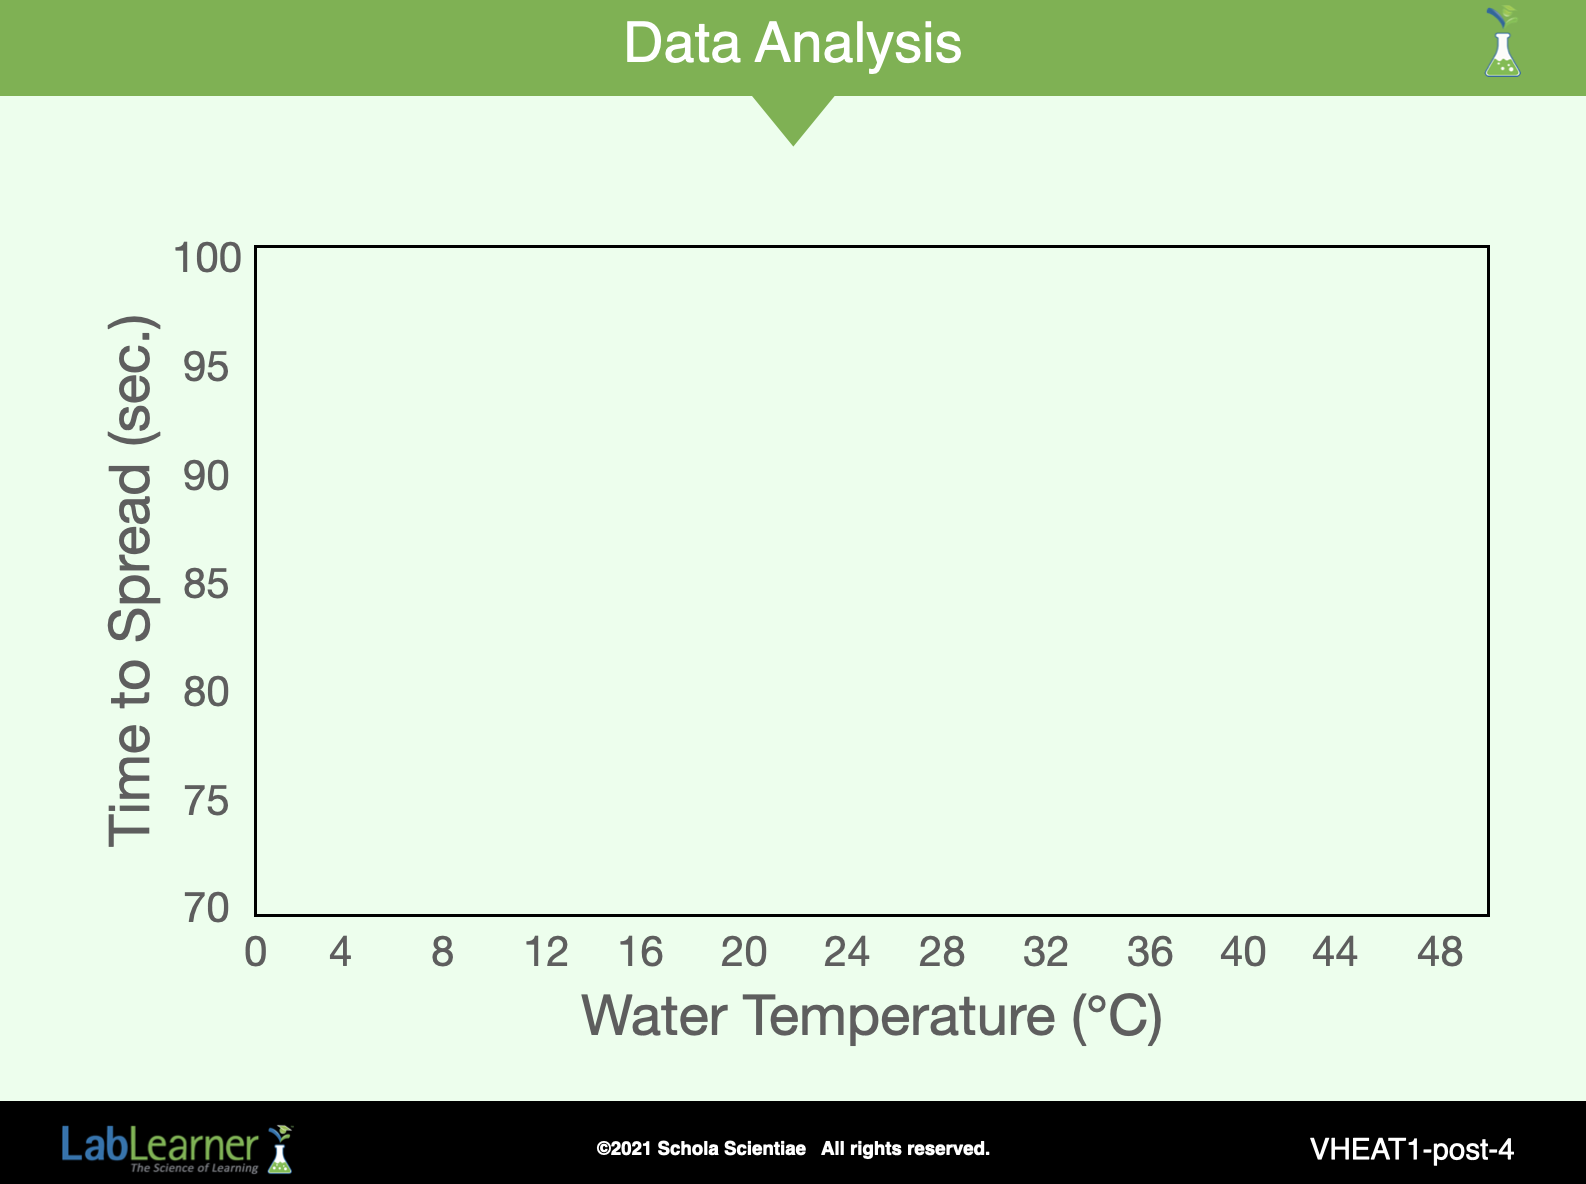
D. Ask students: Is there another way besides a Data Table and your role-play to illustrate the relationship between kinetic energy and temperature? Student answers may vary. Students may suggest a bar graph as a method of illustrating data. Other students may suggest a line graph. A line graph would be a more appropriate method. A bar graph would show the time for food coloring dispersal at only the three distinct time points measured in the Lab. However, by creating a line graph, students would be more clearly able to see the continuous relationship between kinetic energy and temperature rather that only the data of the three water temperatures.
1. Direct students to create and complete a line graph in Problem 7 of their Student Data Record. A sample graph has been provided in this slide. The following questions may be useful in assisting students to decide how to construct their graphs. Remind students that their Procedural Toolbox may be a good reference tool as they create their graphs.
a. Ask students: Which variable did you change during your experiments? Which axis does this go on? Students changed temperature during their experiments. Temperature should be placed on the x-axis.
b. Ask students: What variable did you measure during your experiments? Students measured time during their experiments. Time should be placed on the y-axis.
c. Ask students: How should you label your x-axis? How should you label your y-axis? Axis labels should include the type of measurement and the units each axis represents.
d. Ask students: What scale should you use on each axis? Student scales may vary.
2. Provide 10 – 15 minutes for completion of the line graphs.
______________________________________________
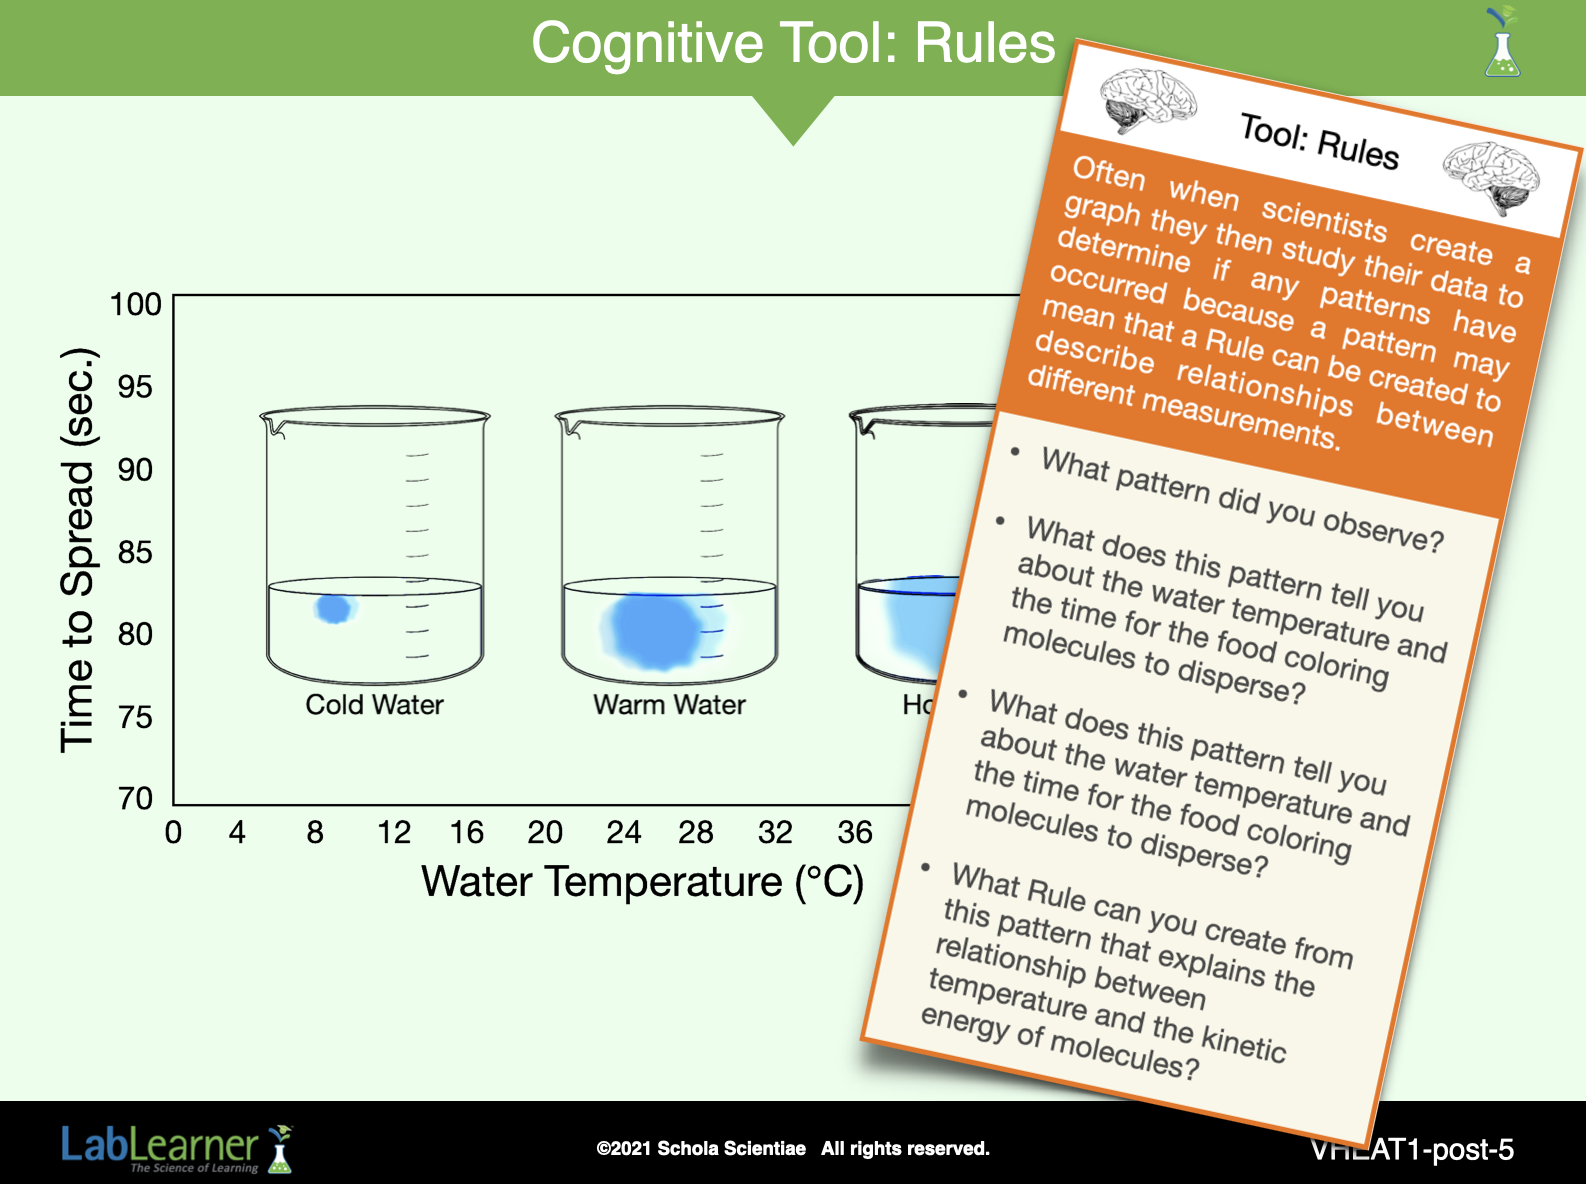
SLIDE VHEAT1-post-5
1. Encourage students to study their graphs for a pattern. Ask students: What pattern did you observe? The food coloring stopped moving faster in the warm and hot water beakers than in the cold water beaker, and the food coloring stopped moving in the hot water beaker faster than it stopped in the warm water beaker.
2. Ask students: What does this pattern tell you about the water temperature and the time for the food coloring molecules to disperse? Increasing water temperature decreased the time needed for the dispersal of the food coloring molecules.
3. Ask students: What does this pattern tell you about the water temperature and the kinetic energy of water molecules and food coloring molecules? Increasing water temperature increased the speed of the water and food coloring molecules.
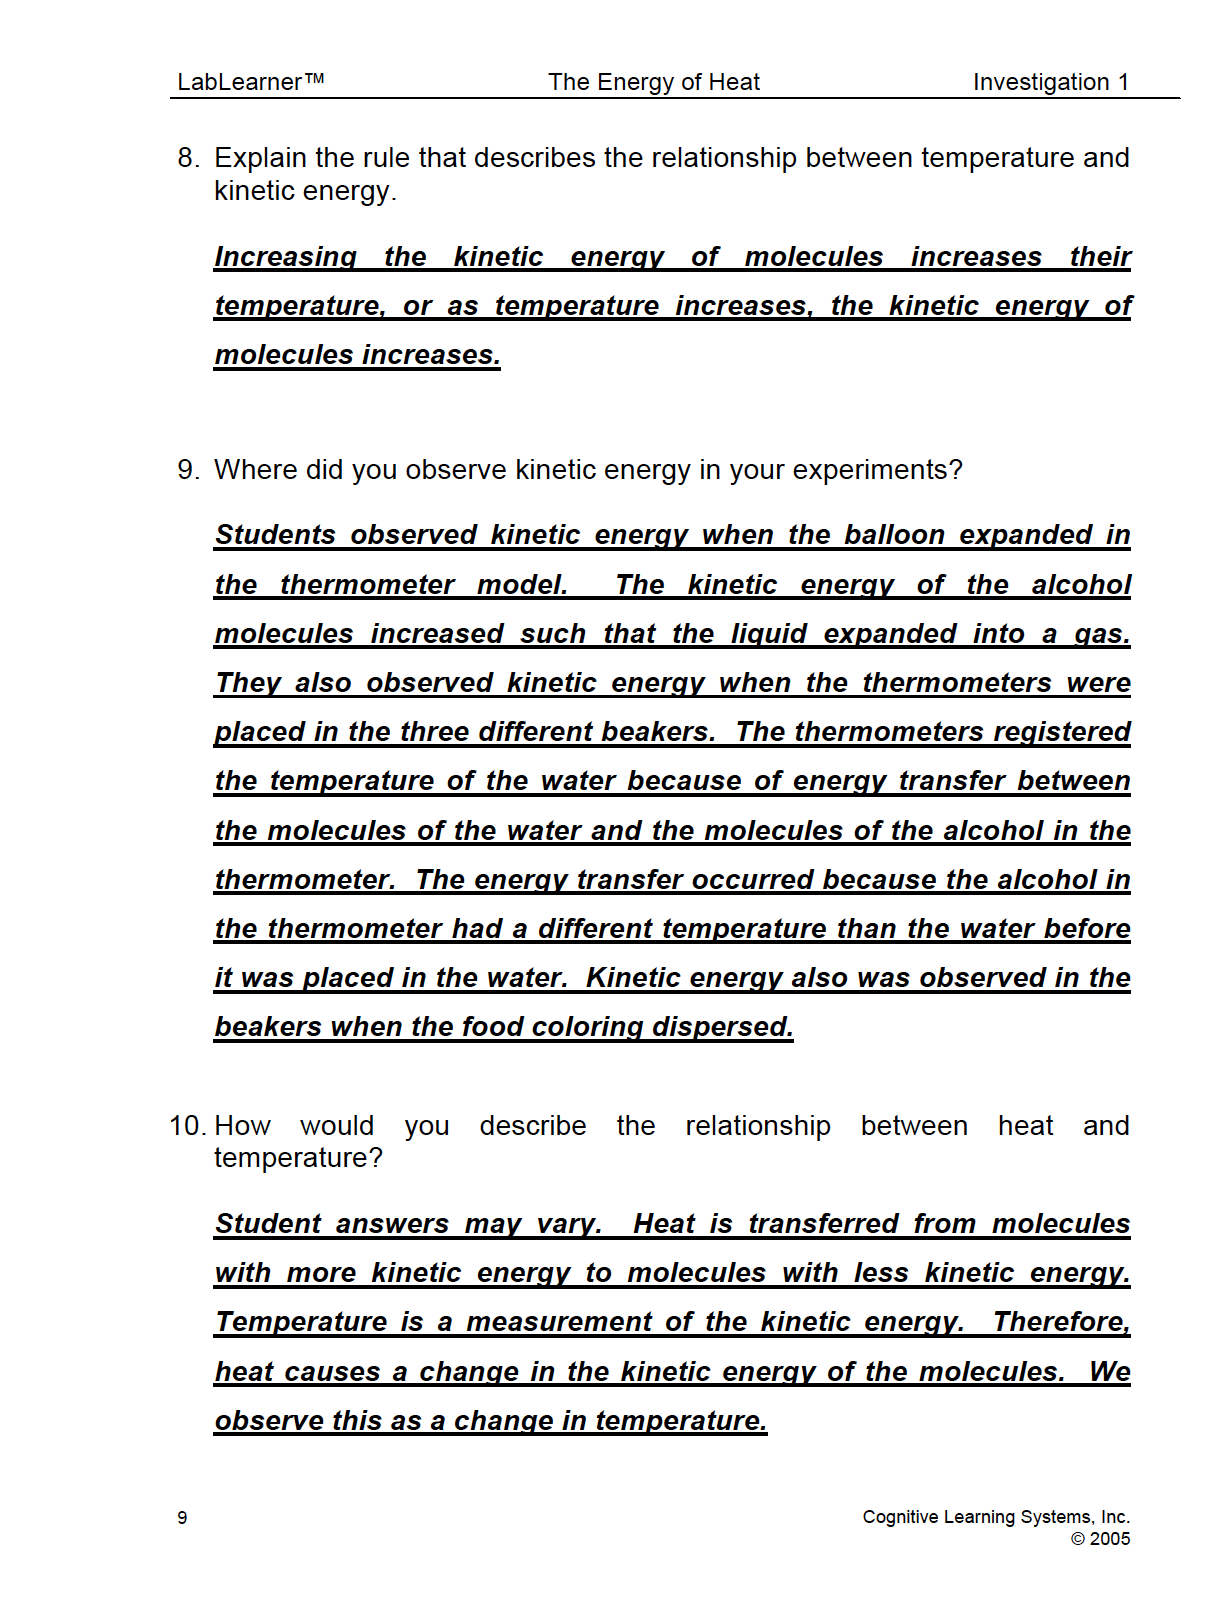
4. Ask students: What Rule can you create from this pattern that explains the relationship between temperature and the kinetic energy of molecules? Increasing the kinetic energy of molecules increases their temperature or as the temperature of a substance increases, the kinetic energy of the molecules increases.
5. Direct students to record their Rule in Problem 8 of their Student Data Record.
______________________________________________
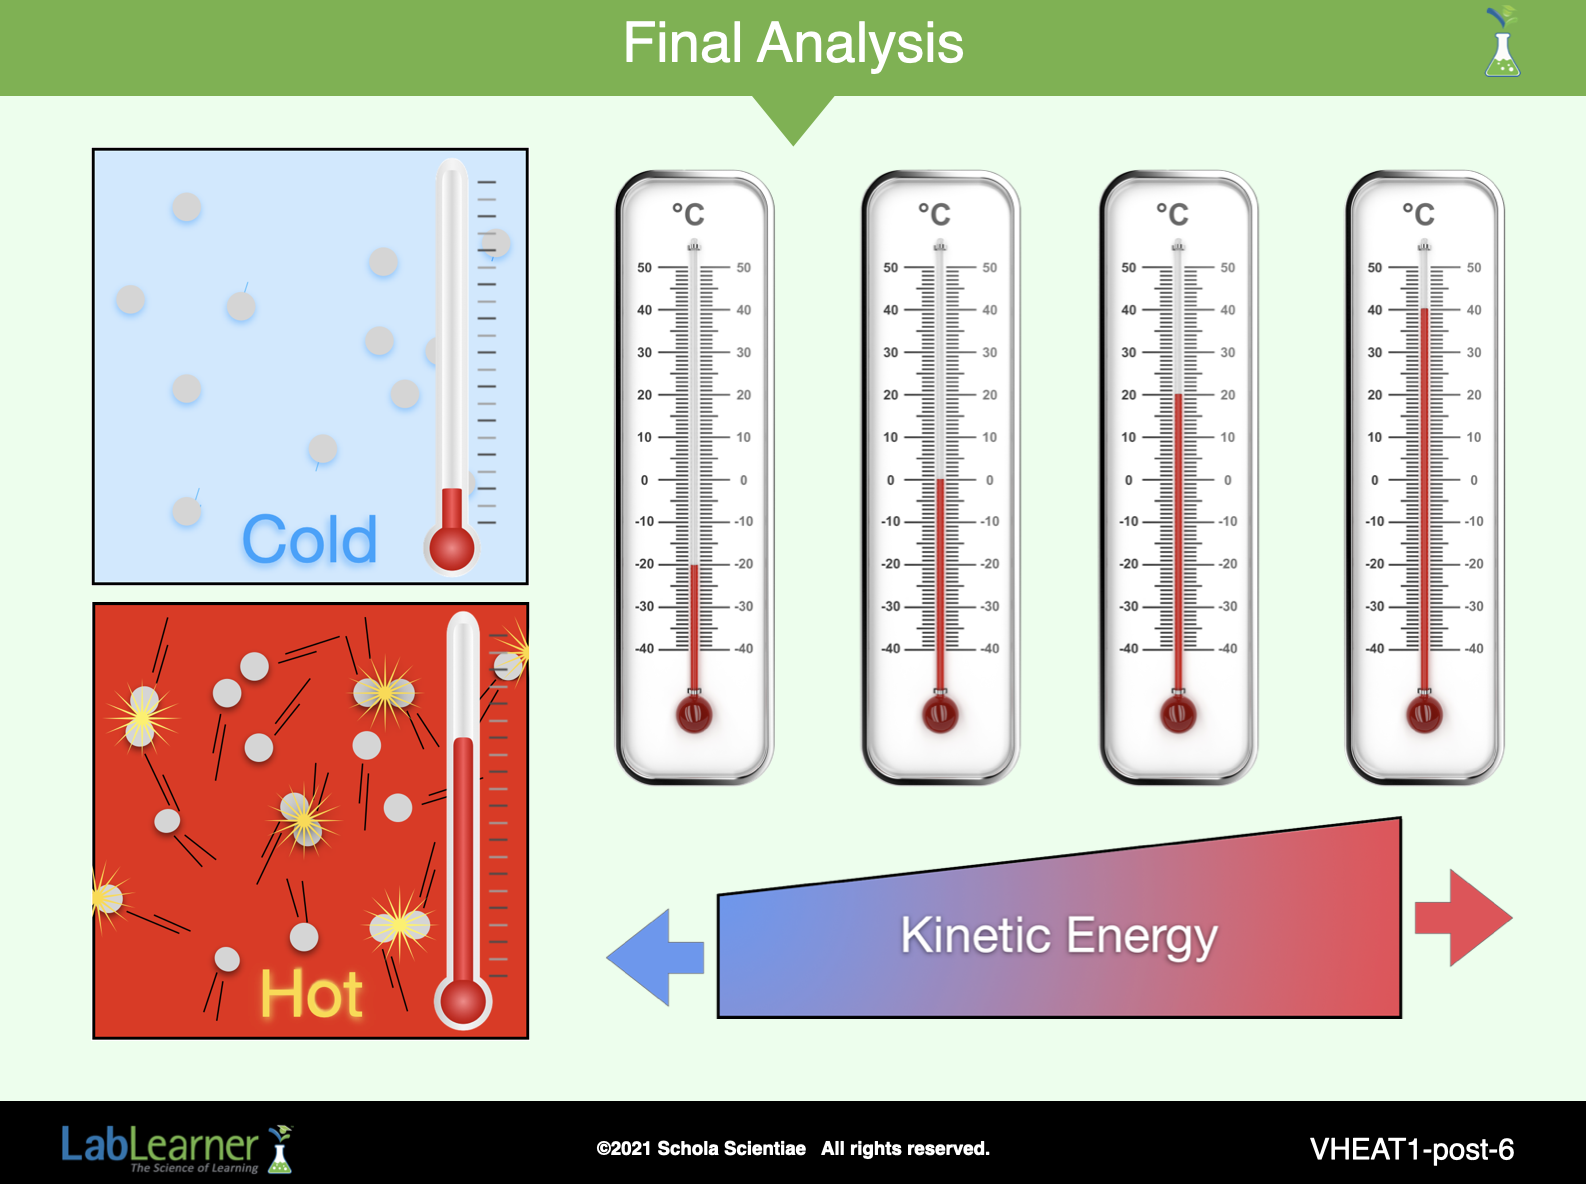
SLIDE VHEAT1-post-6
Conclude the analysis of the Investigation by explaining to students that now that they have a Rule about the relationship between temperature and kinetic energy of the movement of molecules, they can use it to relate temperature and kinetic energy to heat.
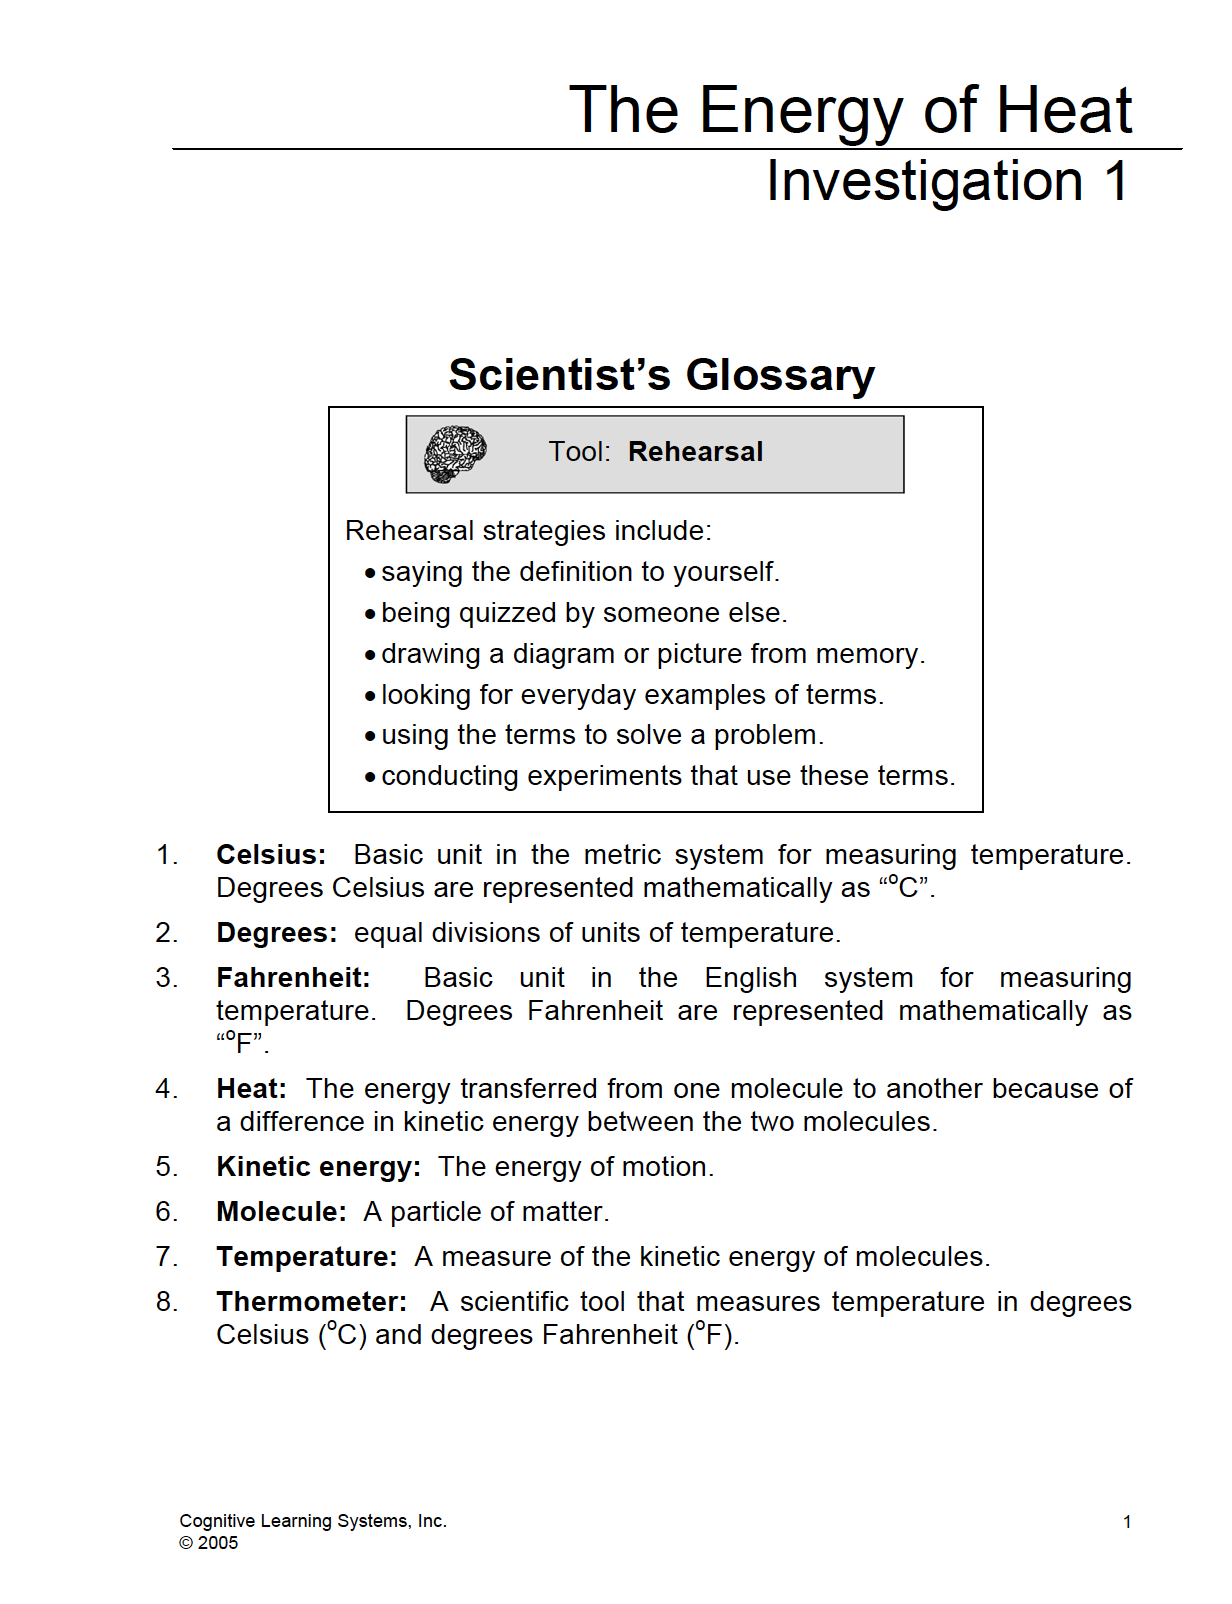
1. Ask students: What is heat? Student answers may vary. Heat is defined as the energy transferred from one molecule to another because of a difference in temperature or kinetic energy between the molecules.
a. Ask students: Where did you observe kinetic energy in your experiments? Students observed kinetic energy when the balloon expanded in the thermometer model. The kinetic energy of the alcohol molecules increases such that the liquid expanded into a gas. They also observed kinetic energy when the thermometers were placed in the three different beakers. The thermometers registered the temperature of the water because of energy transfer between the molecules of the water and the molecules of the alcohol in the thermometer. The energy transfer occurred because the alcohol in the thermometer had a different temperature than the water before it was placed in the water. Kinetic energy also was observed in the beakers when the food coloring dispersed.
b. Ask students: Why was the response of the thermometer to placement in hot or cold water an example of heat? In cold water, kinetic energy was transferred from the molecules of alcohol to the molecules of water, causing the molecules of alcohol to slow down and move shorter distances. This caused the alcohol in the thermometer to contract. In hot water, kinetic energy was transferred from the molecules of hot water to the molecules of alcohol, causing the molecules of alcohol to move faster and farther. This caused the alcohol to expand in the thermometer.
c. Direct students to answer Problem 9 in their Student Data Record.
2. Ask students: How would you describe the relationship between heat and temperature? Student answers may vary. Heat is transferred from molecules with more kinetic energy to molecules with less kinetic energy. Temperature is a measurement of the kinetic energy. Therefore, heat causes a change in the kinetic energy of the molecules. We observe this as a change in temperature.
3. Direct students to record their answer in Problem 10 of their Student Data Record.
KEYS: LAB/POSTLAB