Teacher Portal:
Watersheds
Investigation 1 – PostLab

ZERO-IN
The italicized font represents information to be shared orally or physically completed with the students at this time.
The non-italicized font represents additional information included supporting the teacher’s understanding of the content being introduced within the CELL.
ANALYZE IT
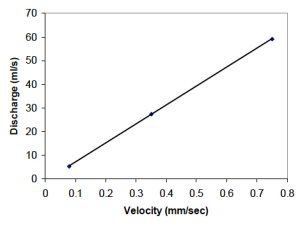
If necessary, help students complete their graphs using Table B:

Graph: Use Table B and the grid to make a graph that compares water velocity with discharge.
A. Label the x-axis with “Water Velocity” and the proper units.
B. Label the y-axis with “Discharge” and the proper units.
C. Determine how many tick marks you need for each axis, and label the tick marks.
D. Plot your data.
E. You may refer to the Drawing of a Best Fit Line procedure for help, if necessary.
F. Draw a graph and include a best fit line.
GET FOCUSED
Instruct students to complete the Focus Question in their SDRs then discuss it as a class. Use the suggested response below to guide students’ answers.
- How do the abiotic factors of water velocity and discharge affect a watershed? Water velocity is the distance water travels per time. Discharge is the volume of water that flows into an area per time. As water velocity increases, discharge increases. Increases in water velocity and discharge from headwaters of a watershed may lead to flooding downstream.