Teacher Portal
Friction
Deep Analysis
Deep Analysis
Friction

Deep Analysis
Use the questions below to go deeper into the scientific concepts and applications of each Investigation. Students also have a copy of every question, but do not have the answers.Use the questions below to go deeper into the scientific concepts and applications of each Investigation. Note that questions highlighted in orange text are also featured in Phase 3.1 (Conclusions) of the Student Guide PDF.
Investigation 1
Instruct students to analyze the activity in which they pulled the woodblock 1 m. Use the suggested responses below to guide students’ answers.
- What is the resistance to motion that you feel as you pull the block? The resistance is caused by the frictional force.
- What force keeps the block from slowing down? The force applied by pulling on the spring scale keeps the block from slowing down.
As a class, discuss acceleration. Use the suggested responses below to guide students’ answers.
- Between the two lines, did the block slow down, speed up, or change direction? No, the velocity of the block remained constant.
- Acceleration is a change in velocity. What was the acceleration of the block pulled between the two lines? The acceleration was zero, since the velocity of the block did not change.
- Can an object have an acceleration of 0 m/s2 while the object is moving? Yes. If the object is moving but not speeding up, slowing down, or changing direction, velocity remains constant. An object at constant velocity has no acceleration. If the object is not moving, its velocity also remains constant. An object at constant velocity also has no acceleration.
Instruct students to perform the following calculations.
- The block you pulled had an acceleration of 0 m/s2. Use the formula ΣF = ma to determine F. Remember than ΣF represents the sum of the forces, not just the force exerted to pull or just the force of friction on the block. The sum of the forces is zero because the acceleration of the block was zero. Instruct students to answer the question in their Investigation One Data Record.
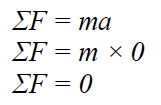
Tell students that the two large forces acting on the woodblock as it was pulled were the force of friction and the force applied to pull it. Therefore, the sum of the forces was equal to the force of friction plus the applied force.
Emphasize that by understanding this formula, students should begin to comprehend that the force they measured with the spring scale was a measure of the force of friction.
![]()
- Using this formula, calculate the frictional force between the block and the table. By using the spring scale, students measured the force applied to pull the block. From previous calculations of acceleration, we know that the acceleration was zero and the sum of the force was equal to 0. Therefore:
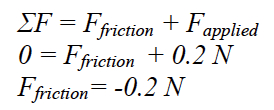
Note: Students may be confused by the “negative” force. Remind students that the negative number indicates the direction of the force of friction. The applied force was a positive number. Since force takes into account magnitude and direction, the frictional force was a force of the same magnitude in the opposite direction of the applied force.
Discuss the energy transfer which occurred between the woodblock and the table. Use the suggested responses below to guide students’ answers.
- What type of energy was present as the woodblock was moved across the table? Kinetic energy was present.
- As the block slowed, what happened to the kinetic energy? Kinetic energy decreased.
- The Law of Conservation of Matter and Energy states that energy and matter are never produced nor destroyed. According to this principle, what happened to the kinetic energy of the block? The kinetic energy of the block must have been transferred to another type of energy. As the woodblock was resting on the table and had no height, it had no potential energy. The kinetic energy of the woodblock had to be transformed into a type of energy other than potential. This type of energy was heat energy, which resulted from the force of friction between the wood and the table.
Note: If students have a difficult time understanding this transformation from kinetic to heat energy, instruct them to rub their hands together vigorously.
- What form of energy do your hands have? Students’ hands have kinetic energy.
- While rubbing your hands, how do they begin to feel? Students will feel warmth in their hands.
- Into what type of energy was kinetic energy transformed? As the woodblock was pulled along the table, kinetic energy was transformed into heat energy.
- Ask students what factors they think influence the frictional force. Student answers will vary but may include velocity, surface area, smoothness of surfaces, and the weight of the object. Instruct students to record their ideas in their Investigation One Data Record. Tell students that in the next three Investigations, students will investigate these variables.
Ask students to generate hypothetical experiments to test their ideas about influencing factors of frictional force between two surfaces.
Tell students to record their experiments in their Investigation 1 Student Data Record.
Investigation 2
Instruct students to complete the Analysis Questions in their SDRs then discuss them as a class. Use the suggested responses below to guide students’ answers.
Note: Students should refer to their data recorded in Table A to answer the following questions.
- Of all of the data recorded during the experiment, only two measurements varied greatly from trial to trial. Which two measurements varied? Time and velocity varied greatly. Students may notice a small change in force, but such changes should be so minute that they are inconsequential.
- What is the relationship between velocity and frictional force? Student answers will vary. Students may be able to look at the data on the chart and draw the conclusion that frictional force does not vary based on velocity. The following graphing activity will help students see this relationship.
Tell students that one way of observing relationships between variables is to graph the data. Students should use the following steps to graph the relationship between frictional force and velocity.
- Students should draw an x- and y-axis to set up their graph in their Investigation 2 Student Data Record.
- Students should determine how to label the x- and y-axis. Refer to the Determining How to Label the X-Axis and Y-Axis card in the Procedural Toolbox if necessary. Velocity, the independent variable, should be placed on the x-axis, and frictional force, the dependent variable, should be placed on the y-axis.
- Students should look at their values recorded in the table. Students should determine the range of numbers that should be included on each axis based on the range of their data. For example, if their values for velocity vary from 120 m/s to 240 m/s, students may wish to provide a range from 100 m/s to 250 m/s on their graph.
- After students have placed the appropriate numbers along each axis, students should plot their data.
- Once students have plotted the data, they should draw the best-fit line through the points on their graph. The best-fit line may not exactly connect each point. Rather, the best-fit line is a straight line that goes through the midpoint between all of the points.
Ask the following questions concerning the graph. Use the suggested responses below to guide students’ answers.
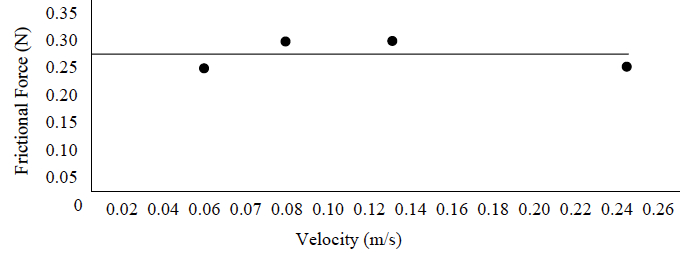
- Does the frictional force increase or decrease based on velocity? No, the frictional force remained constant regardless of velocity.
- What is the relationship between the frictional force and velocity? The frictional force is not dependent on velocity. Instruct students to record their answers in their Investigation 2 Student Data Record.
- According to your graph, what would be the applied force if the velocity was 0.05 m/s? According to the graph, the frictional force would be approximately 0.275 N. We know that the frictional force is independent to velocity and equal in magnitude to the applied force when an object is pulled at a constant velocity; therefore, the applied force would be approximately 0.275 N for the velocity of 0.05 m/s just as it was for al other velocities tested in the experiment. Instruct students to answer the question in their Investigation 2 Student Data Record.
Investigation 3
Instruct students to refer to the two graphs they created to illustrate the effect of weight on frictional force and the effect of surface area on the frictional force.
Direct students attention to the relationships illustrated with these two graphs. If necessary, ask students the following questions to focus their attention. Use the suggested responses below to guide students’ answers.
- What is the relationship between weight and frictional force? As the weight of the woodblock increased, the frictional force between the woodblock and the table increased.
- What is the relationship between surface area and frictional force? Varying the surface area of the woodblock in contact with the table did not affect the frictional force between the woodblock and the table.
Note: Students have an additional prompt in their Data Record that suggests they might benefit from using the “What’s New?” Thinking Tool. Allow students to reflect on their precious understanding regarding friction, particularly if you determined that students initially had misconceptions or if you observed students reacting with surprise to their results.
Encourage students to apply these conclusions to real-life situations. Read each of the following scenarios to the class and encourage the application of their experimental results.
- Draw the following diagram on the board before reading the scenario.
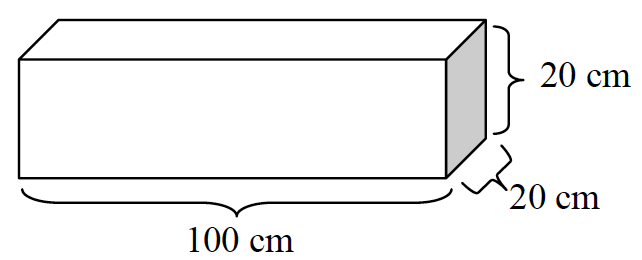
- Imagine that you must move a box full of books to the next room. The dimensions of the box are 100 cm by 20 cm by 20 cm. The box is too difficult to carry and must be pushed along the floor. How could you make pushing the box easier? Student suggestions may vary. Students should know from their experiments that surface area does not affect frictional force, so flipping the box on its smaller end will reduce its surface area but not reduce frictional force resisting movement. Students should also know from their experiments that weight does affect frictional force. Therefore, students could remove some books from the box, effectively reducing its weight, before pushing the box to the next room. In this way, students will have made pushing the box easier.
- Your older brother has just gotten his driver’s license, and he is eager to drive his small two-door car. However, it is mid-winter, and the roads are often covered with snow and ice. Your parents want your brother to be safe when he drives. What can your parents do to keep your brother’s car from sliding on the slick roads? Student suggestions may vary. In the scenario, the brother’s car is small and likely lightweight. The parents in the scenario may wish to place some heavy bags of gravel, bags of kitten litter, or other heavy objects in the trunk to increase frictional force between the car and the road. This increase in frictional force may keep the brother’s car from slipping on the wet and icy roads.
Investigation 4
After students have investigated at least two ways of altering the surfaces of the woodblock or the table, review their conclusions as a class. Use the suggested responses below to guide students’ answers.
- Does the smoothness of the two surfaces in contact affect the frictional force between the surfaces? Yes.
- What is the relationship between the smoothness of the surface and frictional force? The more smooth the two surfaces, the less frictional force.
- Why is this information valuable? What are some real-life situations in which this knowledge may be helpful? In life, we encounter situations in which friction is helpful and situations in which it is a hindrance. Take, for instance, a snowy and icy road. The smooth surface of the ice makes driving dangerous. The frictional force between the ice and the tires of a car is very low. However, if gravel is spread on top of the ice, the frictional force between the road and the tires of a car becomes greater. In this instance, a high frictional force is extremely helpful.
Tell students that the coefficient of friction describes the degree of mechanical and molecular interaction between two surfaces.
- The coefficient of friction varies between 0 and 1 and has no units.
- Given a constant normal reaction force (described later), a greater coefficient of friction indicates that two surfaces in contact have greater resistance to sliding than a lower coefficient of friction.
- For example, soccer cleats on grass have a greater coefficient of friction than skates on ice.
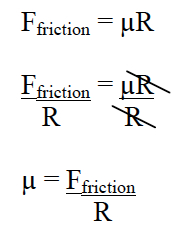
Instruct students to refer to the equation listed in the Background box in the Investigation 4 Student Data Record, Ffriction = μR. Tell students that the equation indicates what factors affect frictional force.
Tell students that the letter R represents a quantity called normal reaction force.
- When pulling an object across the table, the normal reaction force is essentially the force of gravity on that object.
- In other words, for students’ experiments, R represents the object’s weight.
Explain to students that μ (the Greek letter mu) represents the coefficient of friction.
Tell students that using the formula Ffriction = μR, they can calculate the coefficient of friction for each of the surface combinations tested.
- If students are not proficient in manipulating equations, write the following on the board to aid them in solving for μ.
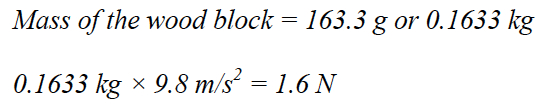
- Tell students that they must first know the weight of the woodblock.
Note: Students must convert the mass in grams to the mass in kilograms. Then, students must multiply the mass by the acceleration due to gravity, or 9.8 m/s2. Students have been provided room for their calculations in their Investigation Four Data Record.
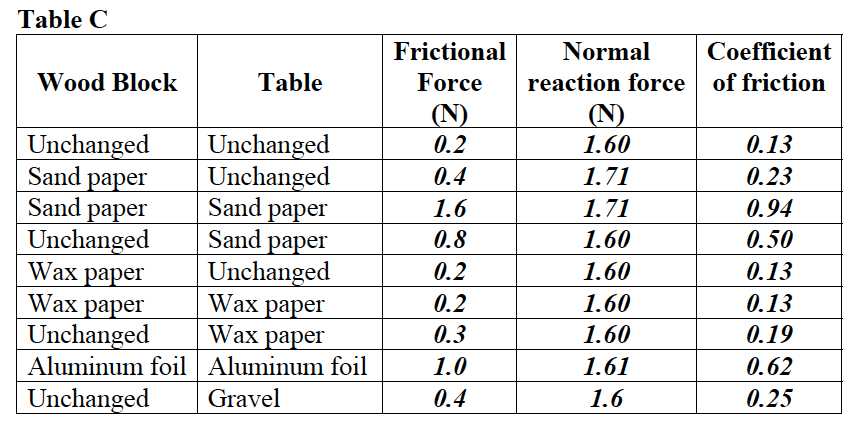
Tell students to find the coefficient of friction for each of the three surface combinations tested. Remind students that R is the weight of the woodblock.
Instruct students to record their calculations in Table C of their Investigation 4 Student Data Record.
Analyze the relationship between the coefficient of friction and frictional force. To do this, graph the data.
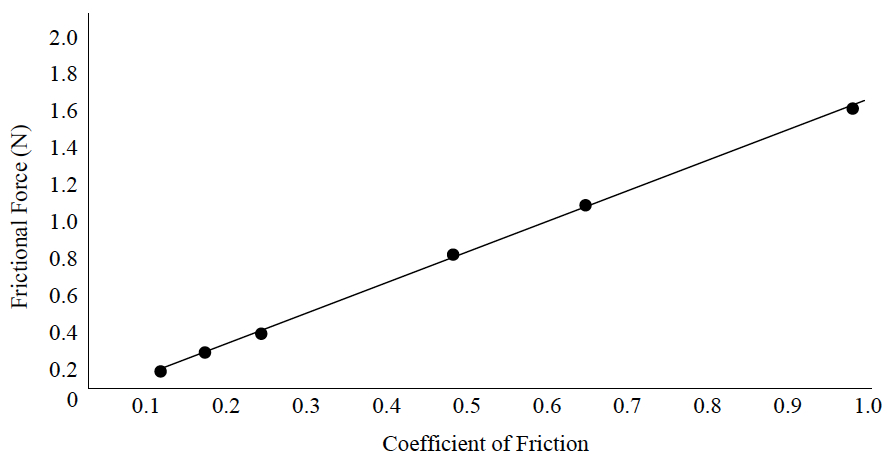
- Based on your graph, what is the relationship between the coefficient of friction and frictional force? As the coefficient of friction between two surfaces increased, the frictional force between the object and the surface it moves over increased. Instruct students to answer the question in their Investigation 3 Student Data Record.
- Can you list two situations where it is advantageous to have a high frictional force or coefficient of friction? Hint: Use a Mind Movie to generate some really exciting examples! Use your imagination to analyze the two surfaces that are in contact with one another, and how you could change the force of friction by varying the variables you investigated in this Core Experience Learning Lab. When riding a bike on an icy road, a person may ride more safely with a high frictional force between tires and the ice. A high frictional force may keep a person from sliding. A high frictional force could be generated by altering the type of surface in contact with the ice. Chains placed on the tires would increase the coefficient of friction and increase the frictional force. A rock climber wishes for a high frictional force between his or her shoes and the rocks. This friction allows the climber to safety climb without slipping. The shoes a rock climber uses have surfaces with a higher coefficient of friction than regular shoes or sneakers.
- Can you list two situations where is it advantageous to have a low frictional force or the coefficient of friction? An ice skater benefits from low frictional force between his or her skates and the ice rink. This low frictional force allows the skater to move smoothly. When opening a drawer in a filing cabinet, a person’s job is made easier by a low frictional force. If little friction acts between the drawer and the cabinet, a person is able to open the drawer with little exertion.
Comprehension Check
The Comprehension Check is designed to summarize the CELL and provide the teacher with an informal way to assess students’ understanding of the big ideas.
If time permits, ask your students to answer each question below. Use the suggested responses below to guide students’ answers.
- What is the relationship between speed, velocity, and acceleration? Throughout this CELL, students had the opportunity to use the terms speed, velocity, and acceleration. Through their experiments, students should have come to assign each term a distinctly different definition. Speed is a term used to indicate how much distance is traveled in a given time. Velocity is a measure of the magnitude of distance per time as well as the direction of the motion. Therefore, a change in velocity occurs when an object in motion either changes speed or changes direction. Acceleration denotes a change in velocity in a period of time. Positive acceleration represents an increase in velocity away from the origin, whereas negative acceleration represents a decrease in velocity while moving away from the origin.
- How does force change motion? This CELL allowed students to concentrate on the effect of frictional force and applied force on motion. Students found that frictional force between two surfaces opposed applied force acting on one of those surfaces. When trying to move a woodblock across a table, students applied a force to the block. The force which resisted motion was frictional force. The greater frictional force, the greater resistance to motion. Students also found that certain factors affect the frictional force and others do not. Through experimentation, students found that weight and surface type affect the force of friction between two objects. The velocity of the object and the total surface area of the two objects in contact with one another, however, did not affect the force of friction, because forces affect motion, we can better understand how objects will move if we understand the factors that affect a certain force. For example, from our CELL, we know that if we want to slow an object’s motion, we increase friction. To do this, we could increase the coefficient of friction or increase its weight, but increasing its surface area or its velocity would not alter the frictional force. Objects in motion stay in motion unless acted on by an external force, and objects at rest remain at rest unless acted upon by an external force. In our experiments, the woodblock remained at rest until students applied a force which moved the object. Both the woodblocks and the pennies remained in motion until friction applied a force in the opposite direction of their movement, which caused the woodblock and the pennies to stop. Students also found that objects can be in motion even though the sum of the forces is equal to 0 N. This occurs when objects are moving at a constant velocity. Students observed this each time we applied force to move wood blocks at a constant velocity during our trials.
- How does a change in motion affect potential and kinetic energy? An object at rest on the top of a ramp has potential energy. This potential energy is converted to kinetic energy as the object moves down the ramp. At the bottom of the ramp, the object slows to a stop. The kinetic energy of the block must have been transferred to another type of energy. As the woodblock was resting on the table and had no height, it had no potential energy. The kinetic energy of the woodblock had to be transformed into a type of energy other than potential. This type of energy was heat energy, which resulted from the force of friction between the wood and the table.
- Based on your experiments, how does force affect motion? Objects in motion stay in motion unless acted on by an external force, and objects at rest remain at rest unless acted upon by an external force. In our experiments, the woodblock remained at rest until students applied a force which moved the object. Both the woodblocks and the pennies remained in motion until friction applied a force in the opposite direction of their movement, which caused the woodblock and the pennies to stop. Students also found that objects can be in motion even though the sum of the forces is equal to 0 N. This occurs when objects are moving at a constant velocity. Students observed this each time we applied force to move wood blocks at a constant velocity during our trials.
- Why is it important to understand the variables that affect friction? How do these help you better understand the motion of objects? By understanding variables that affect the magnitude of the force of friction, we better understand how frictional force affects motion. For example, changing the surface area of an object (assuming the type of surface is similar) will not affect the frictional force and therefore will not change an object’s motion. However, changing the mass of an object or its surface will affect the frictional force and therefore affect its motion.