Teacher Portal
Kinetic and Potential Energy
Deep Analysis
Deep Analysis
Kinetic and Potential Energy

Deep Analysis
Use the questions below to go deeper into the scientific concepts and applications of each Investigation. Note that questions highlighted in orange text are also featured in Phase 3.1 (Conclusions) of the Student Guide PDF.
Investigation 1
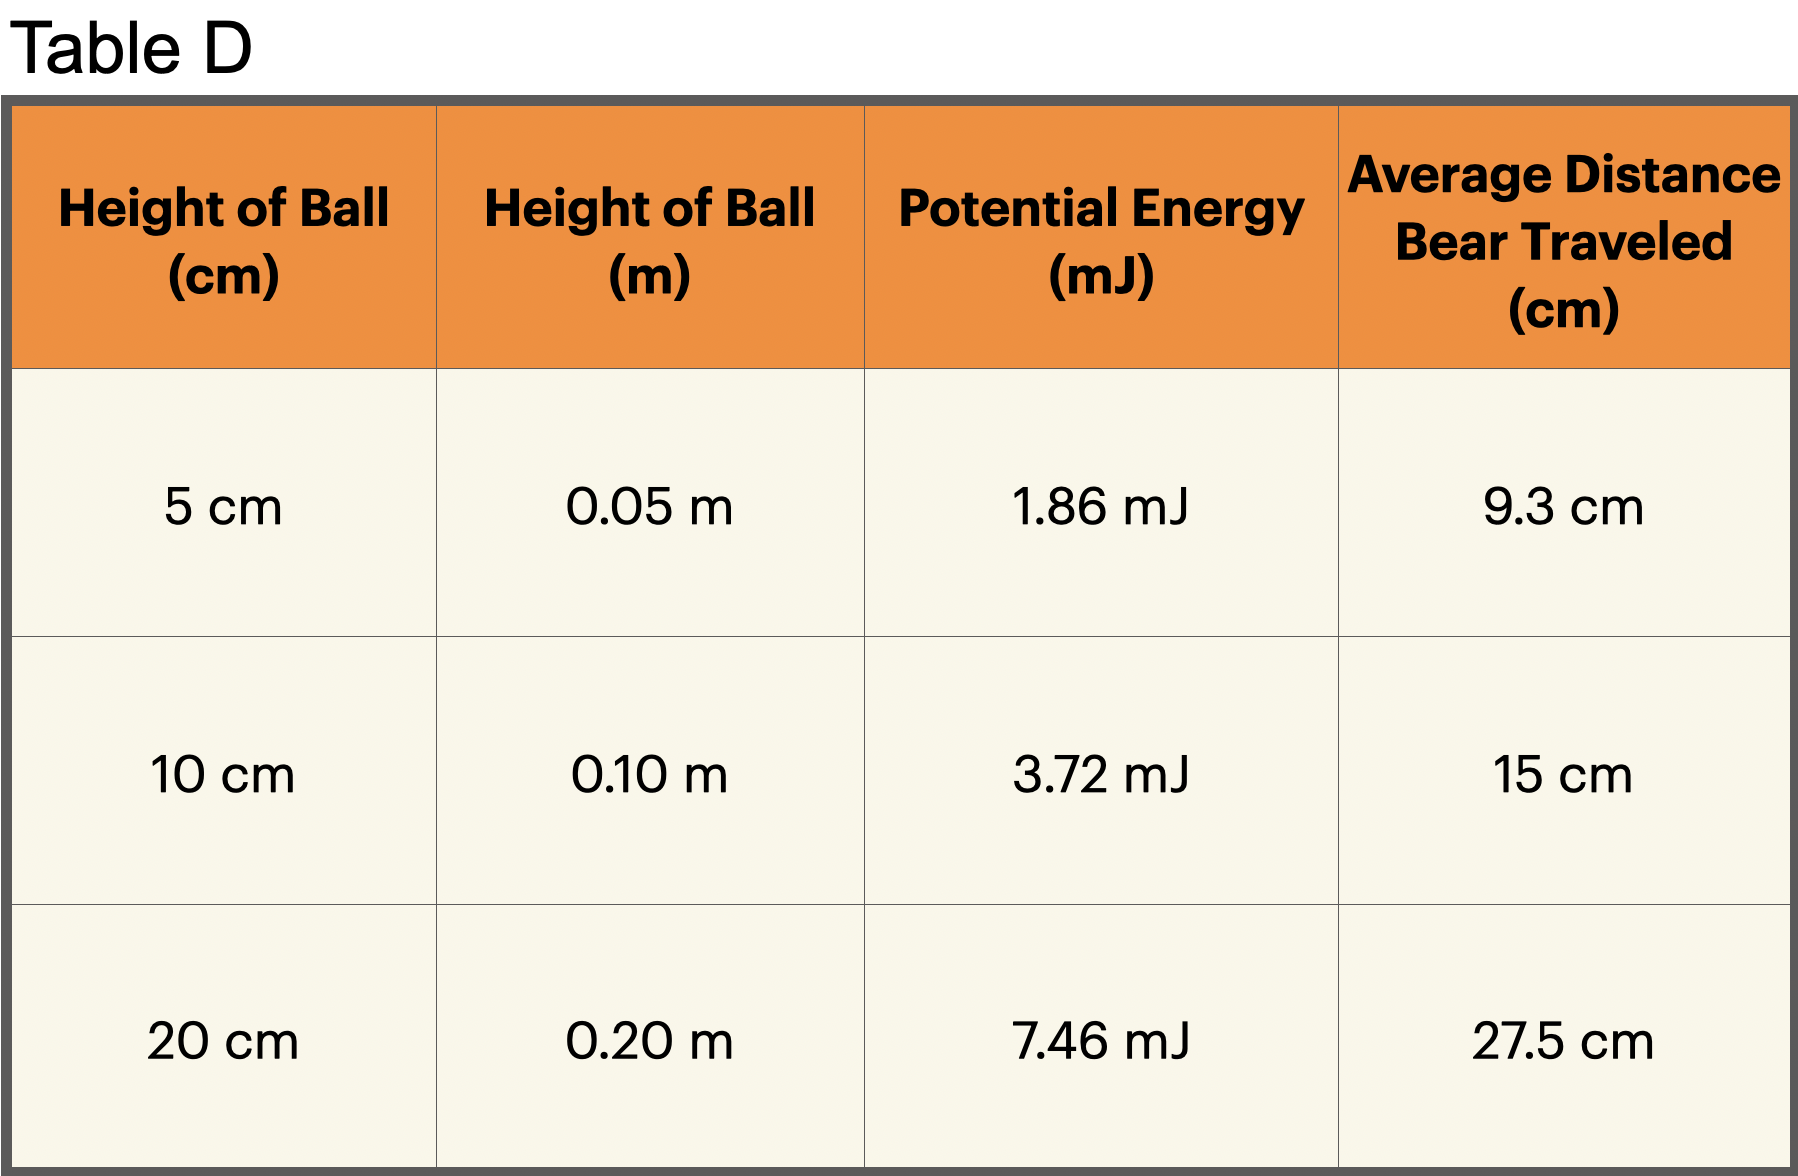
- Look at the data in Table D. The independent variable is the item that is changed in the experiment. What is the independent variable in the experiment? The independent variable is the height of the ball.
- Look at the data in Table D. How did potential energy change with height? The potential energy increased as the height of the ball above the table increased.
- Look at the data in Table D. The dependent variable is the item that is being measured in the experiment. What is the dependent variable in the experiment? The dependent variable is the distance the average distance the bear traveled.
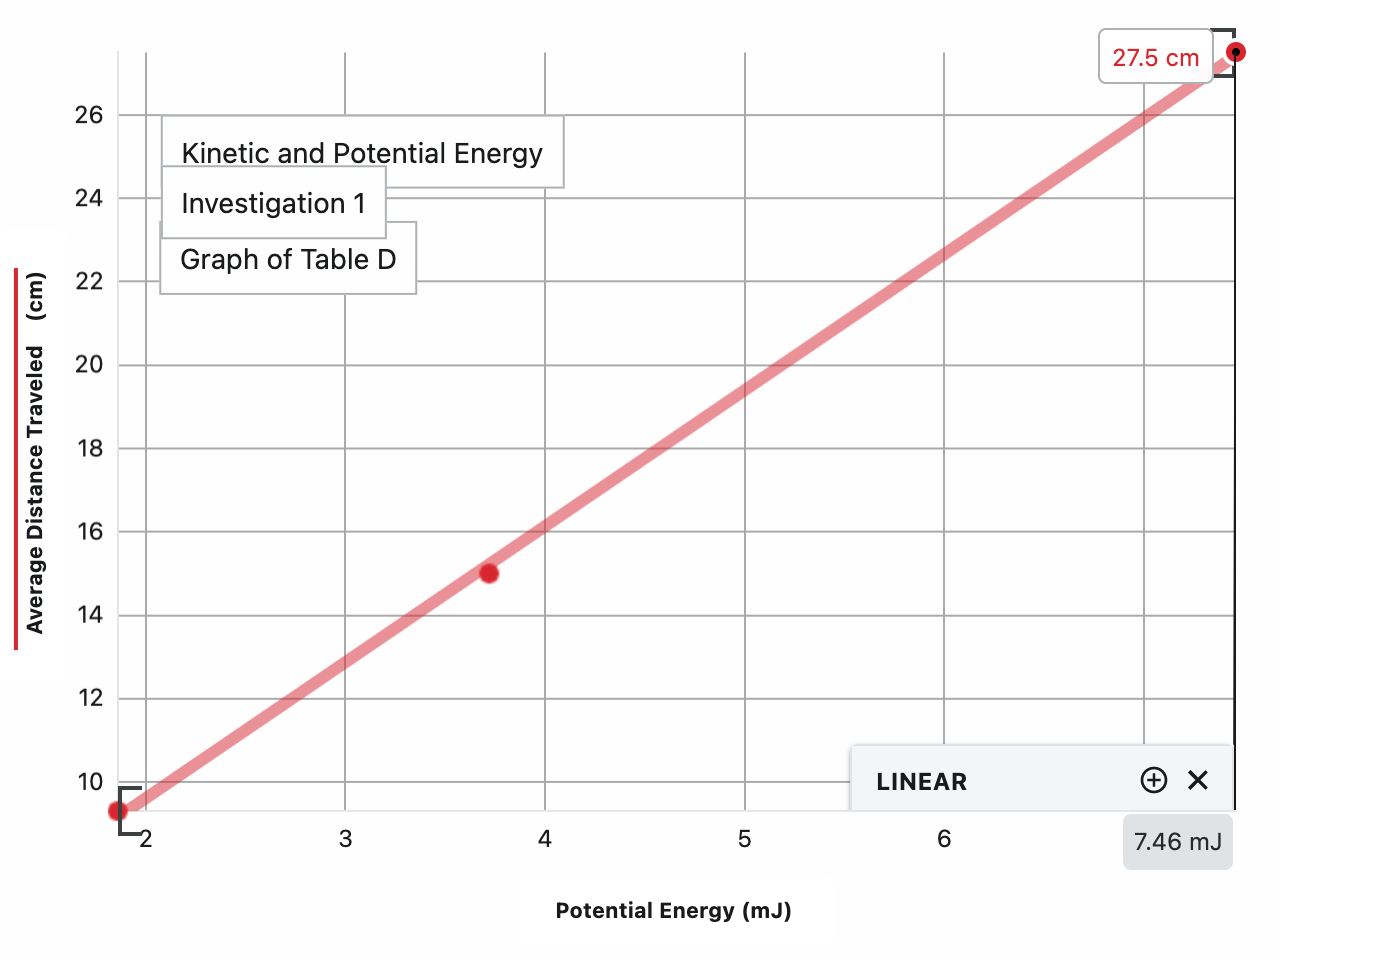
- Look at the graph. What is the relationship between the potential energy of the pendulum ball and the distance the bear traveled? Describe the data that support your answer. The greater the potential energy, the greater the distance the bear traveled. As the potential energy increased from 1.86 mJ to 3.72 mJ, the distance the bear traveled changed from 9.3 cm to 15 cm.
- How is the distance the bear traveled related to its kinetic energy? Think about the experiment with the hand and woodblock to help answer this question. Like the woodblock, the bear traveled the farthest distance when its kinetic energy was the greatest.
- How is the kinetic energy of the bear related to the potential energy of the pendulum ball? As the potential energy of the pendulum ball increased, the kinetic energy of the bear increased.
- Think about all of the results of the experiments performed. What conclusions can you make about the height of the pendulum ball, the potential energy of the ball, the kinetic energy of the ball, and the kinetic energy of the bear? Describe the data that support your answer. As the height of the pendulum ball increased from 5 cm to 20 cm, its potential energy increase from 1.86 mJ to 7.46 mJ. The increase in potential energy resulted in an increase in the kinetic energy of the ball. As the kinetic energy of the ball was transferred to the bear, the increase in kinetic energy of the ball produced an increase in the kinetic energy of the bear. This was shown by the increase in the distance that the bear traveled (9.3 cm to 27.5 cm).
- Describe the type of energy at each step in the pendulum ball experiment. The ball started out with potential energy. It had potential energy because it was not moving and was lifted above the surface of the table. The potential energy was converted to kinetic energy as the ball began to move. When the ball hit the bear, the kinetic energy in the ball was transferred to the bear, and the bear moved.
Investigation 2
Instruct students to complete the Analysis Questions in their SDRs then discuss them as a class. Use the suggested responses below to guide students’ answers.
- What is the temperature change for each light bulb? To find the change in temperature subtract the starting temperature from the temperature at 6 minutes. Write your answers in the last column of Table C. Sample data is shown below. Student answers may vary.
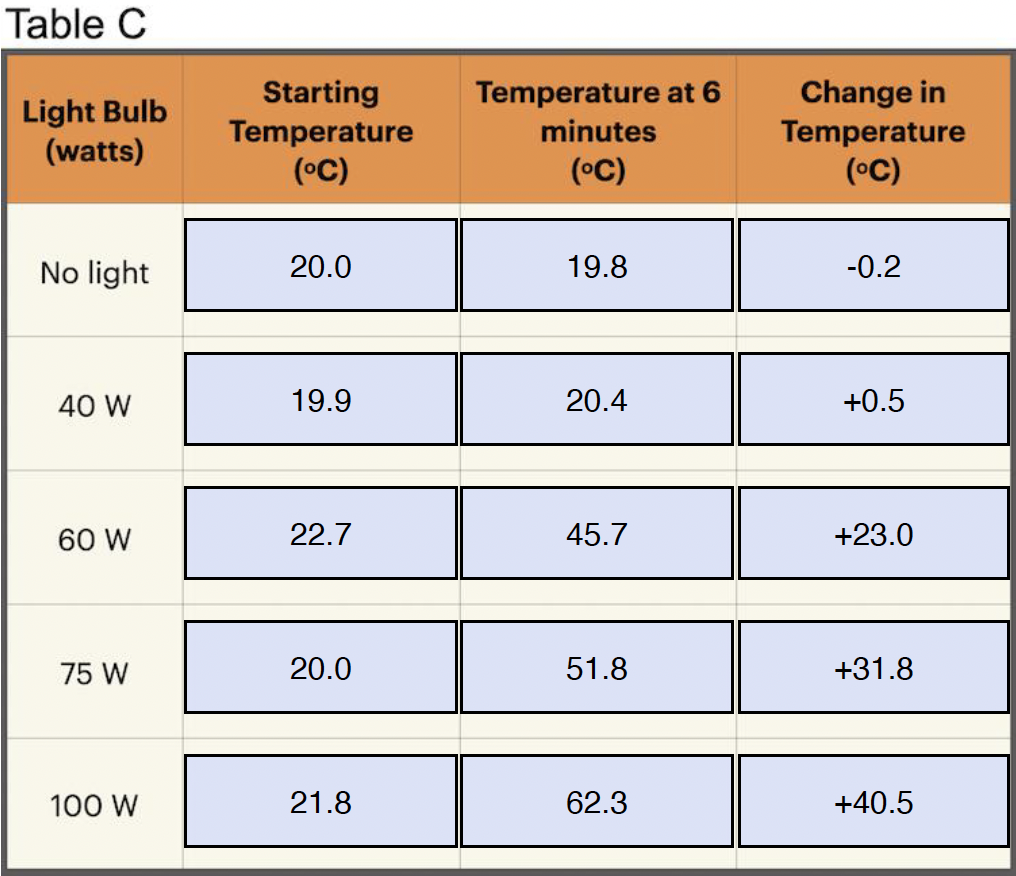
- What form of energy was light converted into in this experiment? Explain your answer. Light energy was converted to heat energy. When the light was not on, there was no heat produced. The temperature did not change. When the light was on, the heat was produced and the temperature increased.
- The temperature of a substance increases when particles of the substance move more quickly. The particles have more thermal energy. Is thermal energy (heat) a type of kinetic or potential energy? Why? Thermal energy is a type of kinetic energy. Kinetic energy is the energy of motion. Since thermal energy is a result of particles moving in a substance, it is kinetic energy.
- Did different light bulbs result in different amounts of thermal energy (heat)? Is there a relationship between the wattage of light bulbs and thermal energy? Support the answer with data from the experiment. Yes. Larger wattage light bulbs produced more heat over 8 minutes than lower wattage bulbs. The 40 W light bulb showed an increase in temperature of 14ºC. The 100 W light bulb showed an increase in temperature of 33ºC .
Note: Students should transfer data from Table B and Table C into Table D. This data will be used to construct a graph of light intensity for each light bulb vs. change in temperature for each light bulb.
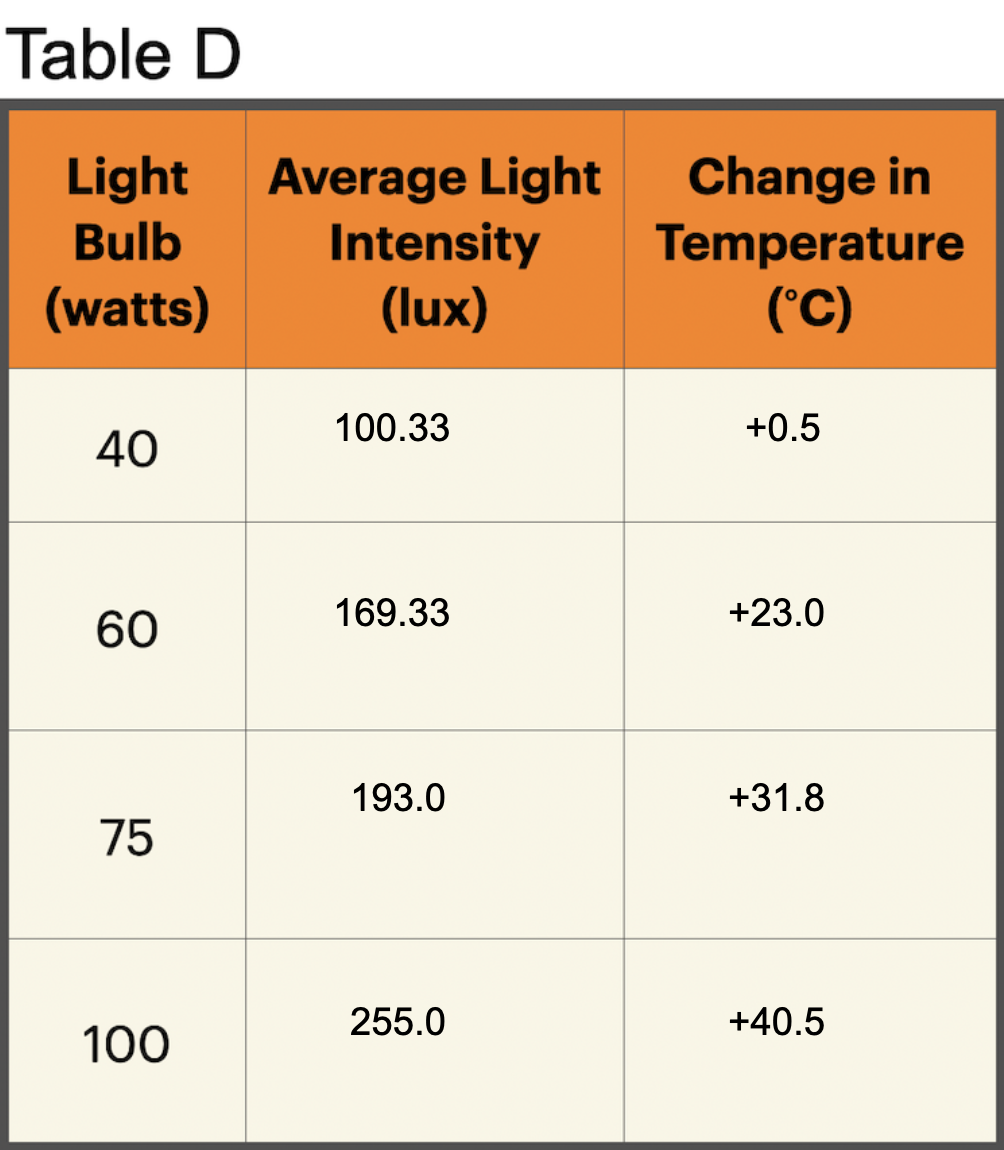
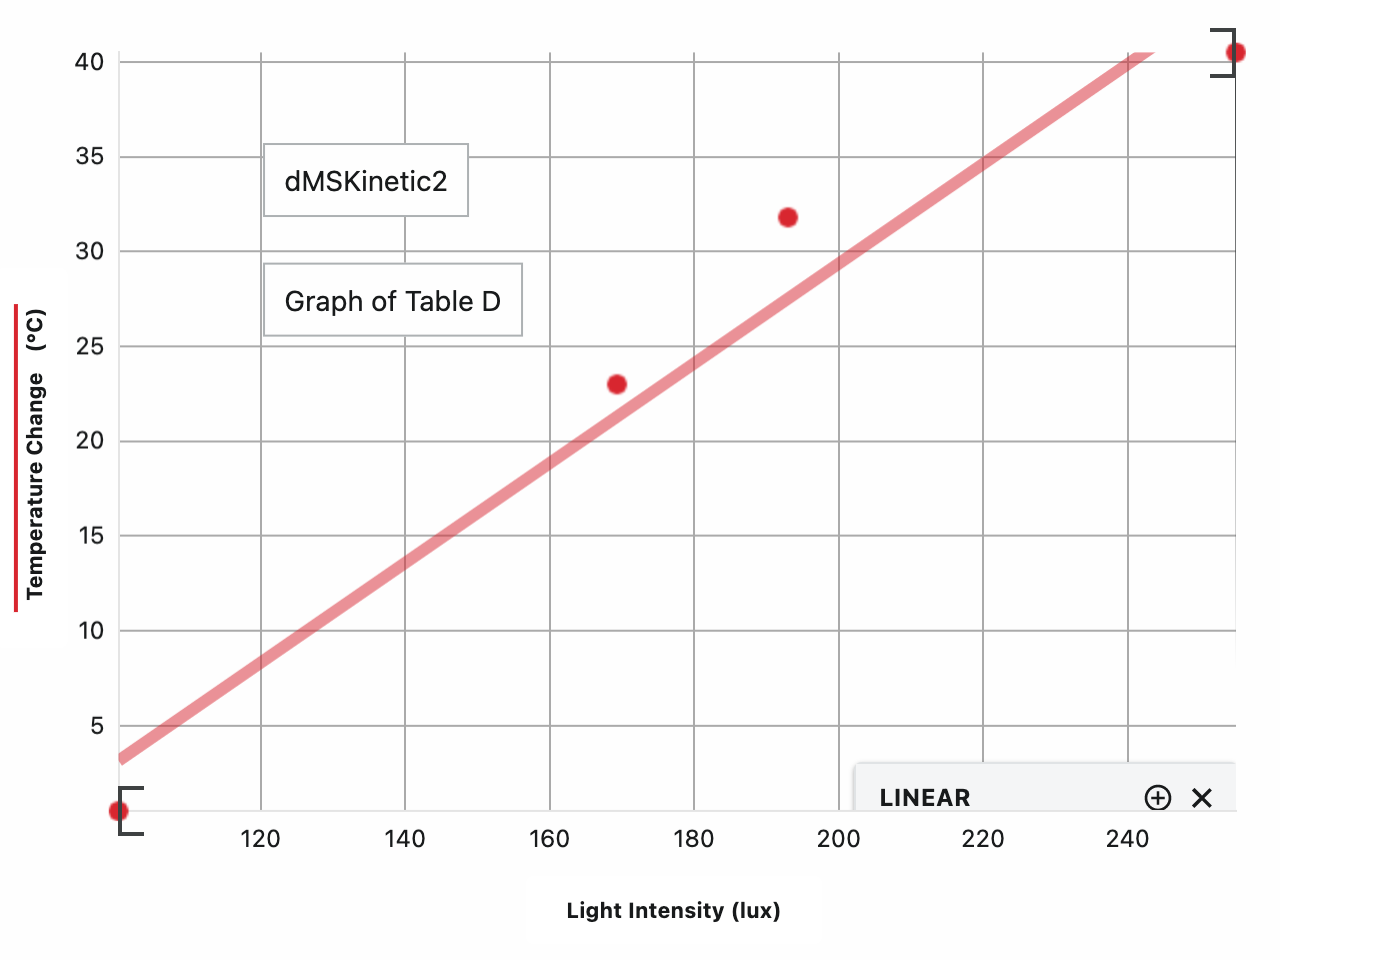
- Look at the graph. How does the amount of light energy of each light bulb relate to the amount of heat energy in the air around each light bulb? Use data to support the answer. As light energy increased the amount of heat increased. Light energy of 260 lux showed an increase in air temperature of 14ºC. A greater amount of light energy (860 lux) showed a greater increase in air temperature (33ºC). There was a direct relationship between light energy and heat energy, as shown by the straight line on the graph.
Analyze the graph as a class.
- Tell students that the straight line on the graph demonstrates a direct relationship between light energy and heat energy.
- This direct relationship indicates that energy was conserved in this system as it was transferred from light energy to heat energy.
- If energy was not conserved, the line would not be straight.
Note: Questions marked with a triangle (∆) are included to enrich students’ understanding. These questions do not appear in students’ SDRs but should be used as additional discussion points during the PostLab.
Review the forms and types of energy observed in Investigation Two with the following questions:
- What forms of energy were used in this Investigation? Electrical energy, light energy, and heat (thermal energy).
- Were these forms of energy kinetic energy, potential energy, or both? Electrical energy was potential energy until the light was turned on and charges began moving – then it was kinetic energy. Light energy is kinetic energy because light consists of moving photons. Thermal energy is kinetic energy because it is due to the motion of particles in a substance (air in this Investigation).
- Was energy converted in this experiment? Yes. Energy was converted from electrical energy to light energy to thermal energy (heat). Energy was also converted from potential energy (electrical) to kinetic energy (electrical, light, and heat).
Investigation 3
- Think about the chemical reaction of vinegar and baking soda and the information in the Background at the beginning of the Investigation. What caused the circumference of the balloon to change? The circumference of the balloon changed as the balloon began to fill with the carbon dioxide gas formed from the reaction of vinegar and baking soda.
- What type of energy was in the chemical reaction of baking soda and vinegar? Both the baking soda and vinegar had chemical potential energy that was released when the reaction started. Once the reaction began, the potential energy was converted to kinetic energy.
- What type of energy did the balloon have when it was inflating? When it stopped inflating? As the balloon was filling up and moving, it had kinetic energy. Once the balloon stopped moving, it had potential energy because it had moved from its rest position to a higher position.
- Was energy converted during the experiment? Yes. Why? The energy was stored in the bonds of the vinegar and baking soda in the form of chemical potential energy. The chemical reaction released this energy and formed a gas. The energy was transferred to kinetic energy as the balloon blew up. When the balloon stopped moving and was filled with gas, it had potential energy.
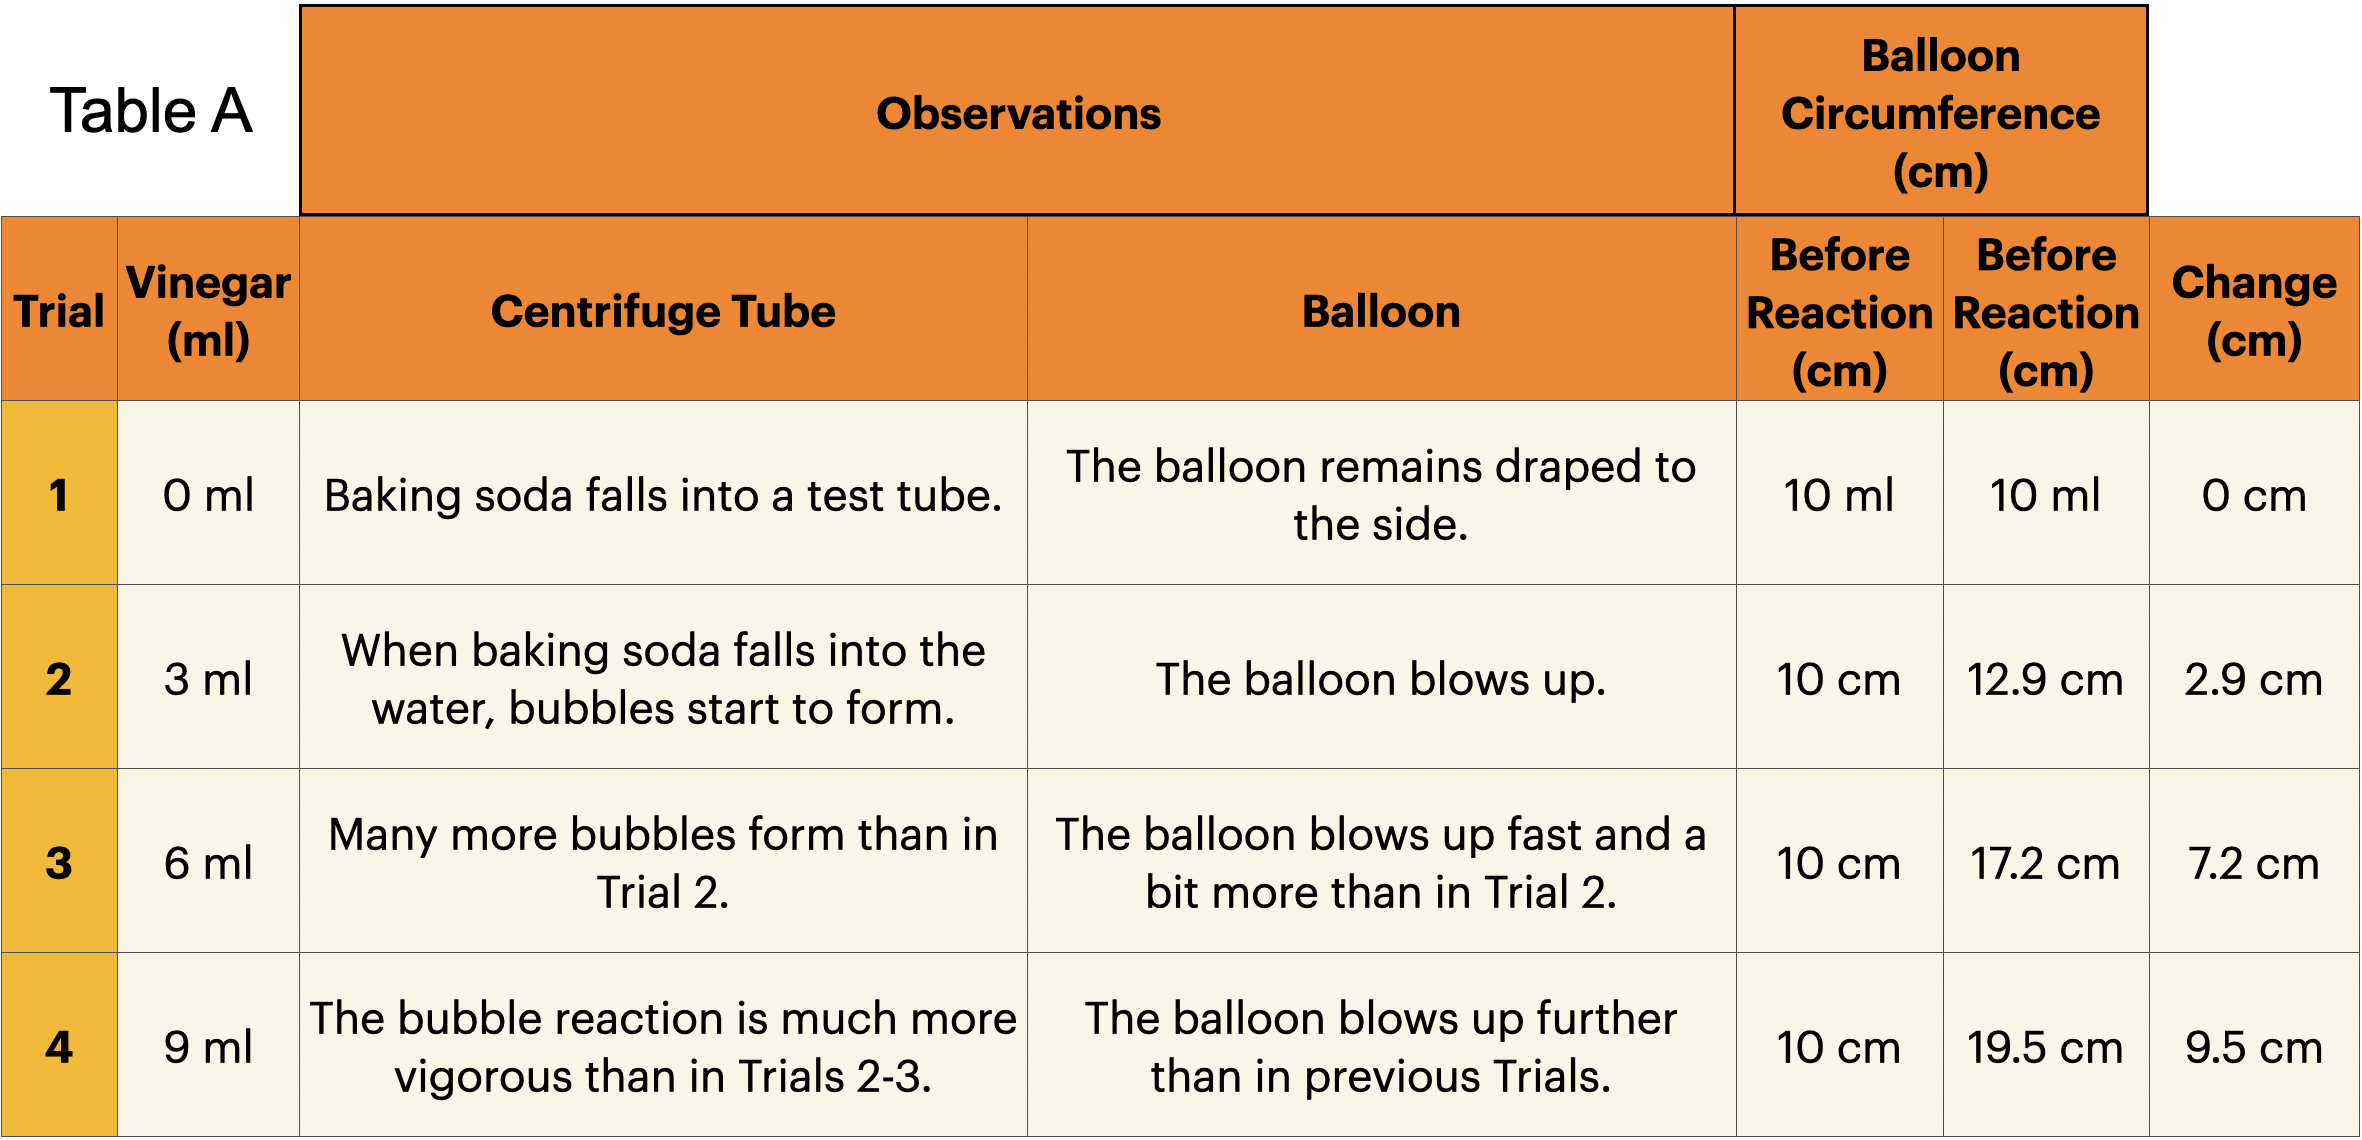
- Look at the observations column of Table A. What signs did you observe that suggest the rate of the chemical reaction and the amount of product formed changed with different amounts of vinegar? The increase in the number of bubbles and the increased speed with which the bubbles appeared were observed as evidence that the rate of the reaction and products of the chemical reaction increased as the amount of vinegar increased.
- How did the amount of chemical potential energy change as the amount of vinegar increased? As the amount of vinegar increased, more vinegar could react with the baking soda and more chemical energy was released. There were a lot more bubbles and the reaction occurred a lot more vigorously (balloon blew up faster and larger) with 9 ml of vinegar than with 3 ml of vinegar.
Note: Students should construct a graph that compares the volume of vinegar in the reaction with the change in circumference of the balloon.
Assist students in graphing and Drawing a Best Fit Line as necessary.
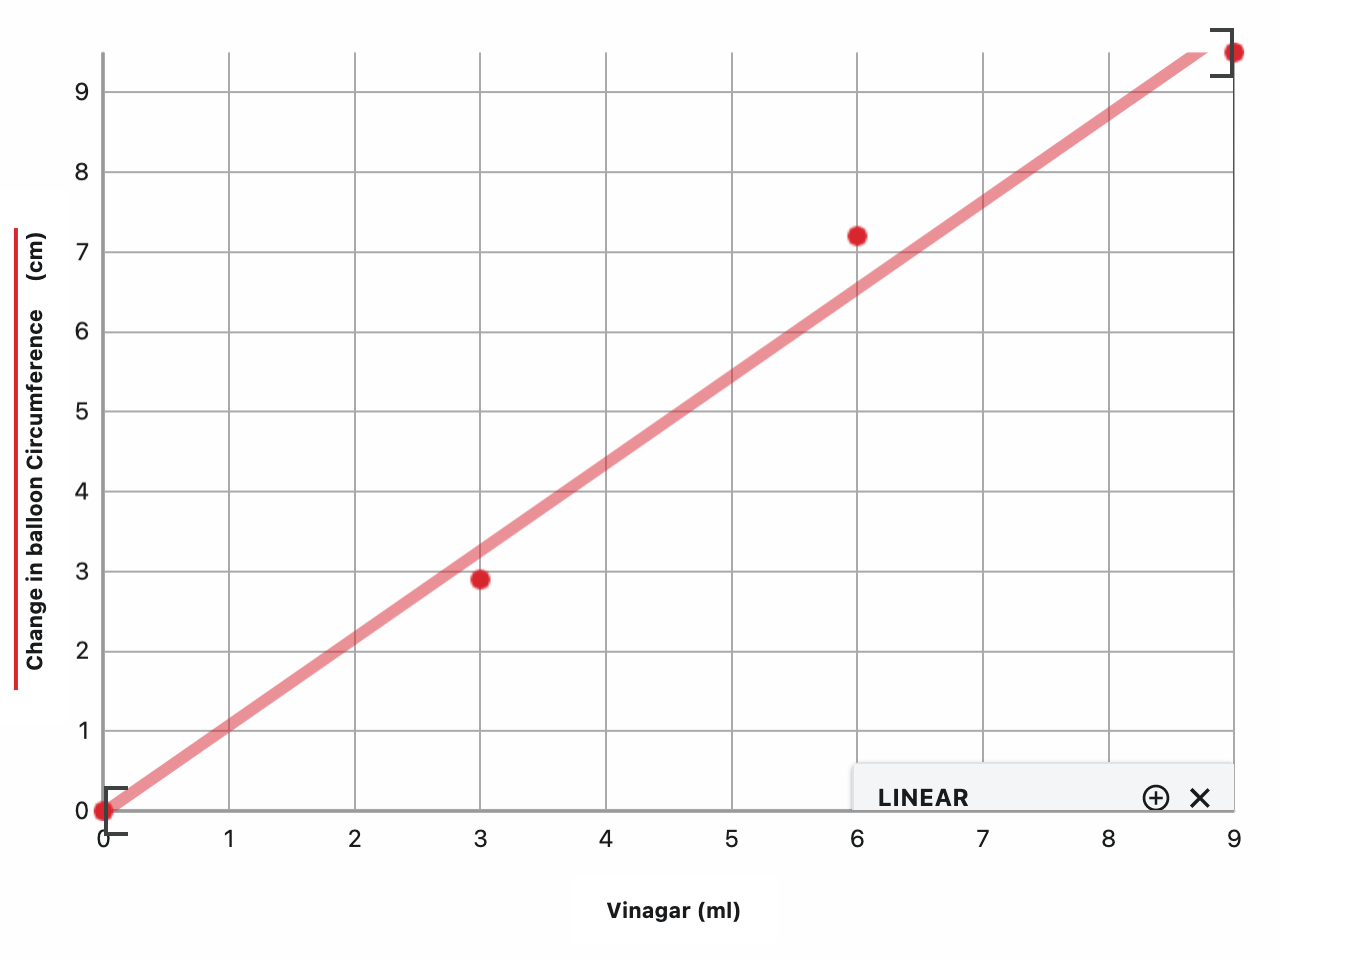
- As the amount of vinegar increased, what happened to the circumference of the balloon? The circumference of the balloon increased as the amount of vinegar increased. With 3 ml of vinegar, the change in circumference of the balloon was 2.9 cm. With 9 ml of vinegar, the change in circumference was 9.5 cm.
- Use the graph to make a prediction. What would the circumference of the balloon be if the volume of vinegar was 5 ml? Use proper units. Student answers will vary based on the data that they obtain. Sample answer based on the above graph: 5.5 cm.
- As the amount of vinegar increased, what happened to the kinetic and potential energy of the balloon? As the amount of vinegar increased, the kinetic and potential energy of the balloon increased. This was observed as the increase in the circumference of the balloon.
- Think about the data in Table A and the graph. Describe the relationship between the amount of vinegar in the reaction, the chemical potential energy of the reaction, and the kinetic and potential energy of the balloon. As the volume of vinegar in the reaction increased, the chemical potential energy of the reaction increased. The increase in chemical potential energy resulted in increases in the kinetic energy and potential energy of the balloon.
- Can you think of some ways that the energy from chemical reactions is used in everyday life? Some examples are batteries, inflation of automobile airbags, ice-melting chemicals, light sticks, the light from fireflies (chemiluminescence), chemical cold packs and hot packs, leavening in baking, and campfires (combustion).
Comprehension Check
How does the transfer of potential energy to kinetic energy relate to the Law of Conservation of Energy? All of the energy changes observed in the Investigation will be due to the transfer of energy from potential to kinetic or from kinetic to kinetic and not because energy disappeared or was created.
Can one form of energy be converted to another? Support your answer with data from the experiments. In this Investigation, students will observe the conversion of electrical energy to light energy and the conversion of light energy to thermal energy (heat).
How does converting energy from one form to another relate to the conservation of energy? The Law of Conservation of Energy states that energy cannot be created or destroyed but can be converted from one form to another. Both of the graphs in Investigation Two will show direct relationships for the conversion of electrical energy to light and light energy to heat.
Can one form of energy be converted to another? Support your answer with data from the experiments. Students will observe the conversion of chemical potential energy to kinetic energy.
How does converting energy from one form to another relate to the Law of Conservation of Energy? The Law of Conservation of Energy states that energy cannot be created or destroyed but can be converted from one form to another. Students will observe a direct relationship between the amount of vinegar (chemical potential energy) and the circumference of the balloon.